| Param | Original file | Final file |
|---|---|---|
| Filename | modeM0/AS1A05_202T01_9000002484_16741cztM0_level2.evt | modeM0/AS1A05_202T01_9000002484_16741cztM0_level2_quad_clean.evt |
| Size (bytes) | 1,191,936,960 | 185,425,920 |
| Size | 1.1 GB | 176.8 MB |
| Events in quadrant A | 11,185,014 | 1,102,171 |
| Events in quadrant B | 5,648,061 | 1,298,202 |
| Events in quadrant C | 5,603,156 | 1,250,044 |
| Events in quadrant D | 12,881,584 | 1,163,359 |
| Mode M0 | |||
|---|---|---|---|
| Quadrant | BADHDUFLAG | Total packets | Discarded packets |
| A | 0 | 41084 | 3 |
| B | 0 | 24284 | 2 |
| C | 0 | 23925 | 2 |
| D | 0 | 46369 | 2 |
| Mode M9 | |||
|---|---|---|---|
| Quadrant | BADHDUFLAG | Total packets | Discarded packets |
| A | 0 | 16 | 0 |
| B | 0 | 16 | 0 |
| C | 0 | 16 | 0 |
| D | 0 | 16 | 0 |
| Mode SS | |||
|---|---|---|---|
| Quadrant | BADHDUFLAG | Total packets | Discarded packets |
| A | 0 | 234 | 0 |
| B | 0 | 234 | 0 |
| C | 0 | 234 | 0 |
| D | 0 | 234 | 0 |
| Quadrant | Total seconds | Saturated seconds | Saturation percentage |
|---|---|---|---|
| A | 11584 | 2313 | 19.967196% |
| B | 11584 | 131 | 1.130870% |
| C | 11584 | 144 | 1.243094% |
| D | 11584 | 1172 | 10.117403% |
Noise dominated data is calculated using 1-second bins in cleaned event files. If a bin has >2000 counts, and if more than 50% of those come from <1% of pixels, then it is considered to be noise-dominated and hence unusable.
| Quadrant | # 1 sec bins | Bins with >0 counts | Bins with >2000 counts | High rate bins dominated by noise | Noise dominated (total time) | Noise dominated (detector-on time) | Marked lightcurve |
|---|---|---|---|---|---|---|---|
| A | 13135 | 11587 | 1871 | 1871 | 14.24% | 16.15% | 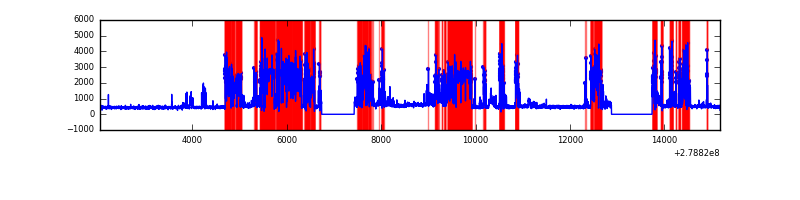 |
| B | 13135 | 11587 | 20 | 20 | 0.15% | 0.17% | 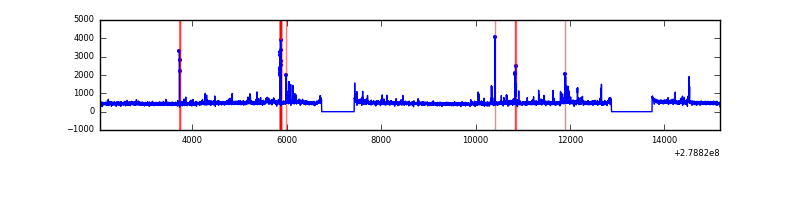 |
| C | 13135 | 11587 | 1 | 1 | 0.01% | 0.01% | 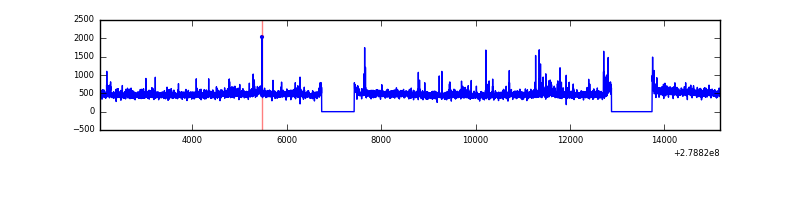 |
| D | 13135 | 11586 | 922 | 922 | 7.02% | 7.96% | 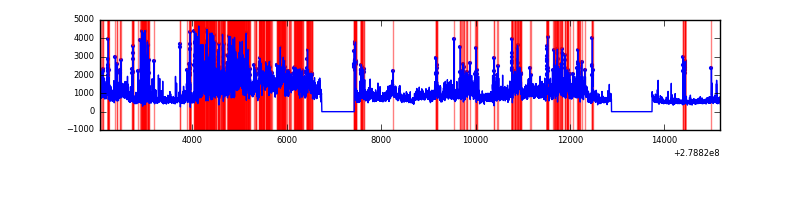 |
Top three noisy pixels from each quadrant. If the there are fewer than three noisy pixels in the level2.evt file, extra rows are filled as -1
| Pixel properties | Quadrant properties | ||||||
|---|---|---|---|---|---|---|---|
| Quadrant | DetID | PixID | Counts | Sigma | Mean | Median | Sigma |
| A | 15 | 174 | 6524661 | 26874.5 | 1211 | 1183 | 242.7 |
| A | 0 | 226 | 10801 | 39.62 | 1211 | 1183 | 242.7 |
| A | 12 | 194 | 8969 | 32.08 | 1211 | 1183 | 242.7 |
| B | 15 | 35 | 120139 | 461.01 | 1358 | 1321 | 257.7 |
| B | 5 | 236 | 61005 | 231.57 | 1358 | 1321 | 257.7 |
| B | 0 | 189 | 47787 | 180.29 | 1358 | 1321 | 257.7 |
| C | 14 | 238 | 202428 | 660.56 | 1312 | 1317 | 304.5 |
| C | 0 | 207 | 152982 | 498.15 | 1312 | 1317 | 304.5 |
| C | 7 | 247 | 99179 | 321.43 | 1312 | 1317 | 304.5 |
| D | 1 | 52 | 5944189 | 19334.1 | 1276 | 1239 | 307.4 |
| D | 2 | 16 | 1211655 | 3937.83 | 1276 | 1239 | 307.4 |
| D | 10 | 70 | 291875 | 945.52 | 1276 | 1239 | 307.4 |
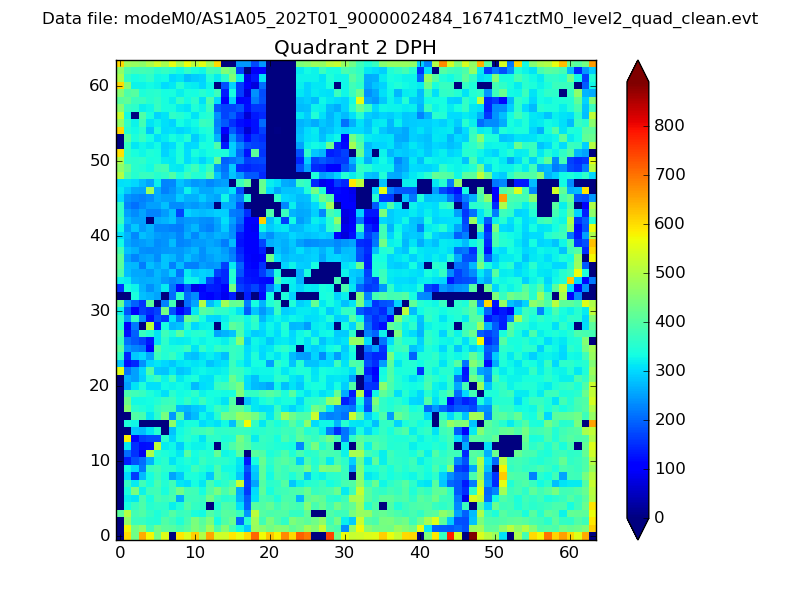
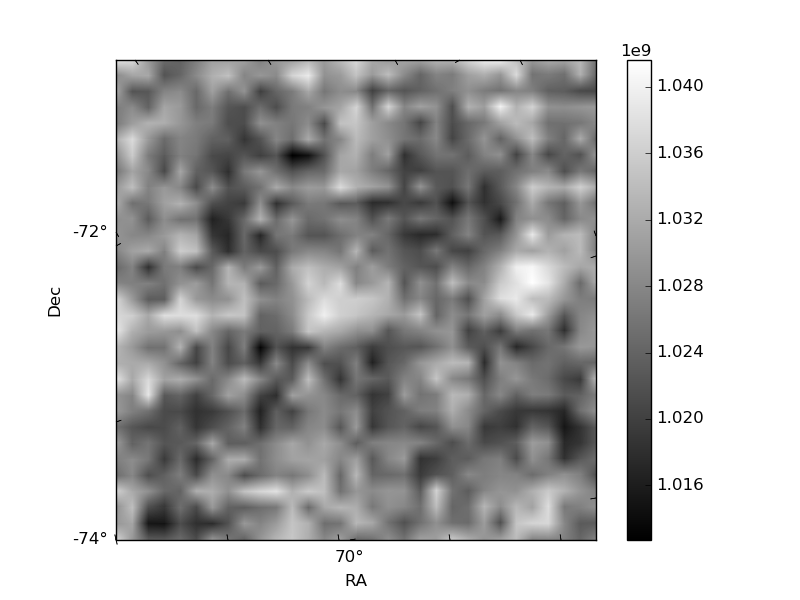
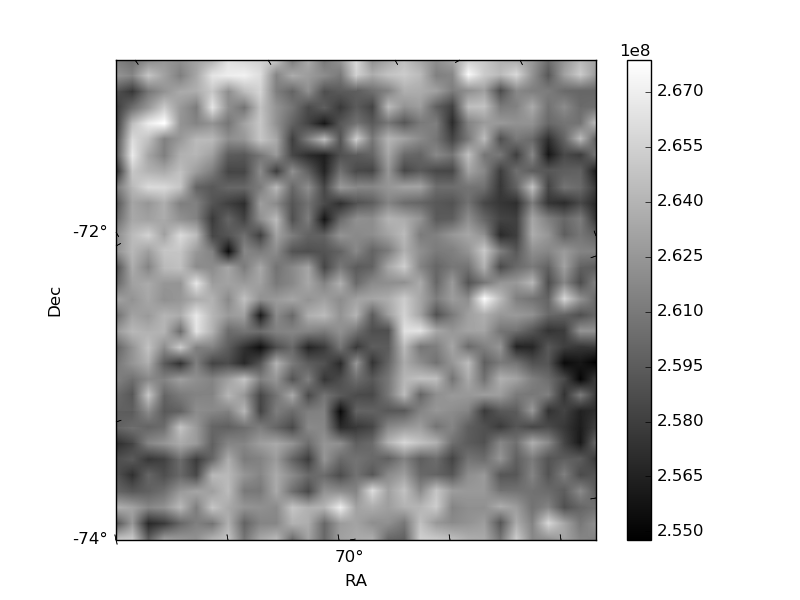
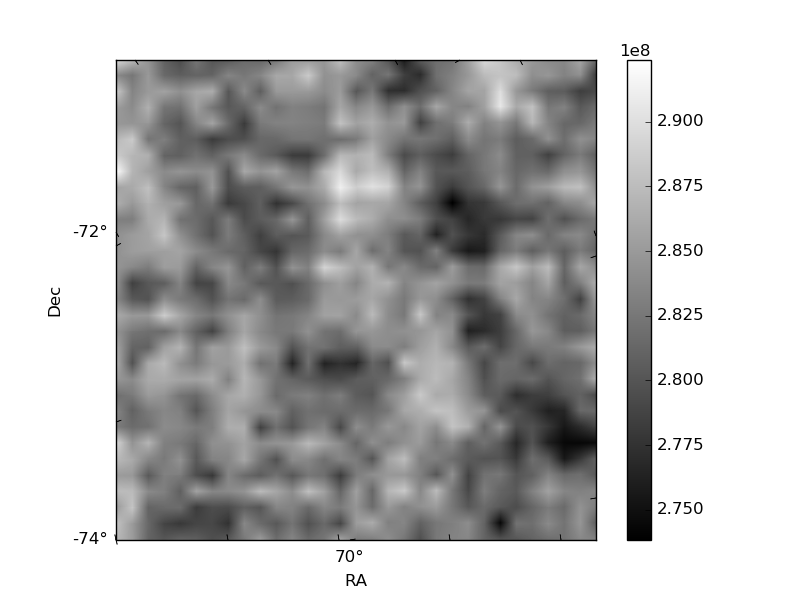
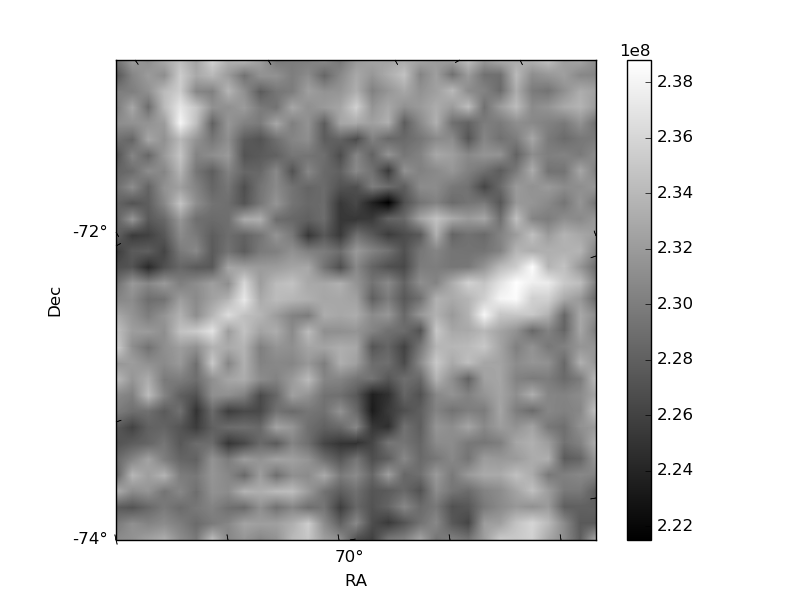
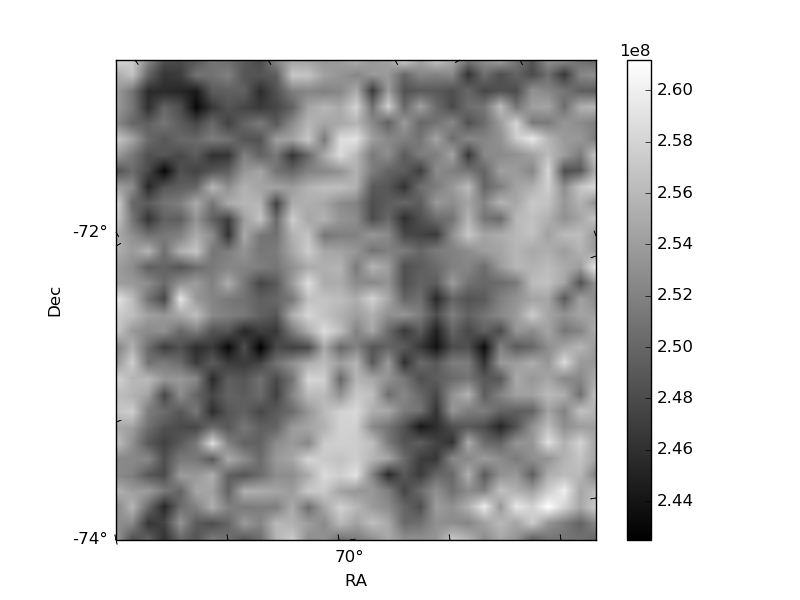
Histogram calculated using DETX and DETY for each event in the final _common_clean file
| Quadrant A | 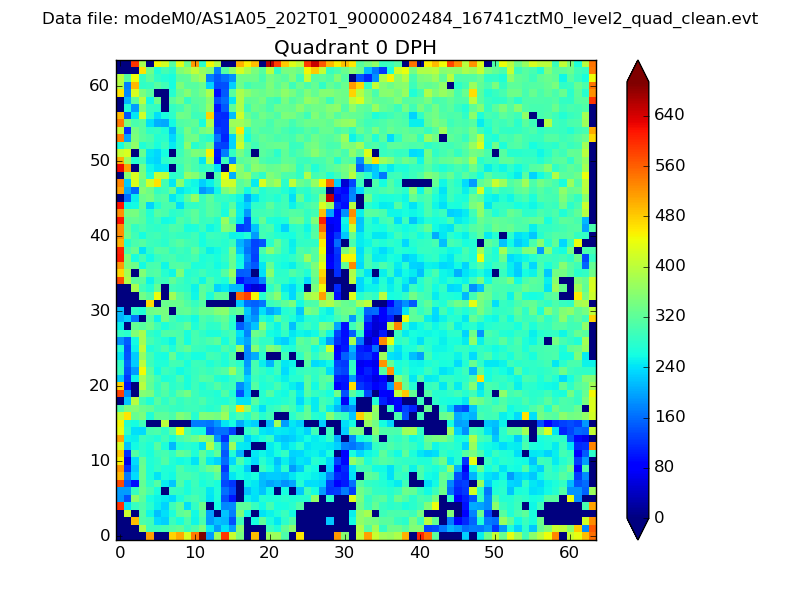 |
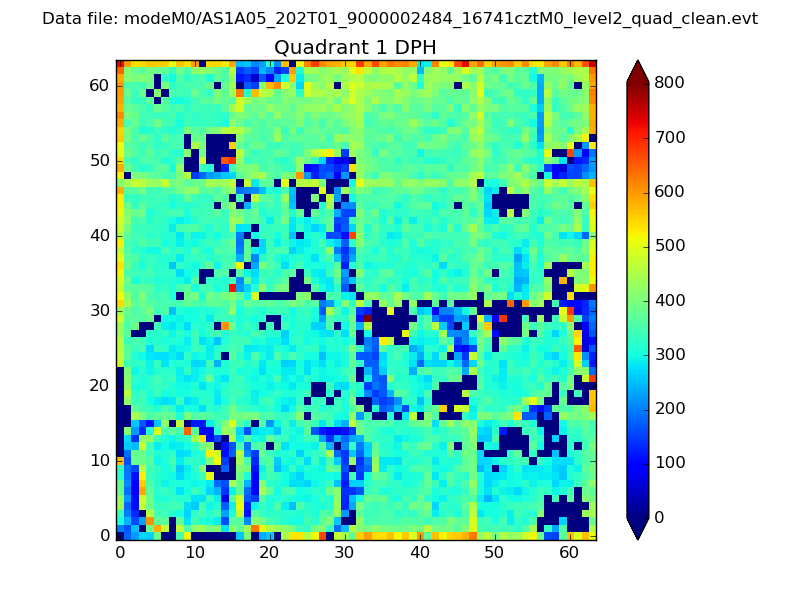 |
Quadrant B |
|---|---|---|---|
| Quadrant D | 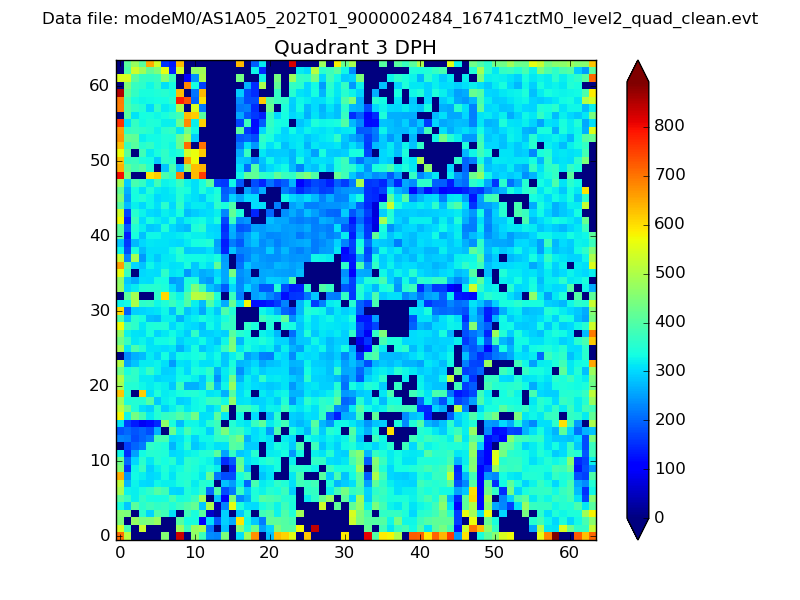 |
 |
Quadrant C |
| Plot type | Count rate plots | Images |
|---|---|---|
| Comparison with Poisson distribution Blue bars denote a histogram of data divided into 1 sec bins. Red curve is a Poisson curve with rate = median count rate of data. |
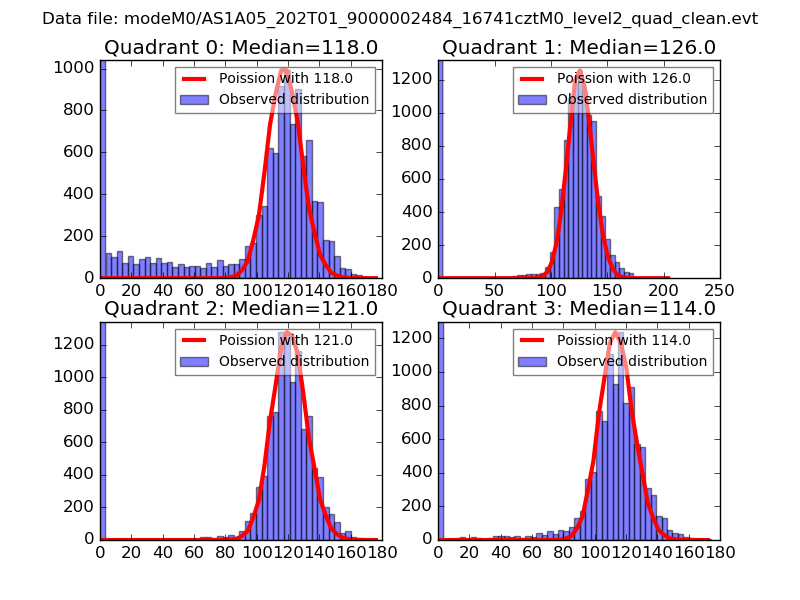 |
 |
| Quadrant-wise count rates Data is divided into 100 sec bins |
 |
|
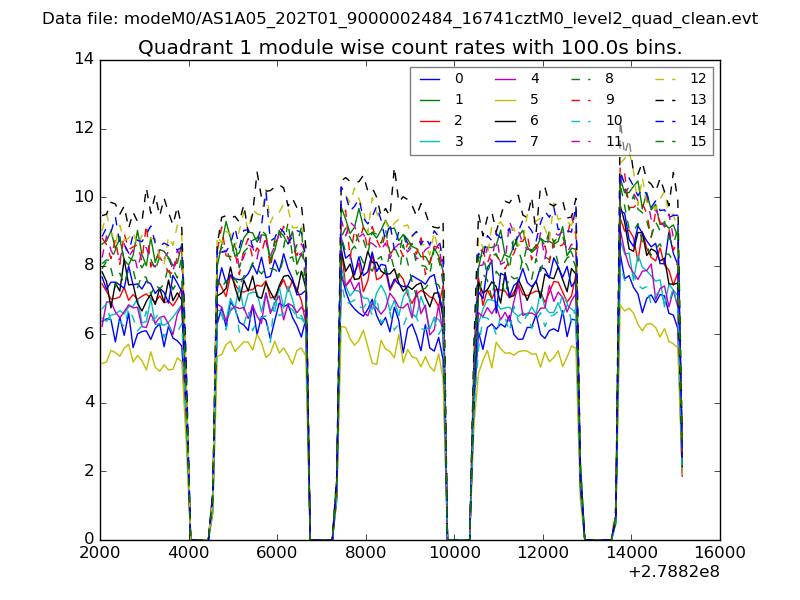
| Module-wise count rates for Quadrant A Data is divided into 100 sec bins |
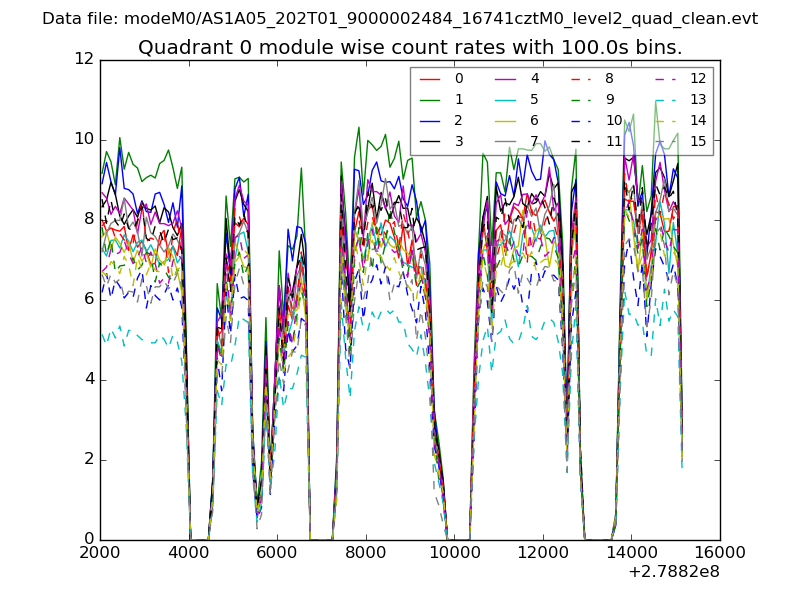 |
 |
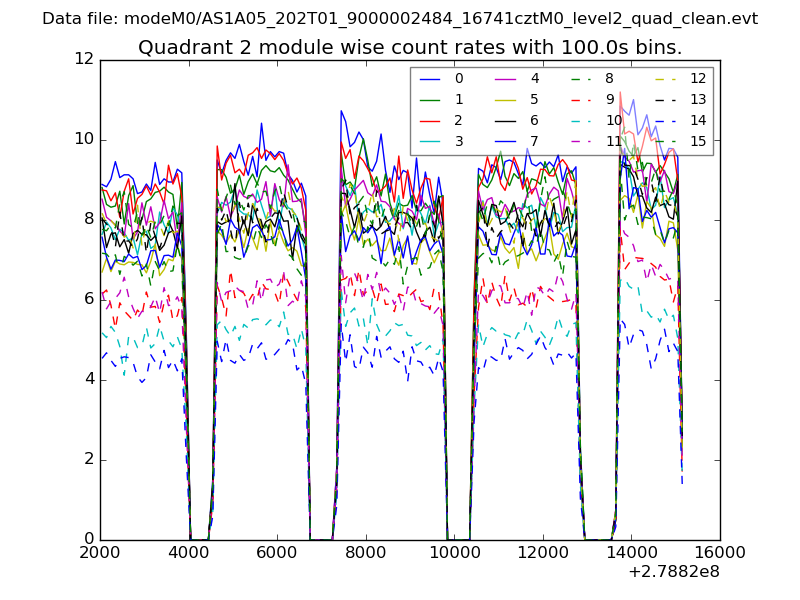
| Module-wise count rates for Quadrant B Data is divided into 100 sec bins |
 |
 |
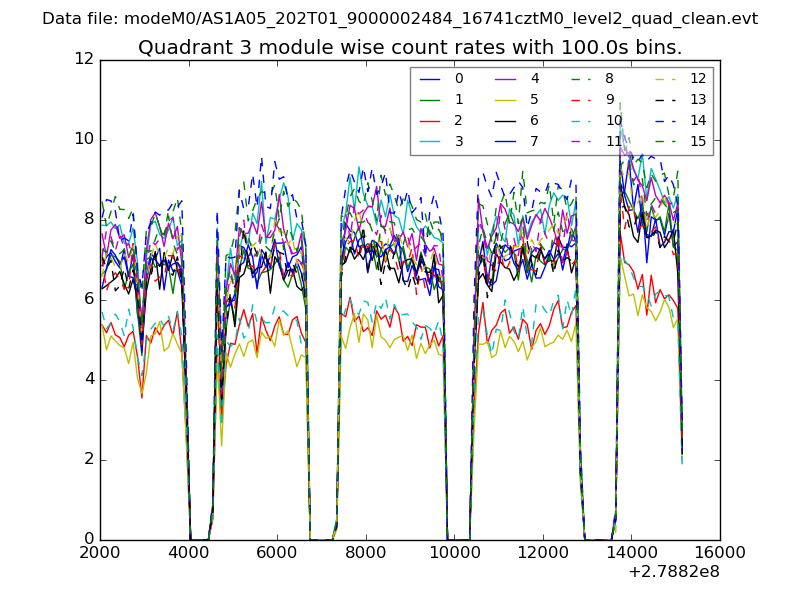
| Module-wise count rates for Quadrant C Data is divided into 100 sec bins |
 |
 |
| Module-wise count rates for Quadrant D Data is divided into 100 sec bins |
 |
 |
| Parameter | Plot |
|---|---|
| CZT HV Monitor | 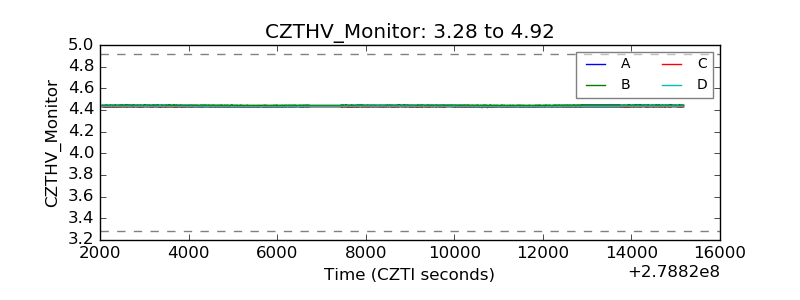 |
| D_VDD | 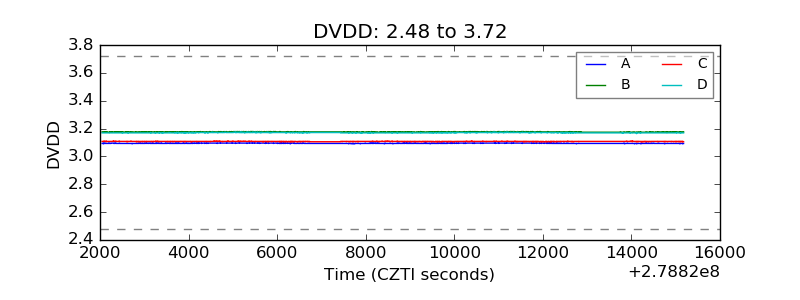 |
| Temperature 1 | 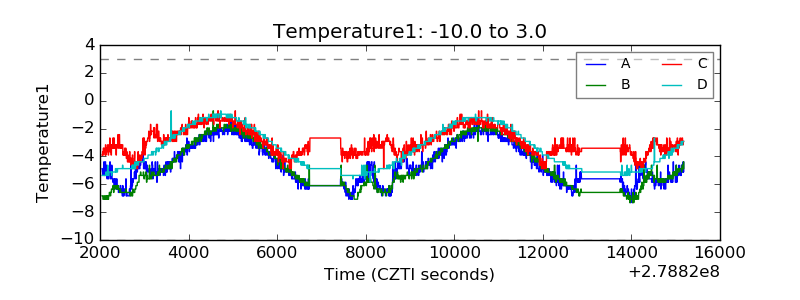 |
| Veto HV Monitor |  |
| Veto LLD |  |
| Alpha Counter | 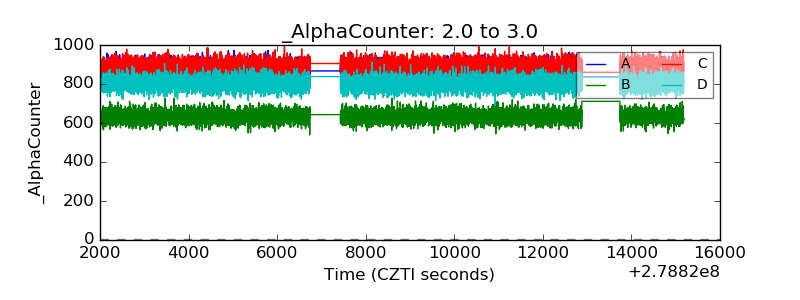 |
| _CPM_Rate | 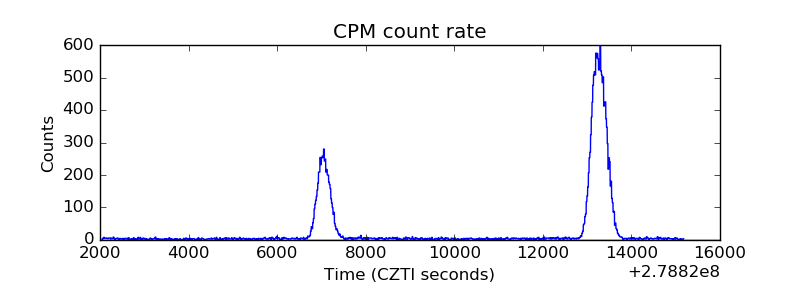 |
| CZT Counter | 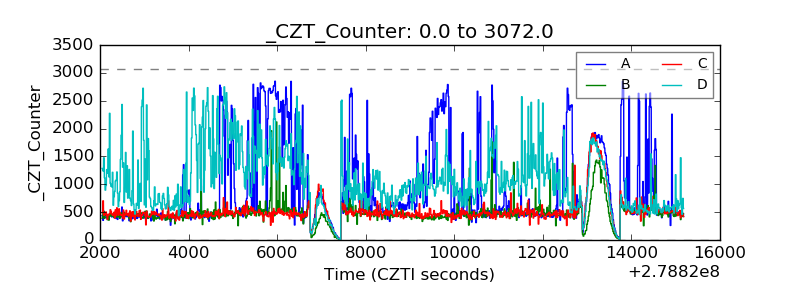 |
| +2.5 Volts monitor |  |
| +5 Volts monitor |  |
| _ROLL_ROT | 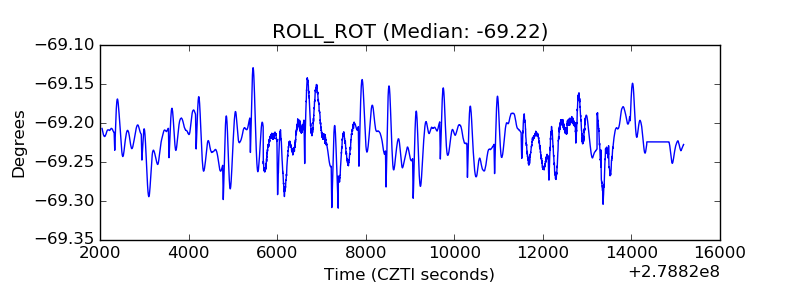 |
| _Roll_DEC | 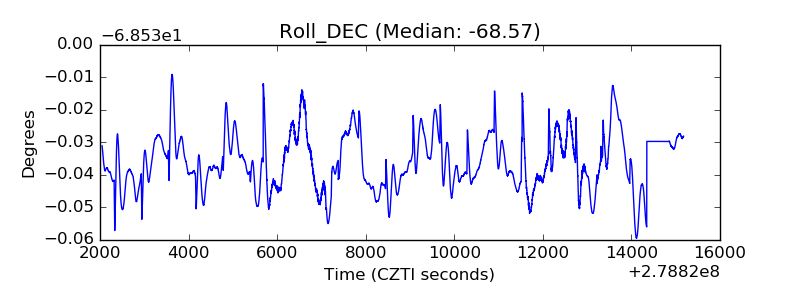 |
| _Roll_RA |  |
| Veto Counter | 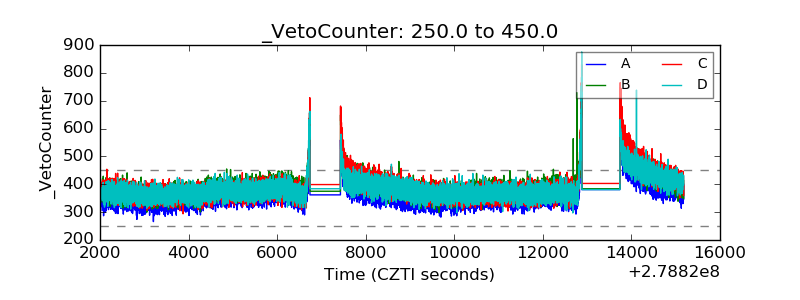 |