| Param | Original file | Final file |
|---|---|---|
| Filename | modeM0/AS1A05_202T01_9000002484_16742cztM0_level2.evt | modeM0/AS1A05_202T01_9000002484_16742cztM0_level2_quad_clean.evt |
| Size (bytes) | 504,590,400 | 109,105,920 |
| Size | 481.2 MB | 104.1 MB |
| Events in quadrant A | 3,867,958 | 717,648 |
| Events in quadrant B | 3,084,714 | 747,049 |
| Events in quadrant C | 3,226,905 | 715,924 |
| Events in quadrant D | 4,679,410 | 688,722 |
| Mode M0 | |||
|---|---|---|---|
| Quadrant | BADHDUFLAG | Total packets | Discarded packets |
| A | 0 | 15474 | 2 |
| B | 0 | 13083 | 1 |
| C | 0 | 13556 | 1 |
| D | 0 | 18238 | 1 |
| Mode M9 | |||
|---|---|---|---|
| Quadrant | BADHDUFLAG | Total packets | Discarded packets |
| A | 0 | 10 | 0 |
| B | 0 | 10 | 0 |
| C | 0 | 10 | 0 |
| D | 0 | 10 | 0 |
| Mode SS | |||
|---|---|---|---|
| Quadrant | BADHDUFLAG | Total packets | Discarded packets |
| A | 0 | 126 | 0 |
| B | 0 | 126 | 0 |
| C | 0 | 126 | 0 |
| D | 0 | 126 | 0 |
| Quadrant | Total seconds | Saturated seconds | Saturation percentage |
|---|---|---|---|
| A | 6234 | 237 | 3.801732% |
| B | 6234 | 83 | 1.331408% |
| C | 6234 | 103 | 1.652230% |
| D | 6234 | 195 | 3.128008% |
Noise dominated data is calculated using 1-second bins in cleaned event files. If a bin has >2000 counts, and if more than 50% of those come from <1% of pixels, then it is considered to be noise-dominated and hence unusable.
| Quadrant | # 1 sec bins | Bins with >0 counts | Bins with >2000 counts | High rate bins dominated by noise | Noise dominated (total time) | Noise dominated (detector-on time) | Marked lightcurve |
|---|---|---|---|---|---|---|---|
| A | 7230 | 6235 | 126 | 126 | 1.74% | 2.02% | 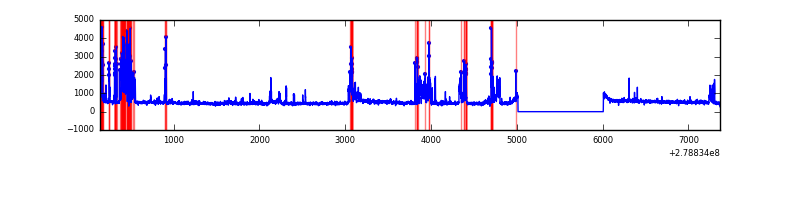 |
| B | 7230 | 6236 | 4 | 4 | 0.06% | 0.06% | 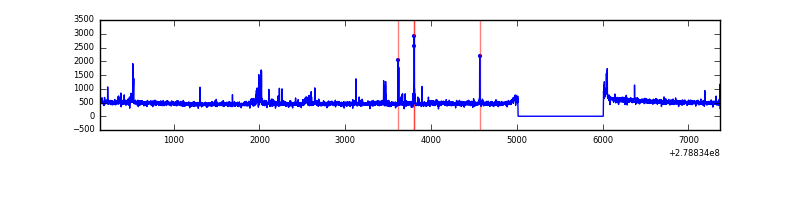 |
| C | 7230 | 6235 | 2 | 2 | 0.03% | 0.03% | 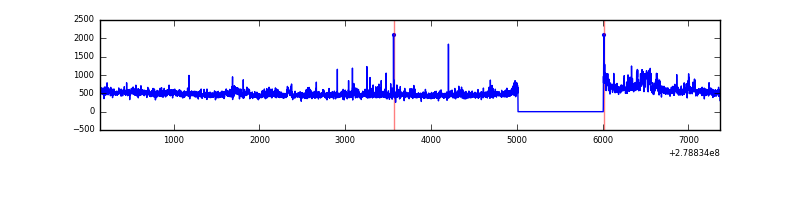 |
| D | 7230 | 6236 | 117 | 117 | 1.62% | 1.88% | 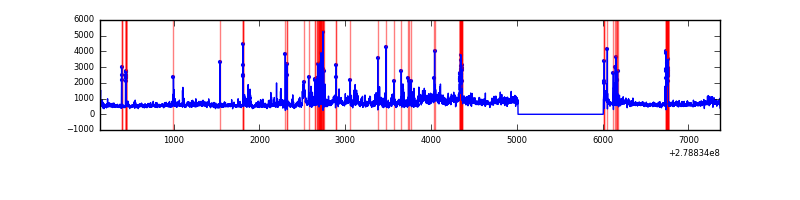 |
Top three noisy pixels from each quadrant. If the there are fewer than three noisy pixels in the level2.evt file, extra rows are filled as -1
| Pixel properties | Quadrant properties | ||||||
|---|---|---|---|---|---|---|---|
| Quadrant | DetID | PixID | Counts | Sigma | Mean | Median | Sigma |
| A | 15 | 174 | 989752 | 6578.55 | 746 | 728 | 150.3 |
| A | 10 | 234 | 11051 | 68.66 | 746 | 728 | 150.3 |
| A | 0 | 226 | 6577 | 38.9 | 746 | 728 | 150.3 |
| B | 15 | 35 | 45049 | 310.3 | 754 | 734 | 142.8 |
| B | 5 | 236 | 37404 | 256.77 | 754 | 734 | 142.8 |
| B | 10 | 16 | 29359 | 200.44 | 754 | 734 | 142.8 |
| C | 14 | 238 | 111280 | 652.59 | 731 | 734 | 169.4 |
| C | 7 | 247 | 111236 | 652.33 | 731 | 734 | 169.4 |
| C | 3 | 233 | 101154 | 592.82 | 731 | 734 | 169.4 |
| D | 2 | 16 | 764546 | 4336.68 | 731 | 710 | 176.1 |
| D | 1 | 52 | 755868 | 4287.41 | 731 | 710 | 176.1 |
| D | 12 | 110 | 115904 | 654.01 | 731 | 710 | 176.1 |
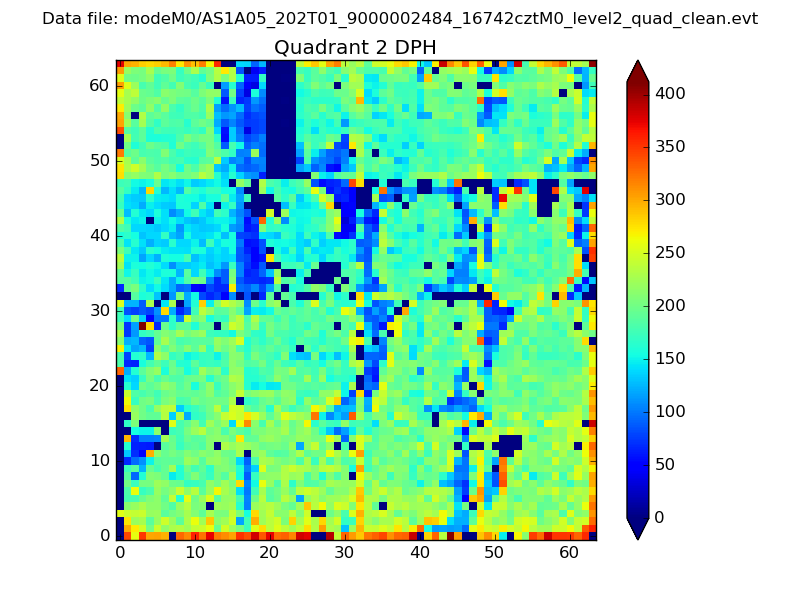
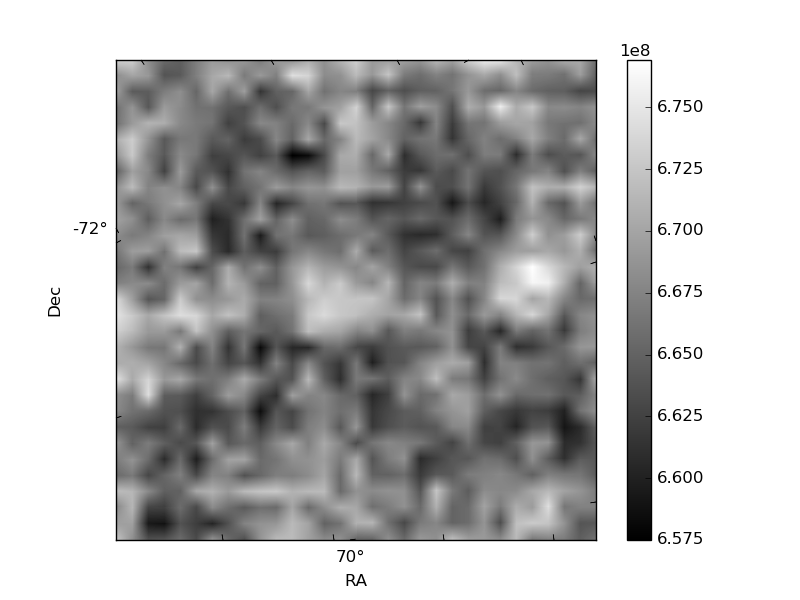
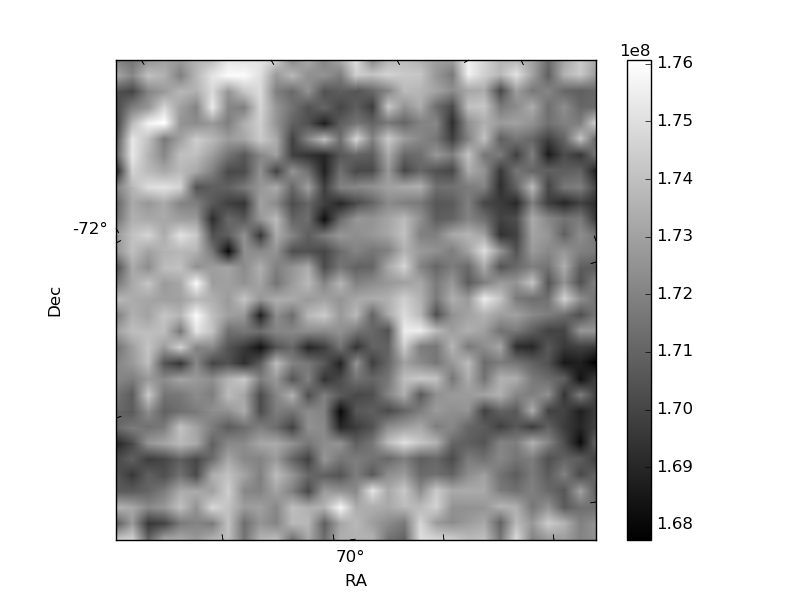
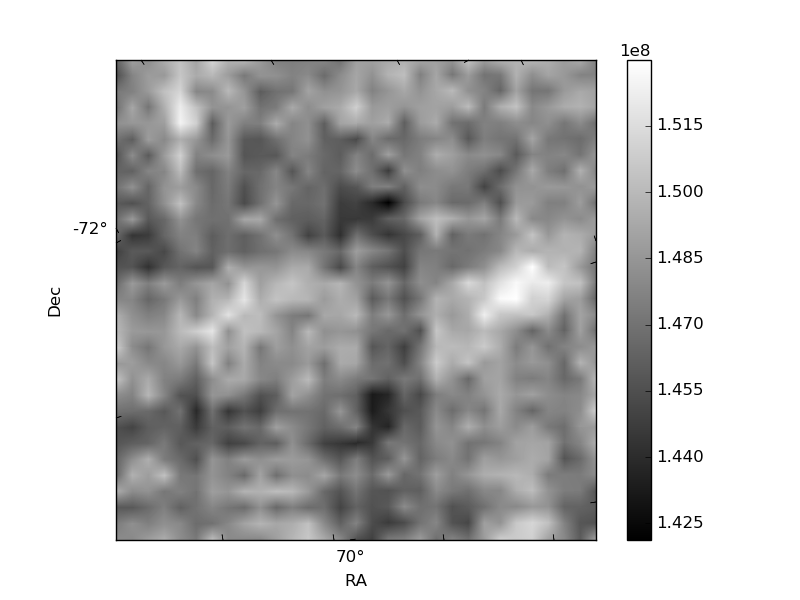
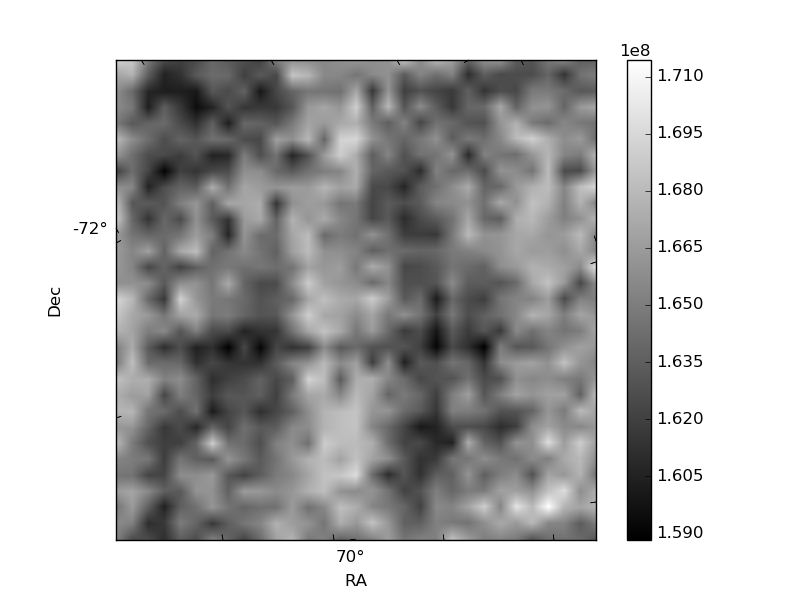
Histogram calculated using DETX and DETY for each event in the final _common_clean file
| Quadrant A | 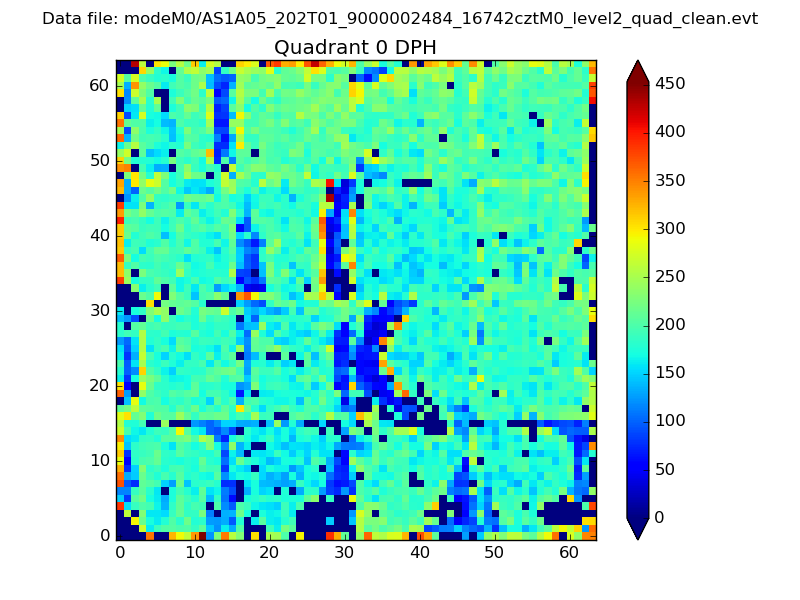 |
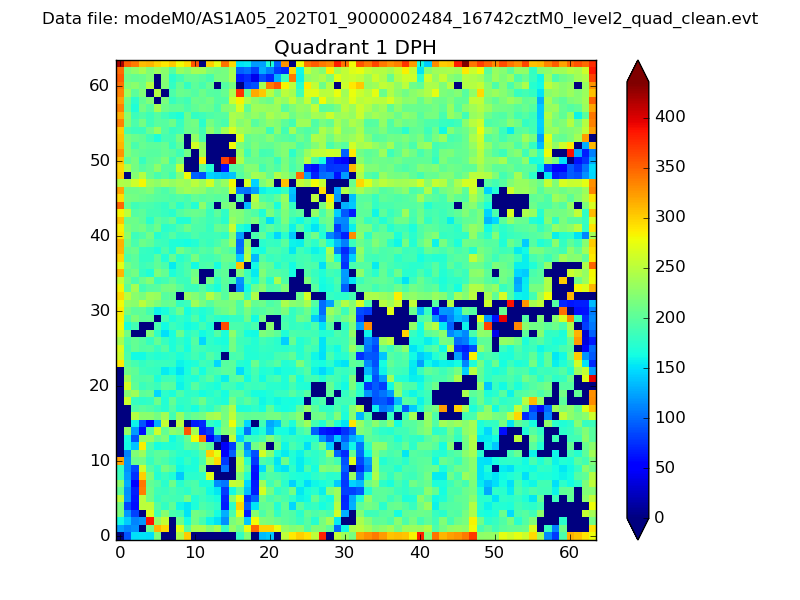 |
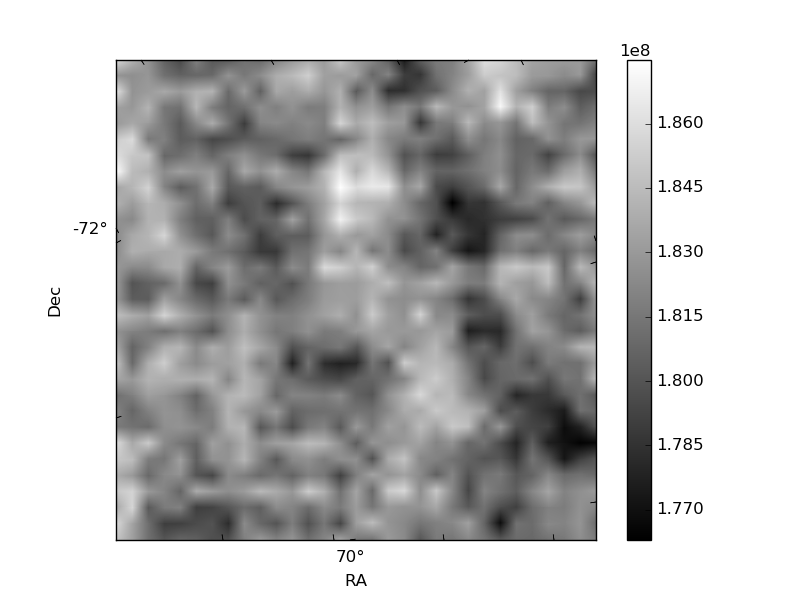
Quadrant B |
|---|---|---|---|
| Quadrant D | 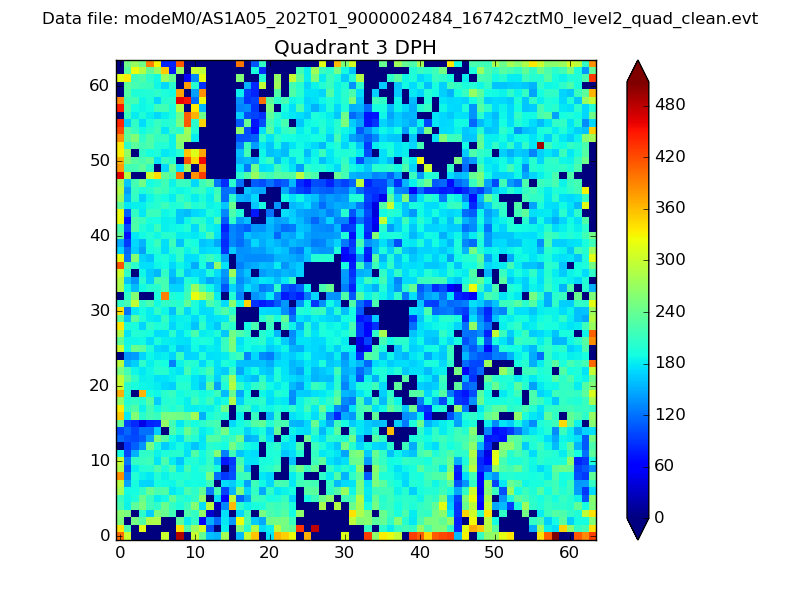 |
 |
Quadrant C |
| Plot type | Count rate plots | Images |
|---|---|---|
| Comparison with Poisson distribution Blue bars denote a histogram of data divided into 1 sec bins. Red curve is a Poisson curve with rate = median count rate of data. |
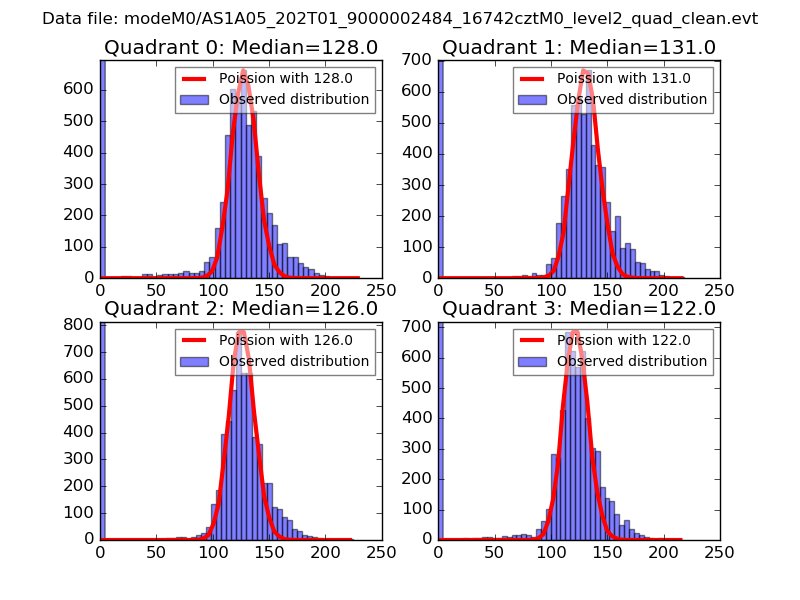 |
 |
| Quadrant-wise count rates Data is divided into 100 sec bins |
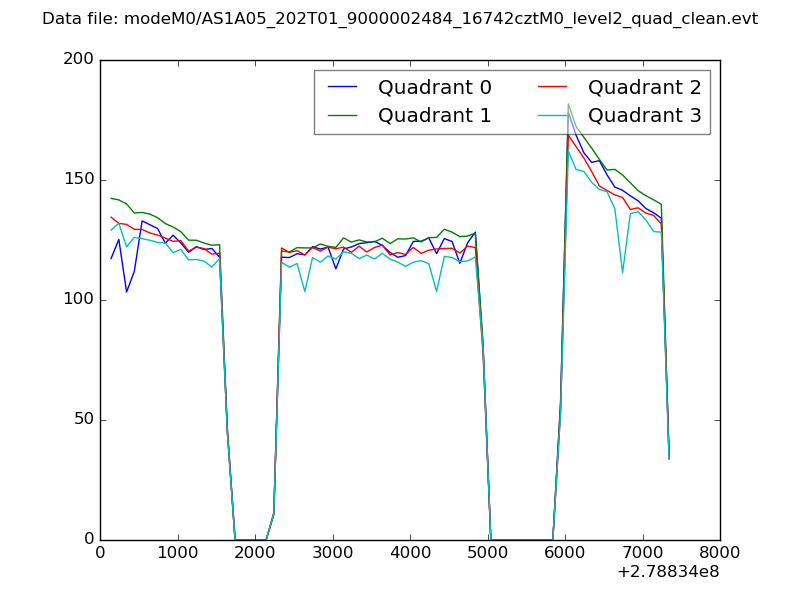 |
|
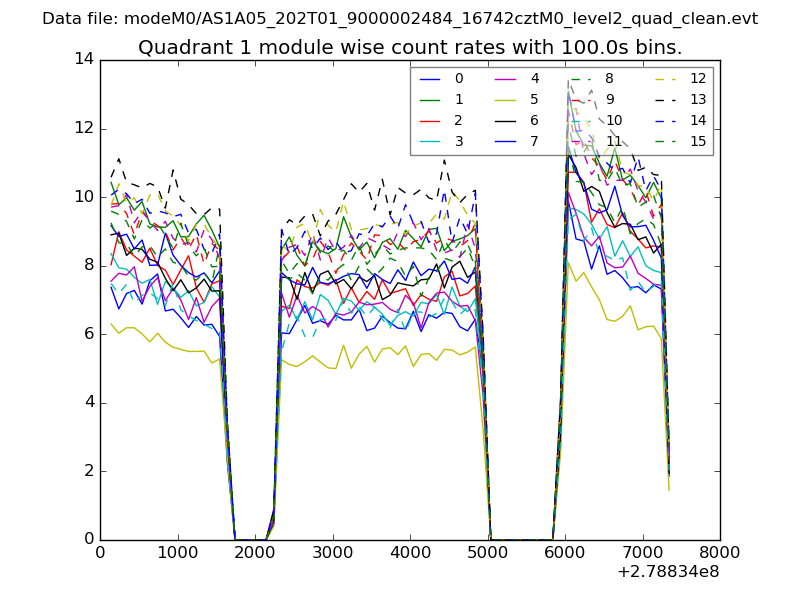
| Module-wise count rates for Quadrant A Data is divided into 100 sec bins |
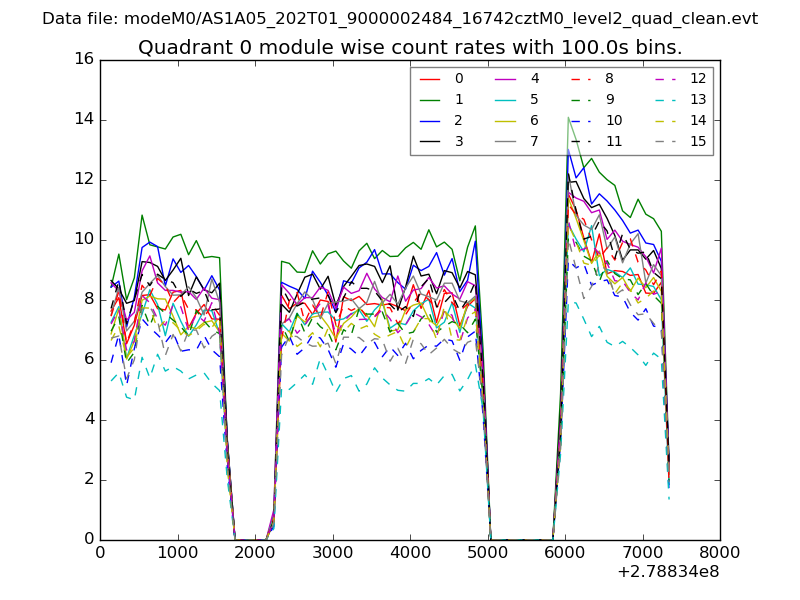 |
 |
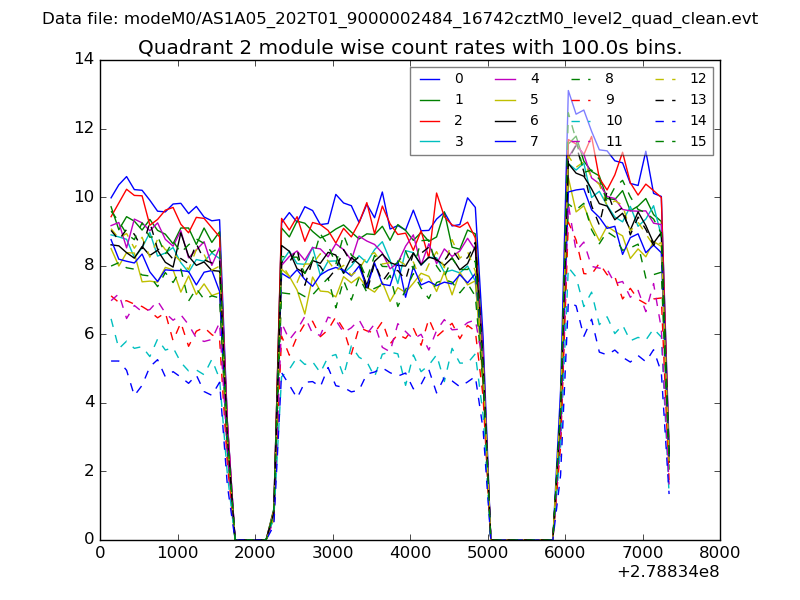
| Module-wise count rates for Quadrant B Data is divided into 100 sec bins |
 |
 |
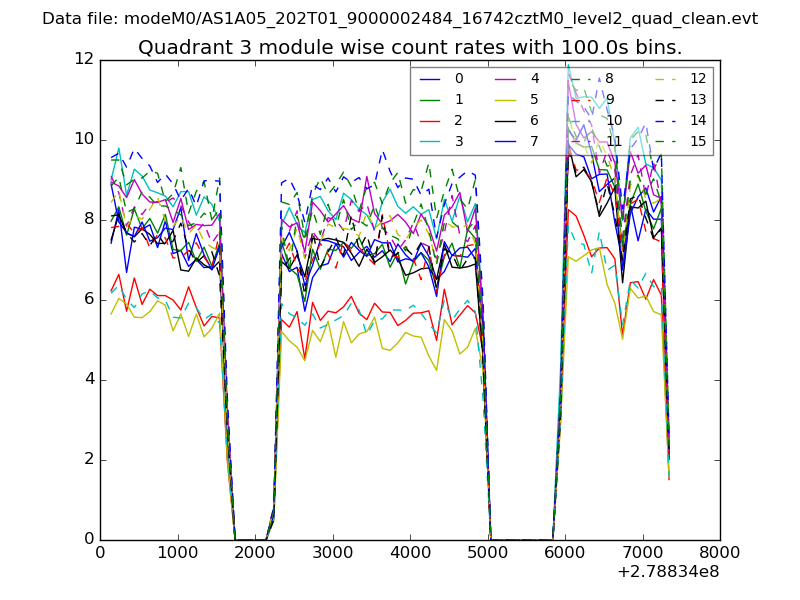
| Module-wise count rates for Quadrant C Data is divided into 100 sec bins |
 |
 |
| Module-wise count rates for Quadrant D Data is divided into 100 sec bins |
 |
 |
| Parameter | Plot |
|---|---|
| CZT HV Monitor | 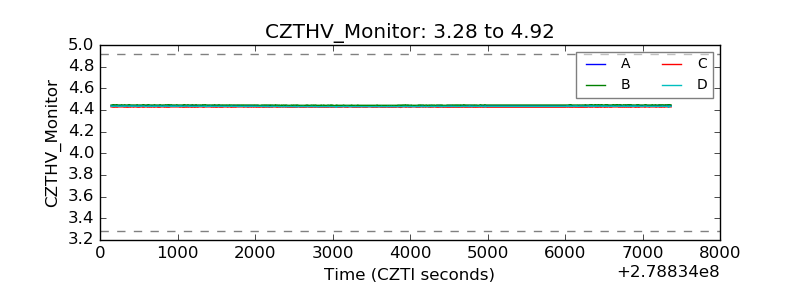 |
| D_VDD | 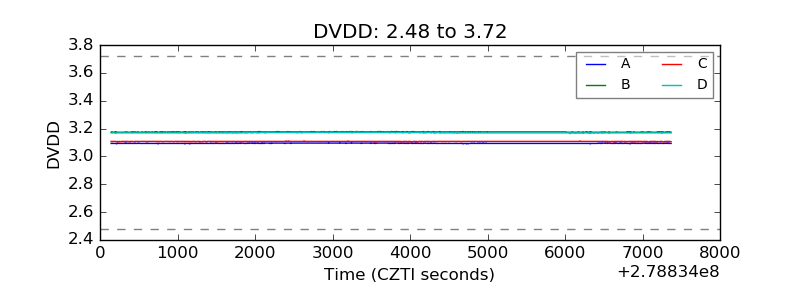 |
| Temperature 1 | 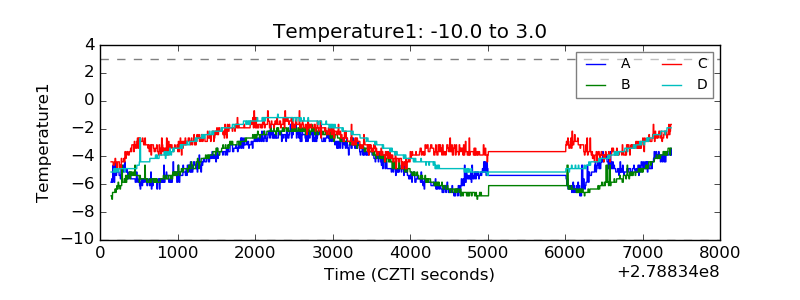 |
| Veto HV Monitor |  |
| Veto LLD |  |
| Alpha Counter | 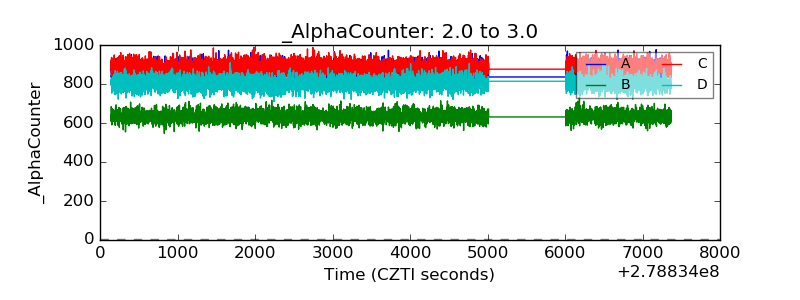 |
| _CPM_Rate | 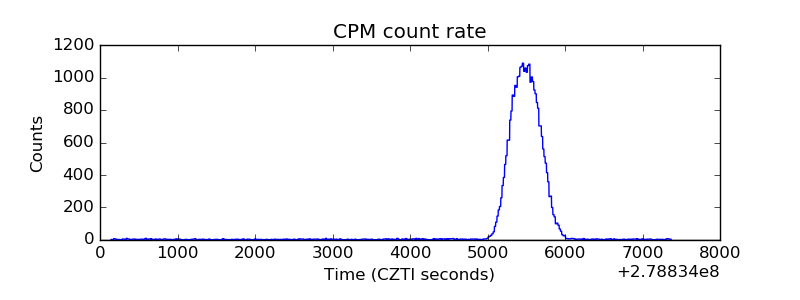 |
| CZT Counter | 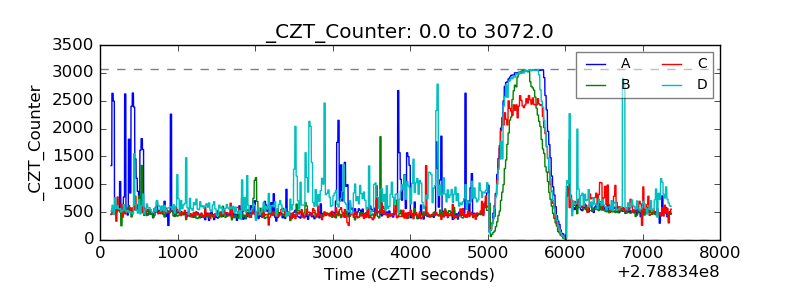 |
| +2.5 Volts monitor |  |
| +5 Volts monitor |  |
| _ROLL_ROT | 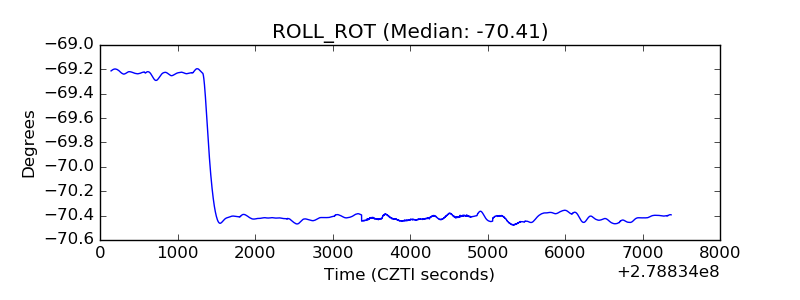 |
| _Roll_DEC | 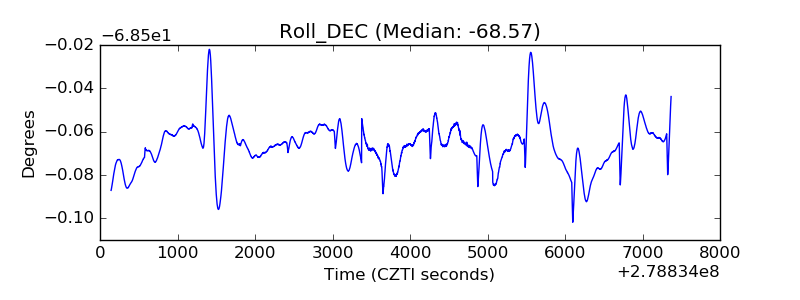 |
| _Roll_RA | 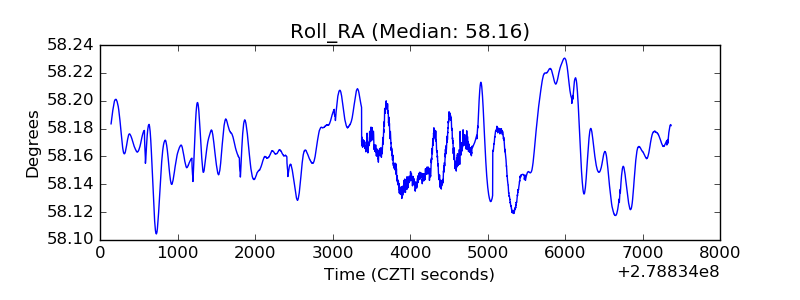 |
| Veto Counter | 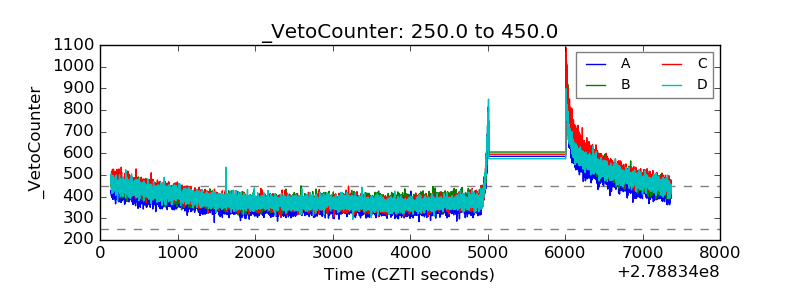 |