| Param | Original file | Final file |
|---|---|---|
| Filename | modeM0/AS1A05_202T01_9000002484_16745cztM0_level2.evt | modeM0/AS1A05_202T01_9000002484_16745cztM0_level2_quad_clean.evt |
| Size (bytes) | 616,343,040 | 101,891,520 |
| Size | 587.8 MB | 97.2 MB |
| Events in quadrant A | 3,411,367 | 696,199 |
| Events in quadrant B | 3,448,911 | 703,690 |
| Events in quadrant C | 3,217,811 | 673,669 |
| Events in quadrant D | 8,173,795 | 584,042 |
| Mode M0 | |||
|---|---|---|---|
| Quadrant | BADHDUFLAG | Total packets | Discarded packets |
| A | 0 | 14115 | 2 |
| B | 0 | 14174 | 1 |
| C | 0 | 13528 | 1 |
| D | 0 | 28678 | 1 |
| Mode M9 | |||
|---|---|---|---|
| Quadrant | BADHDUFLAG | Total packets | Discarded packets |
| A | 0 | 12 | 0 |
| B | 0 | 12 | 0 |
| C | 0 | 12 | 0 |
| D | 0 | 12 | 0 |
| Mode SS | |||
|---|---|---|---|
| Quadrant | BADHDUFLAG | Total packets | Discarded packets |
| A | 0 | 126 | 0 |
| B | 0 | 126 | 0 |
| C | 0 | 126 | 0 |
| D | 0 | 126 | 0 |
| Quadrant | Total seconds | Saturated seconds | Saturation percentage |
|---|---|---|---|
| A | 6120 | 95 | 1.552288% |
| B | 6120 | 99 | 1.617647% |
| C | 6120 | 92 | 1.503268% |
| D | 6120 | 1265 | 20.669935% |
Noise dominated data is calculated using 1-second bins in cleaned event files. If a bin has >2000 counts, and if more than 50% of those come from <1% of pixels, then it is considered to be noise-dominated and hence unusable.
| Quadrant | # 1 sec bins | Bins with >0 counts | Bins with >2000 counts | High rate bins dominated by noise | Noise dominated (total time) | Noise dominated (detector-on time) | Marked lightcurve |
|---|---|---|---|---|---|---|---|
| A | 7386 | 6122 | 30 | 30 | 0.41% | 0.49% | 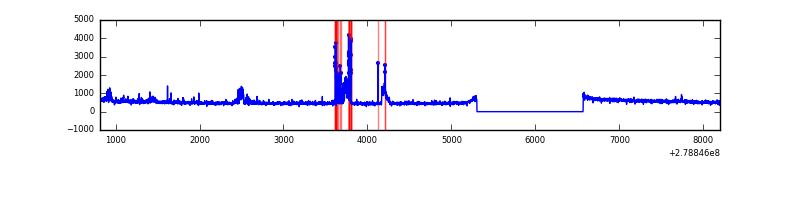 |
| B | 7386 | 6122 | 24 | 24 | 0.32% | 0.39% | 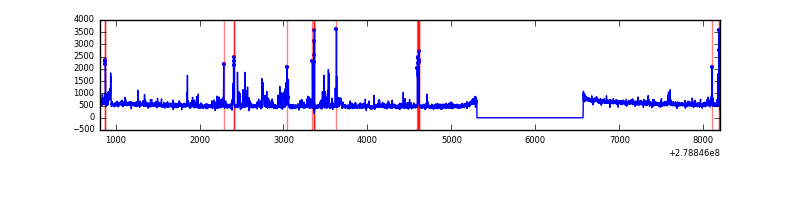 |
| C | 7386 | 6122 | 5 | 5 | 0.07% | 0.08% | 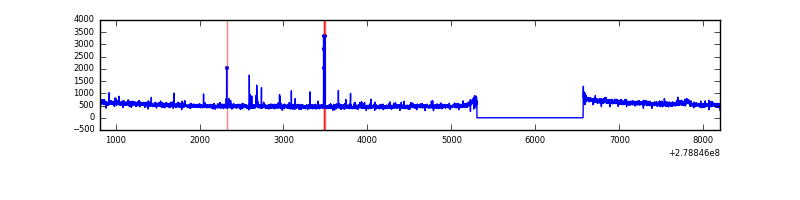 |
| D | 7386 | 6122 | 1076 | 1076 | 14.57% | 17.58% | 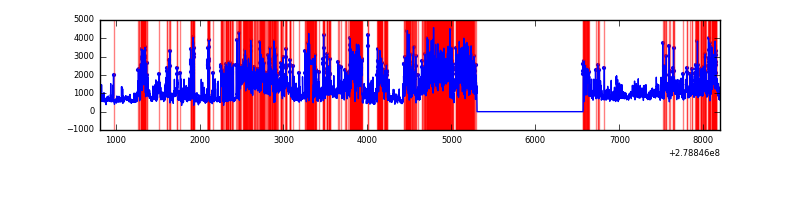 |
Top three noisy pixels from each quadrant. If the there are fewer than three noisy pixels in the level2.evt file, extra rows are filled as -1
| Pixel properties | Quadrant properties | ||||||
|---|---|---|---|---|---|---|---|
| Quadrant | DetID | PixID | Counts | Sigma | Mean | Median | Sigma |
| A | 15 | 174 | 326509 | 2055.77 | 799 | 786 | 158.4 |
| A | 9 | 143 | 7651 | 43.33 | 799 | 786 | 158.4 |
| A | 0 | 226 | 7178 | 40.34 | 799 | 786 | 158.4 |
| B | 15 | 35 | 137008 | 941.34 | 793 | 776 | 144.7 |
| B | 5 | 236 | 67334 | 459.9 | 793 | 776 | 144.7 |
| B | 7 | 220 | 42000 | 284.85 | 793 | 776 | 144.7 |
| C | 14 | 238 | 122846 | 704.54 | 760 | 763 | 173.3 |
| C | 0 | 207 | 58380 | 332.51 | 760 | 763 | 173.3 |
| C | 7 | 247 | 44716 | 253.65 | 760 | 763 | 173.3 |
| D | 1 | 52 | 4498070 | 25794.33 | 720 | 700 | 174.4 |
| D | 2 | 16 | 280081 | 1602.37 | 720 | 700 | 174.4 |
| D | 10 | 70 | 275734 | 1577.44 | 720 | 700 | 174.4 |
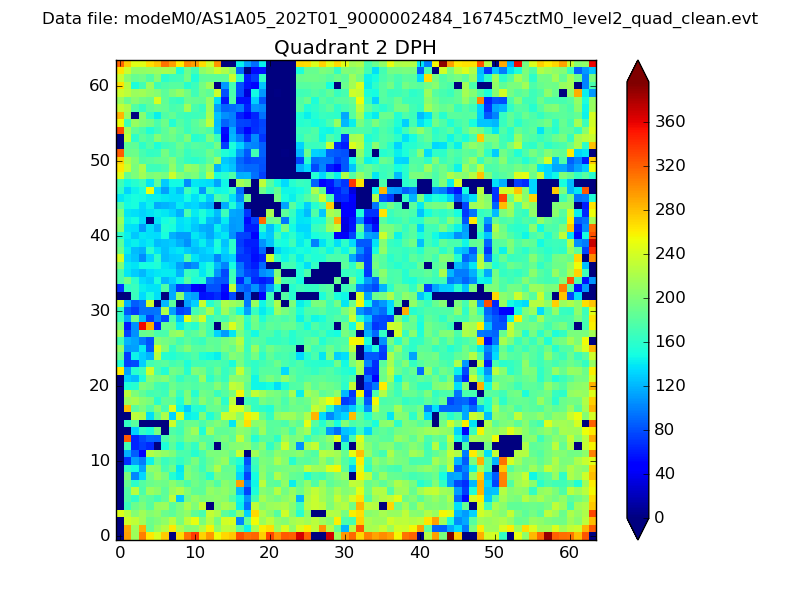
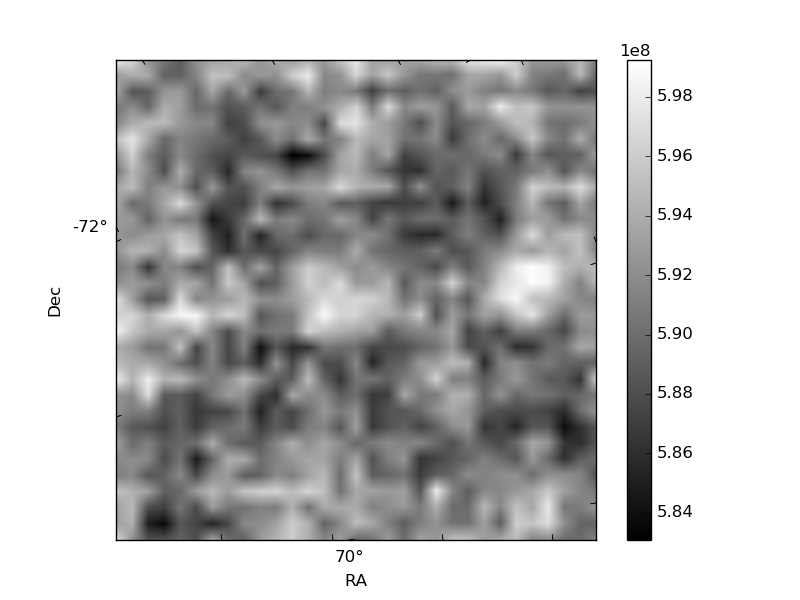
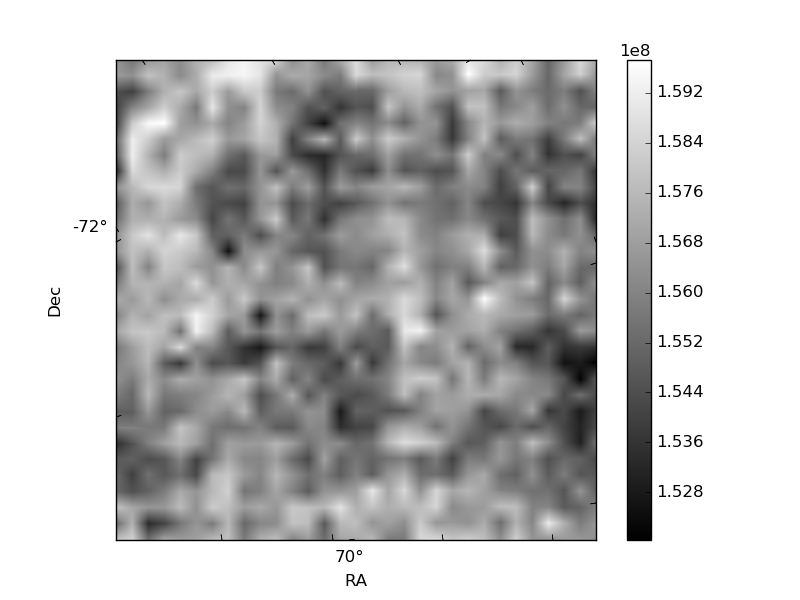
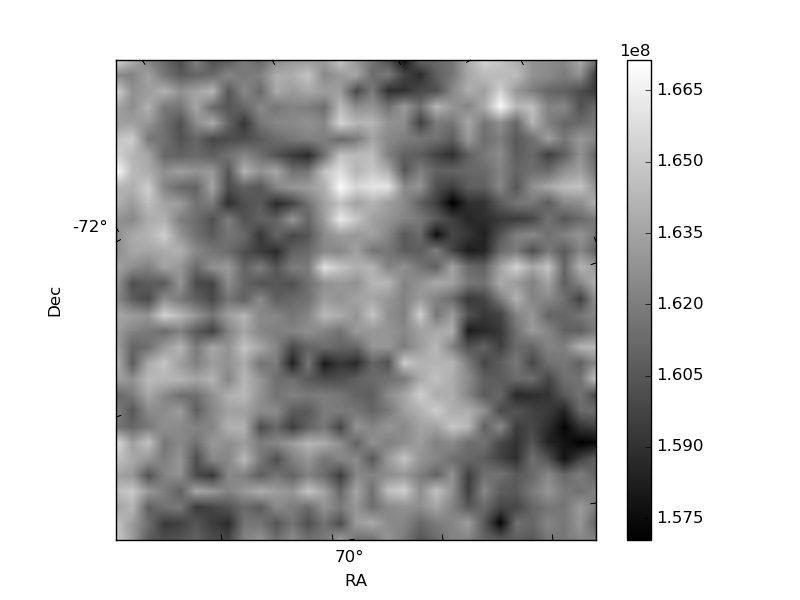
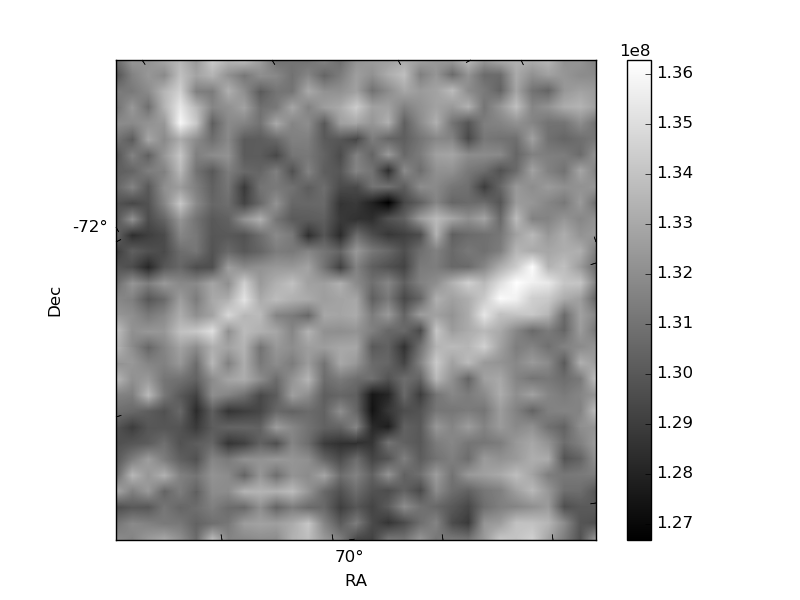
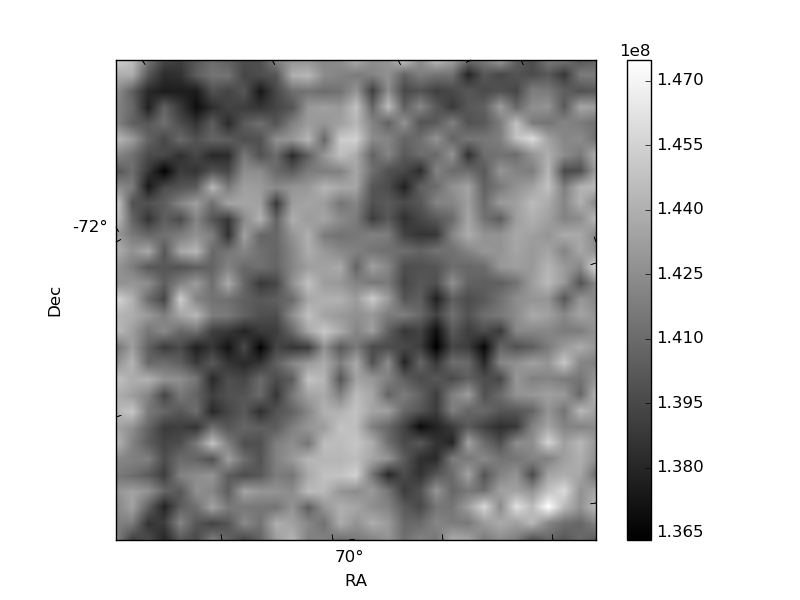
Histogram calculated using DETX and DETY for each event in the final _common_clean file
| Quadrant A | 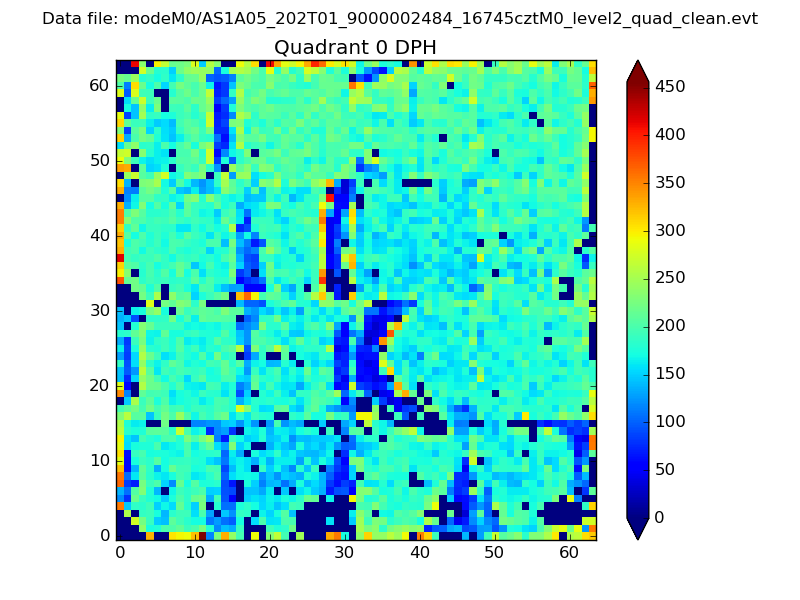 |
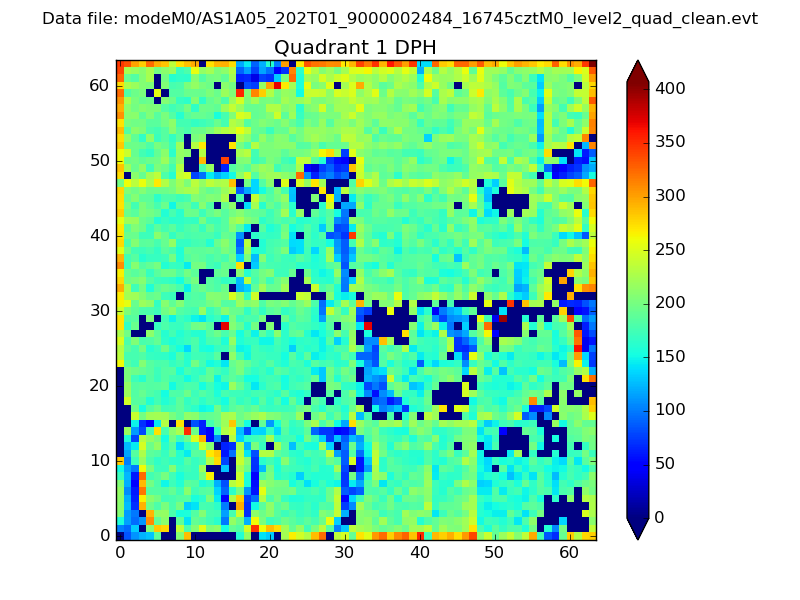 |
Quadrant B |
|---|---|---|---|
| Quadrant D | 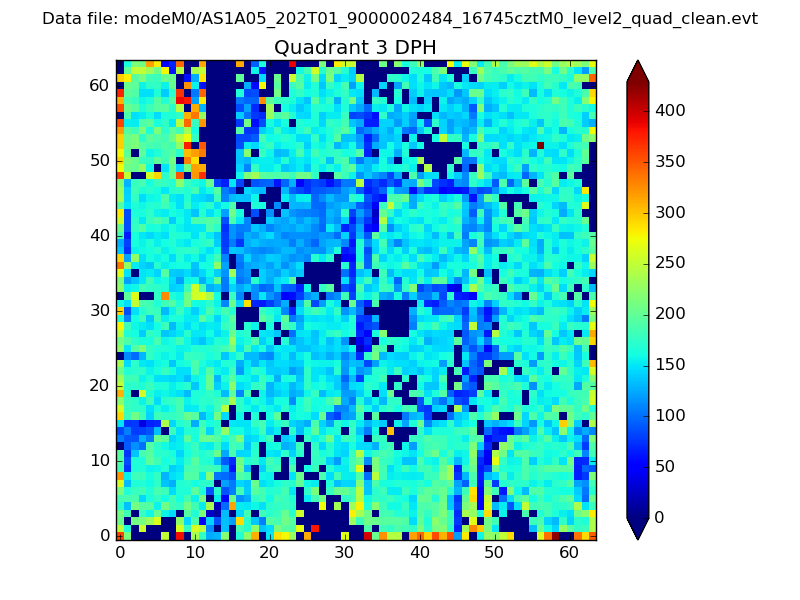 |
 |
Quadrant C |
| Plot type | Count rate plots | Images |
|---|---|---|
| Comparison with Poisson distribution Blue bars denote a histogram of data divided into 1 sec bins. Red curve is a Poisson curve with rate = median count rate of data. |
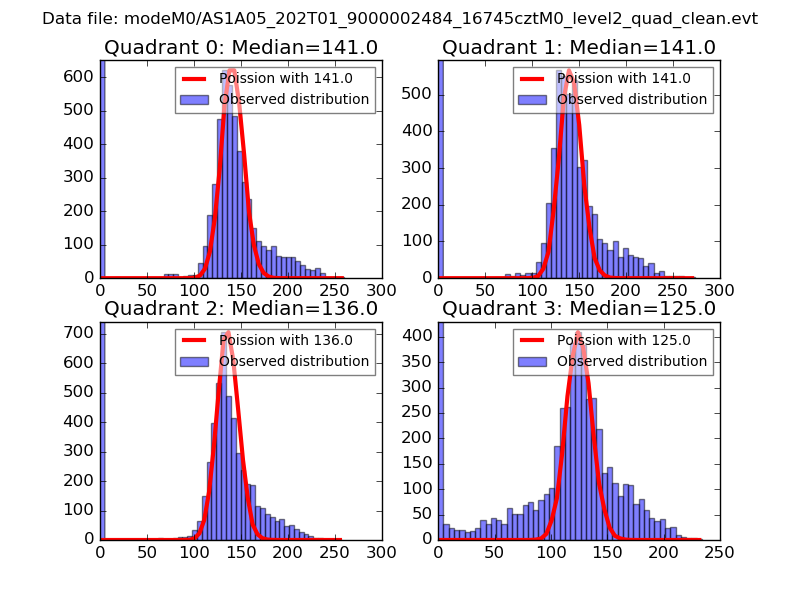 |
 |
| Quadrant-wise count rates Data is divided into 100 sec bins |
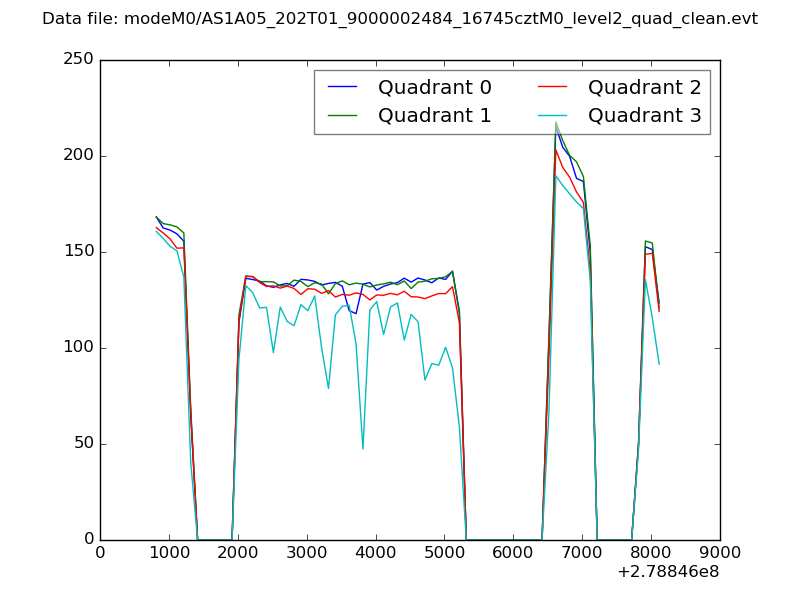 |
|
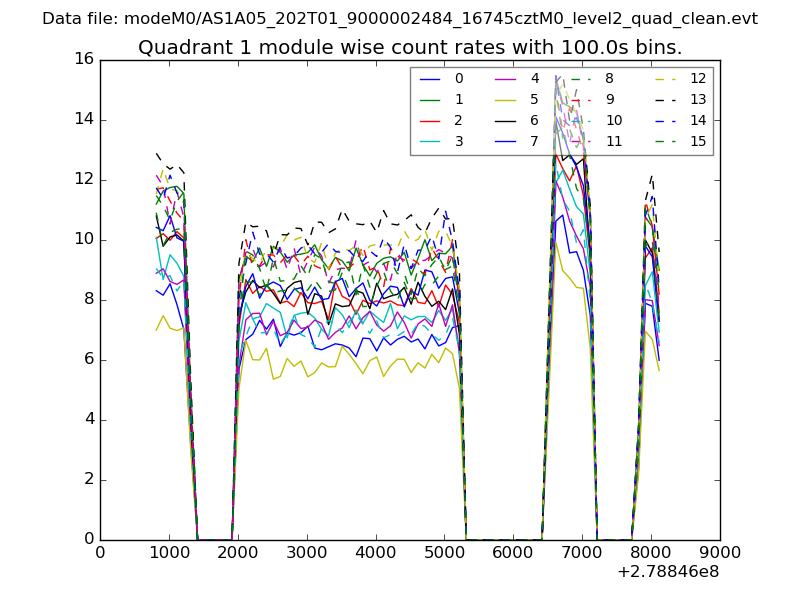
| Module-wise count rates for Quadrant A Data is divided into 100 sec bins |
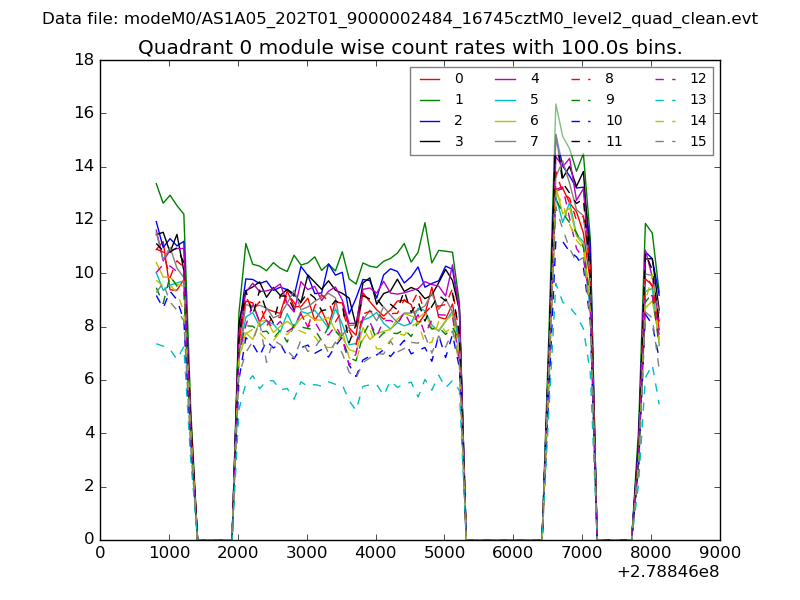 |
 |
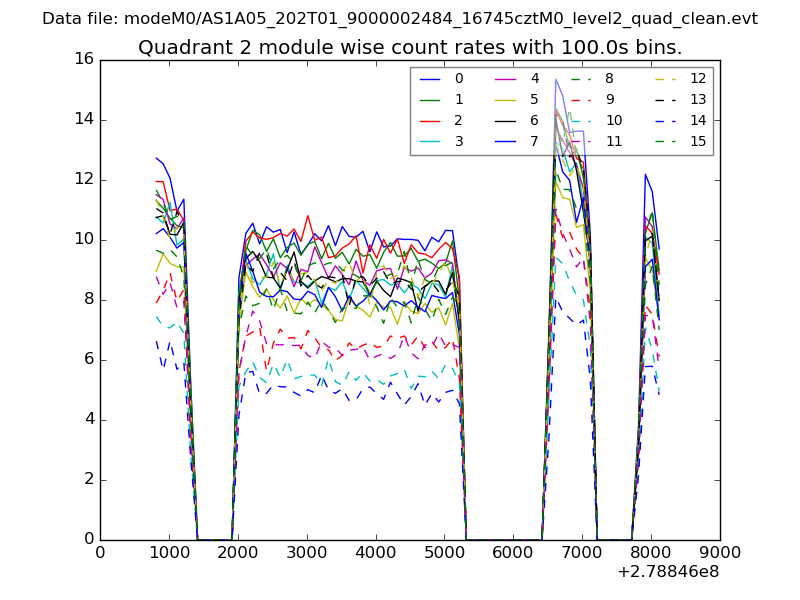
| Module-wise count rates for Quadrant B Data is divided into 100 sec bins |
 |
 |
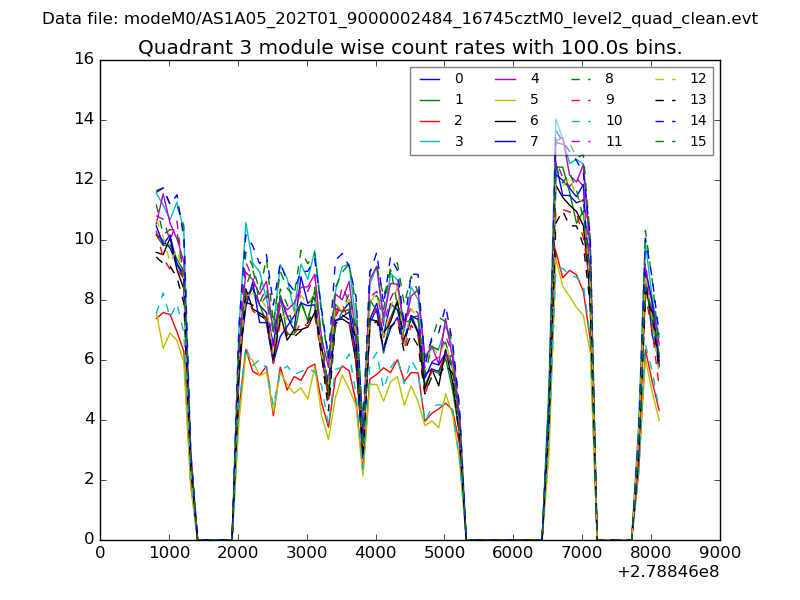
| Module-wise count rates for Quadrant C Data is divided into 100 sec bins |
 |
 |
| Module-wise count rates for Quadrant D Data is divided into 100 sec bins |
 |
 |
| Parameter | Plot |
|---|---|
| CZT HV Monitor | 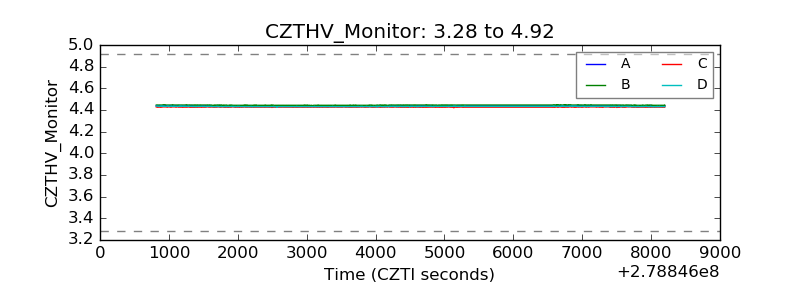 |
| D_VDD | 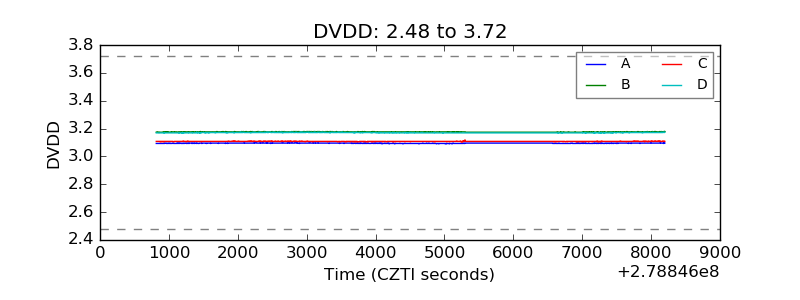 |
| Temperature 1 | 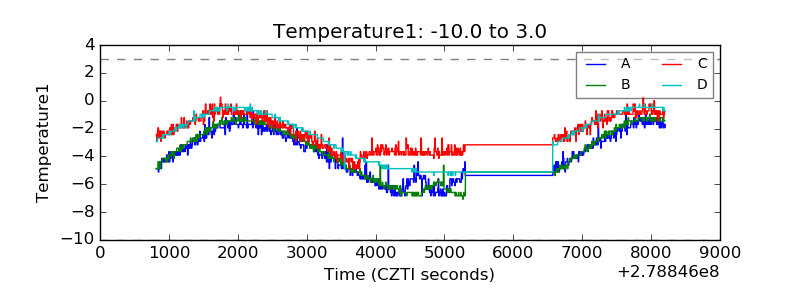 |
| Veto HV Monitor | 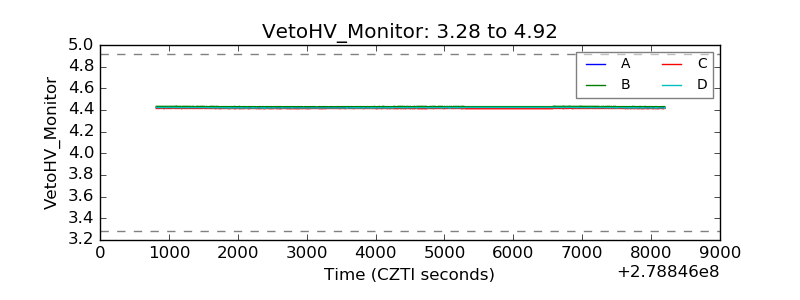 |
| Veto LLD | 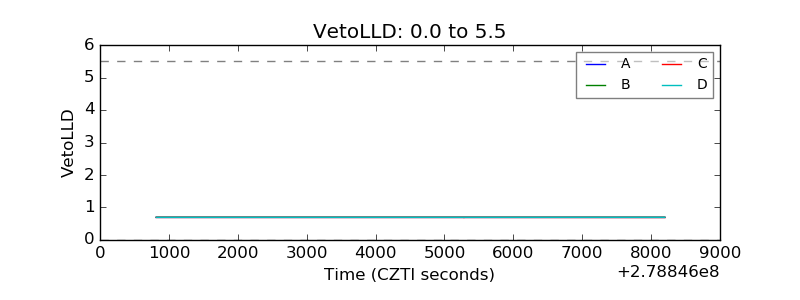 |
| Alpha Counter | 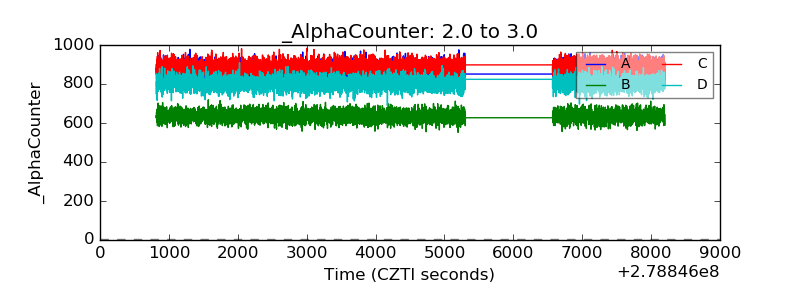 |
| _CPM_Rate | 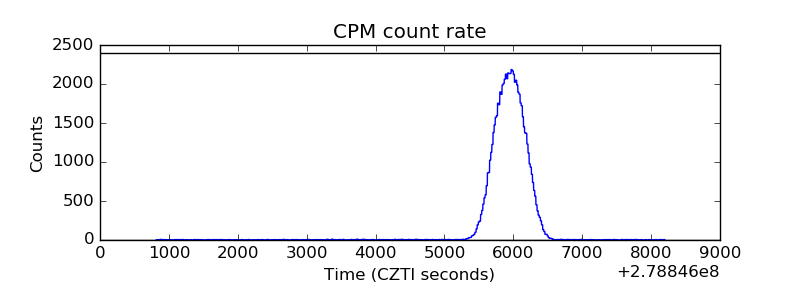 |
| CZT Counter | 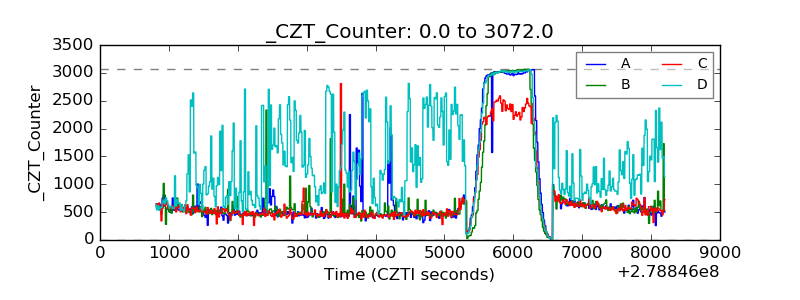 |
| +2.5 Volts monitor |  |
| +5 Volts monitor |  |
| _ROLL_ROT | 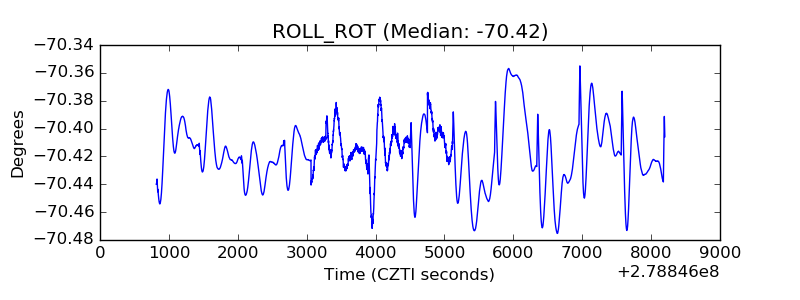 |
| _Roll_DEC | 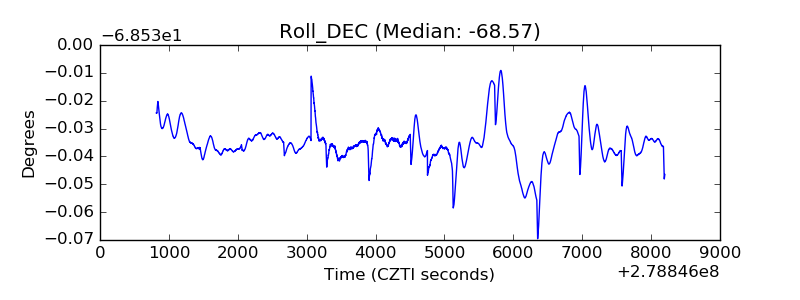 |
| _Roll_RA | 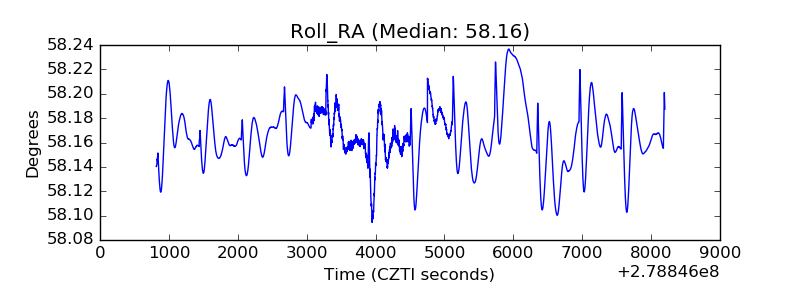 |
| Veto Counter | 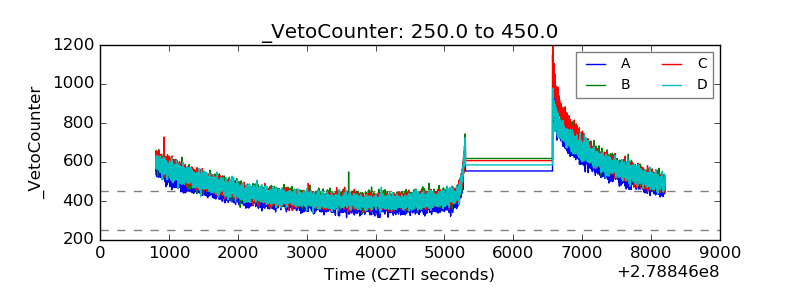 |