| Param | Original file | Final file |
|---|---|---|
| Filename | modeM0/AS1A05_202T01_9000002484_16746cztM0_level2.evt | modeM0/AS1A05_202T01_9000002484_16746cztM0_level2_quad_clean.evt |
| Size (bytes) | 542,246,400 | 97,738,560 |
| Size | 517.1 MB | 93.2 MB |
| Events in quadrant A | 2,919,991 | 665,963 |
| Events in quadrant B | 3,132,432 | 672,654 |
| Events in quadrant C | 2,919,348 | 637,544 |
| Events in quadrant D | 7,069,618 | 590,587 |
| Mode M0 | |||
|---|---|---|---|
| Quadrant | BADHDUFLAG | Total packets | Discarded packets |
| A | 0 | 12204 | 2 |
| B | 0 | 12842 | 1 |
| C | 0 | 12206 | 1 |
| D | 0 | 24958 | 1 |
| Mode M9 | |||
|---|---|---|---|
| Quadrant | BADHDUFLAG | Total packets | Discarded packets |
| A | 0 | 13 | 0 |
| B | 0 | 13 | 0 |
| C | 0 | 13 | 0 |
| D | 0 | 13 | 0 |
| Mode SS | |||
|---|---|---|---|
| Quadrant | BADHDUFLAG | Total packets | Discarded packets |
| A | 0 | 116 | 0 |
| B | 0 | 116 | 0 |
| C | 0 | 116 | 0 |
| D | 0 | 116 | 0 |
| Quadrant | Total seconds | Saturated seconds | Saturation percentage |
|---|---|---|---|
| A | 5612 | 103 | 1.835353% |
| B | 5612 | 137 | 2.441197% |
| C | 5612 | 143 | 2.548111% |
| D | 5612 | 862 | 15.359943% |
Noise dominated data is calculated using 1-second bins in cleaned event files. If a bin has >2000 counts, and if more than 50% of those come from <1% of pixels, then it is considered to be noise-dominated and hence unusable.
| Quadrant | # 1 sec bins | Bins with >0 counts | Bins with >2000 counts | High rate bins dominated by noise | Noise dominated (total time) | Noise dominated (detector-on time) | Marked lightcurve |
|---|---|---|---|---|---|---|---|
| A | 6908 | 5613 | 0 | 0 | 0.00% | 0.00% | 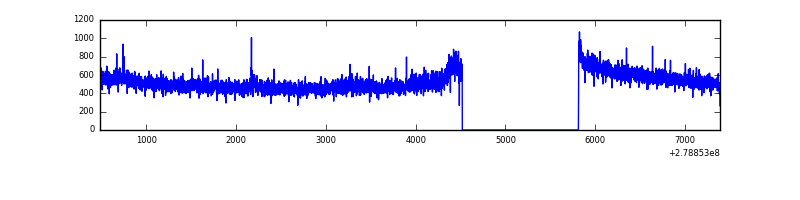 |
| B | 6908 | 5613 | 19 | 19 | 0.28% | 0.34% | 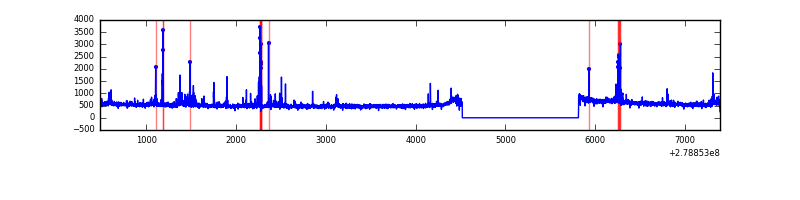 |
| C | 6908 | 5613 | 0 | 0 | 0.00% | 0.00% | 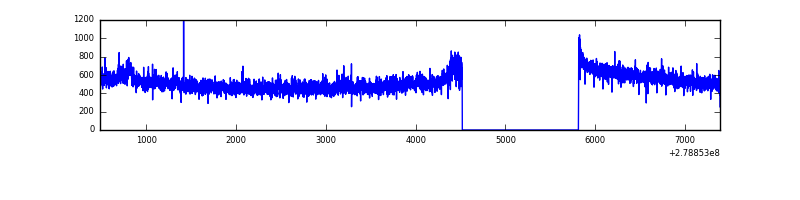 |
| D | 6908 | 5613 | 721 | 721 | 10.44% | 12.85% | 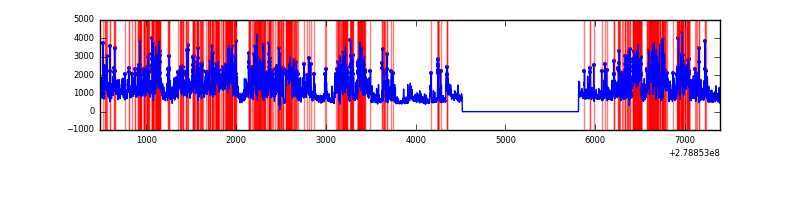 |
Top three noisy pixels from each quadrant. If the there are fewer than three noisy pixels in the level2.evt file, extra rows are filled as -1
| Pixel properties | Quadrant properties | ||||||
|---|---|---|---|---|---|---|---|
| Quadrant | DetID | PixID | Counts | Sigma | Mean | Median | Sigma |
| A | 14 | 14 | 23584 | 154.01 | 745 | 732 | 148.4 |
| A | 14 | 31 | 18998 | 123.1 | 745 | 732 | 148.4 |
| A | 15 | 174 | 14336 | 91.68 | 745 | 732 | 148.4 |
| B | 15 | 35 | 78342 | 574.88 | 739 | 724 | 135.0 |
| B | 0 | 189 | 60552 | 443.11 | 739 | 724 | 135.0 |
| B | 7 | 220 | 49280 | 359.63 | 739 | 724 | 135.0 |
| C | 14 | 238 | 112894 | 704.2 | 701 | 707 | 159.3 |
| C | 3 | 233 | 51737 | 320.32 | 701 | 707 | 159.3 |
| C | 7 | 247 | 21697 | 131.75 | 701 | 707 | 159.3 |
| D | 1 | 52 | 3446123 | 20986.09 | 687 | 669 | 164.2 |
| D | 2 | 16 | 511737 | 3112.89 | 687 | 669 | 164.2 |
| D | 10 | 70 | 283699 | 1723.92 | 687 | 669 | 164.2 |
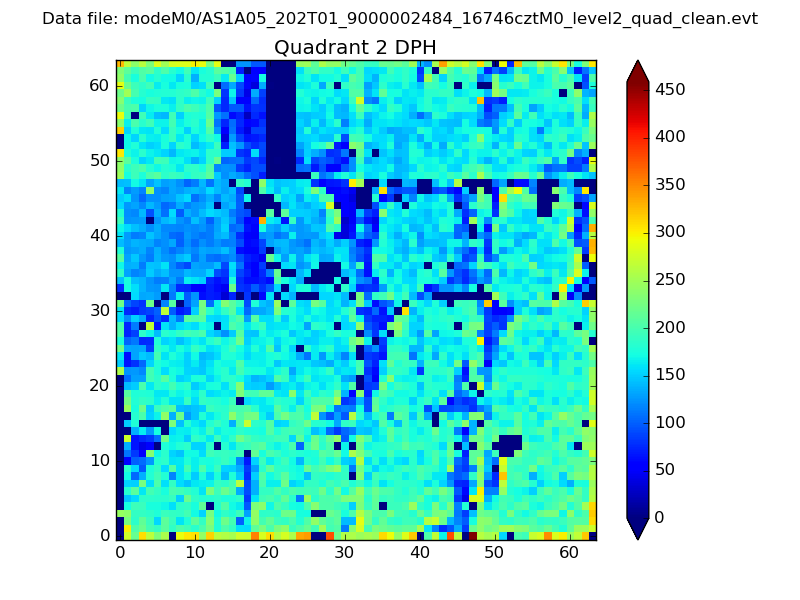
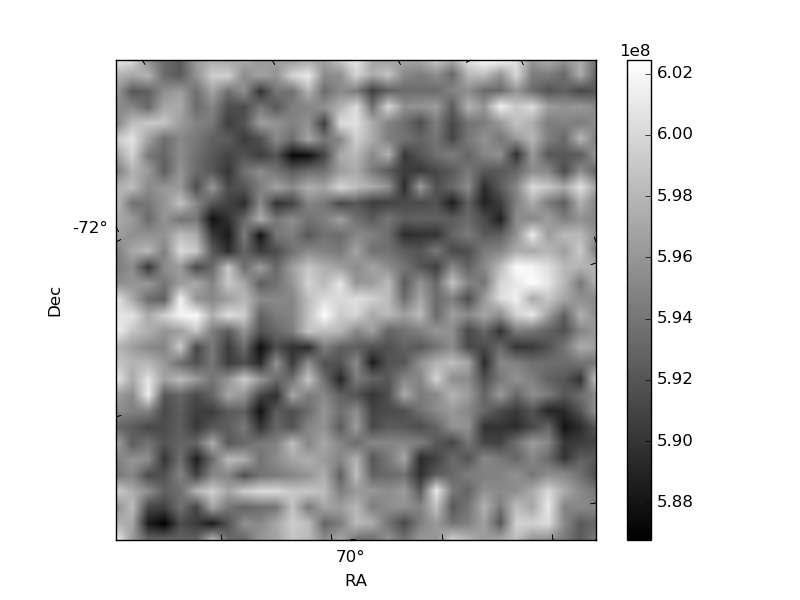
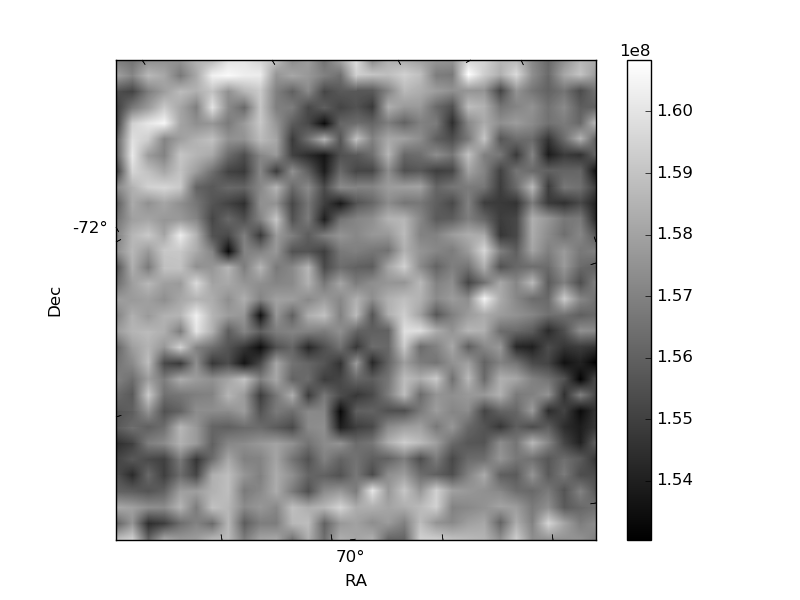
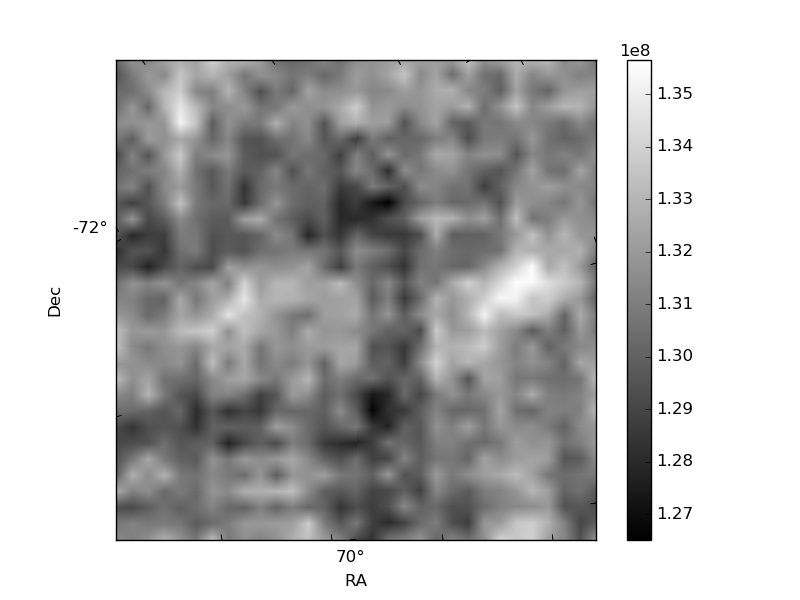
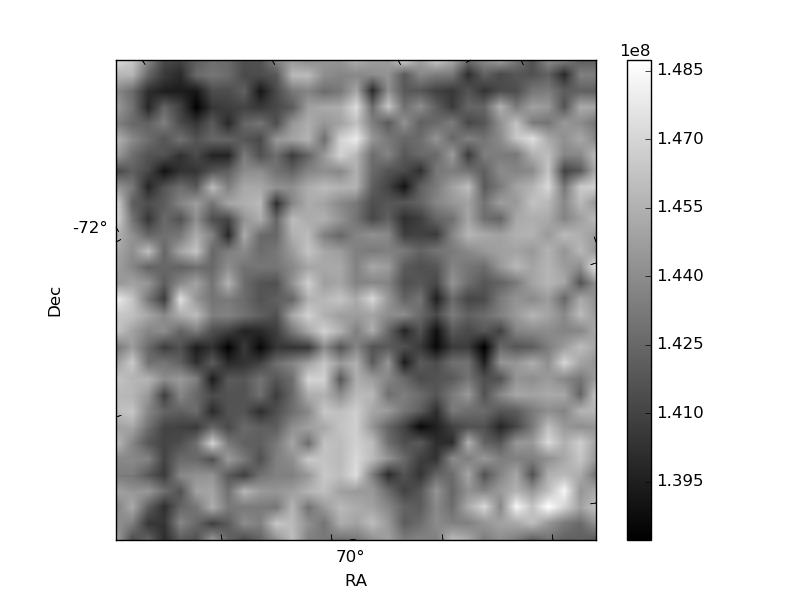
Histogram calculated using DETX and DETY for each event in the final _common_clean file
| Quadrant A | 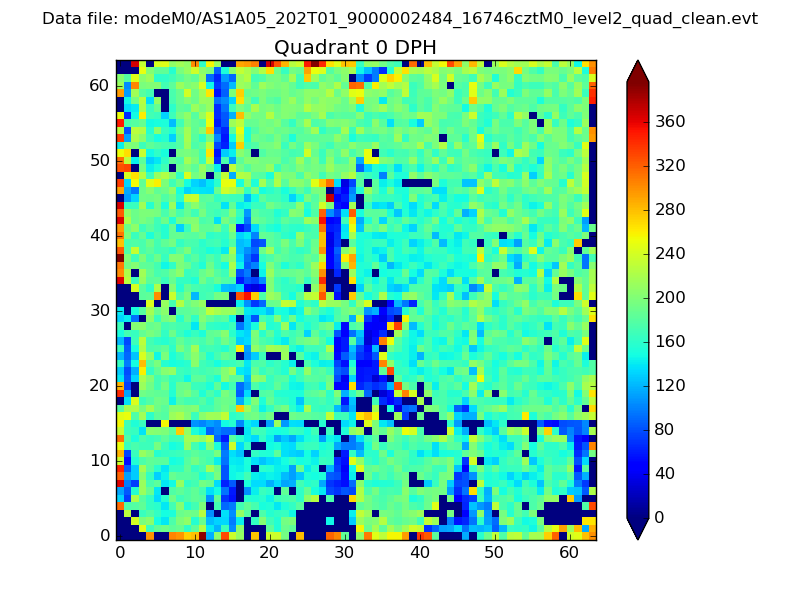 |
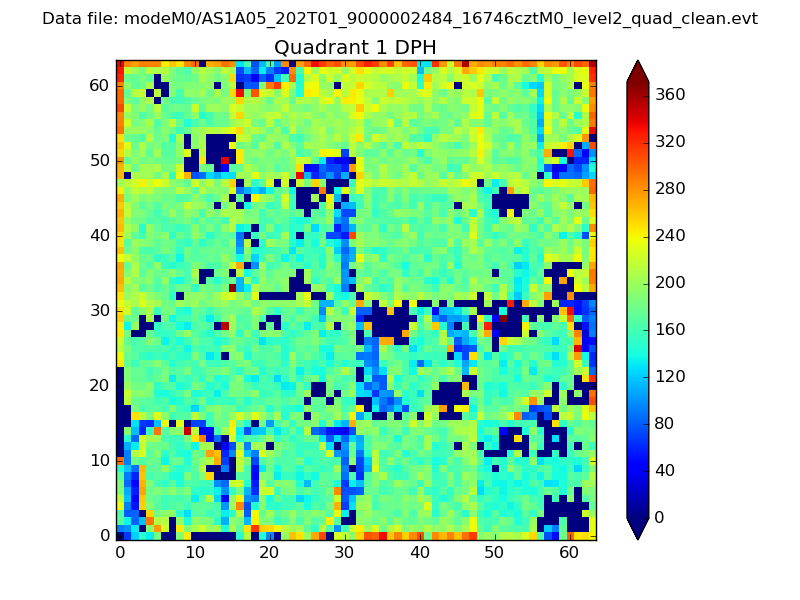 |
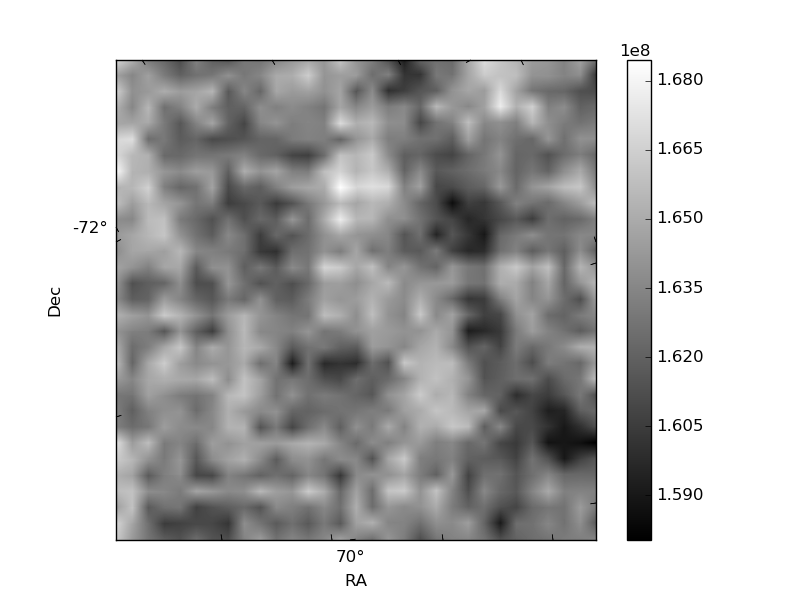
Quadrant B |
|---|---|---|---|
| Quadrant D | 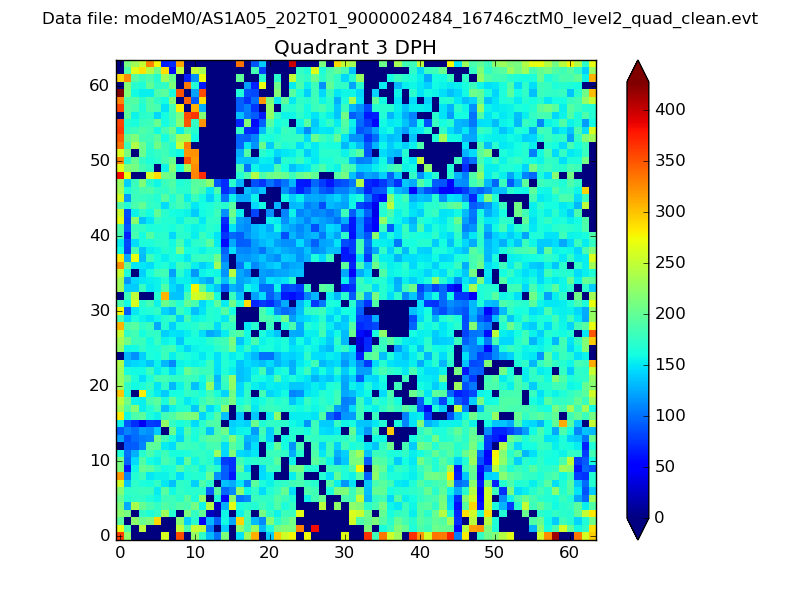 |
 |
Quadrant C |
| Plot type | Count rate plots | Images |
|---|---|---|
| Comparison with Poisson distribution Blue bars denote a histogram of data divided into 1 sec bins. Red curve is a Poisson curve with rate = median count rate of data. |
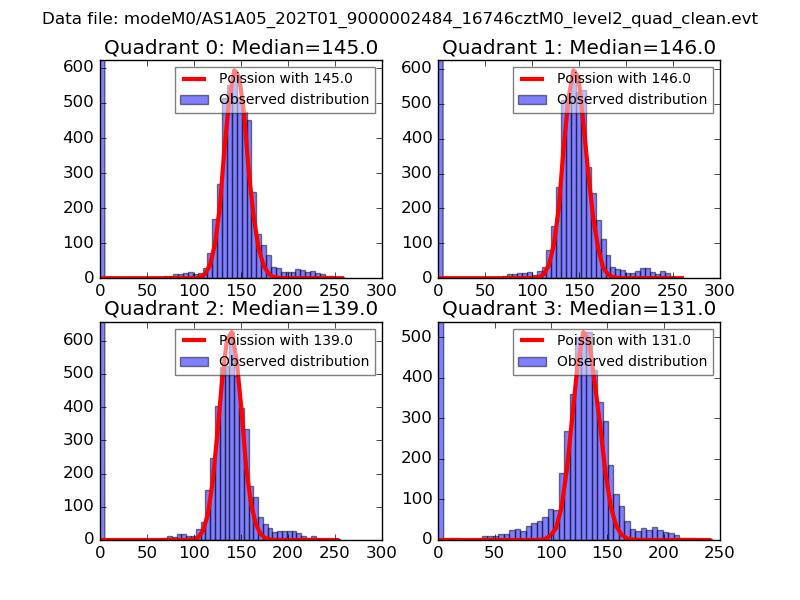 |
 |
| Quadrant-wise count rates Data is divided into 100 sec bins |
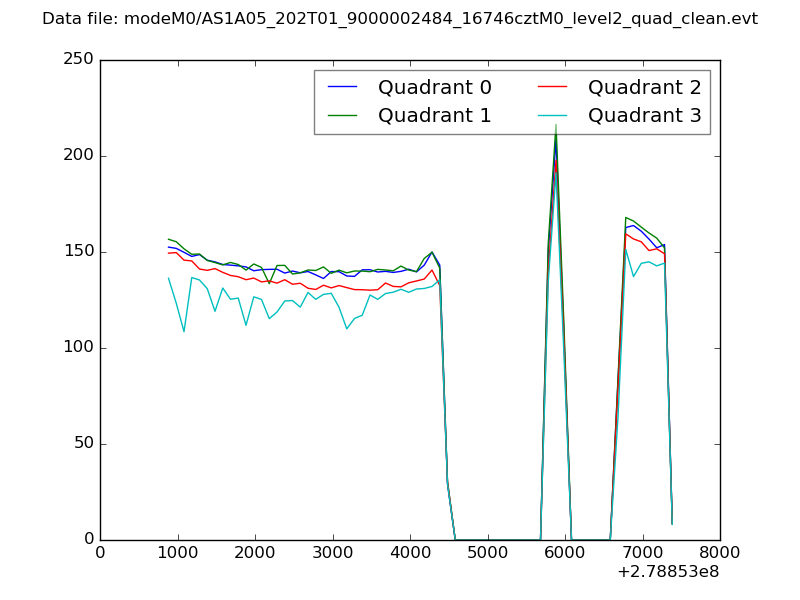 |
|
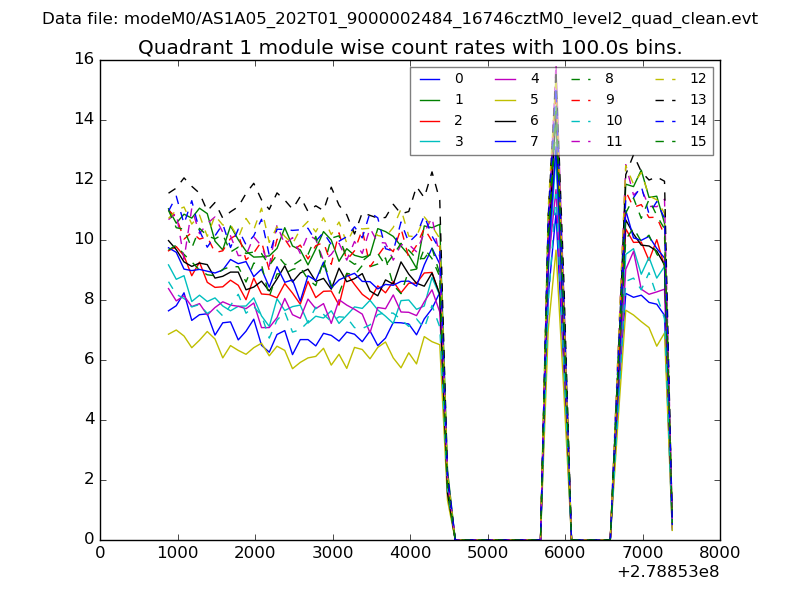
| Module-wise count rates for Quadrant A Data is divided into 100 sec bins |
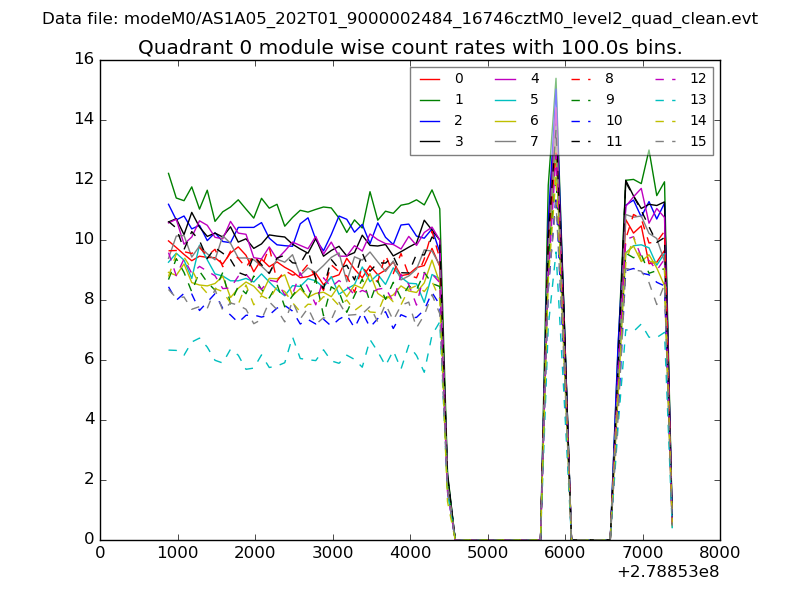 |
 |
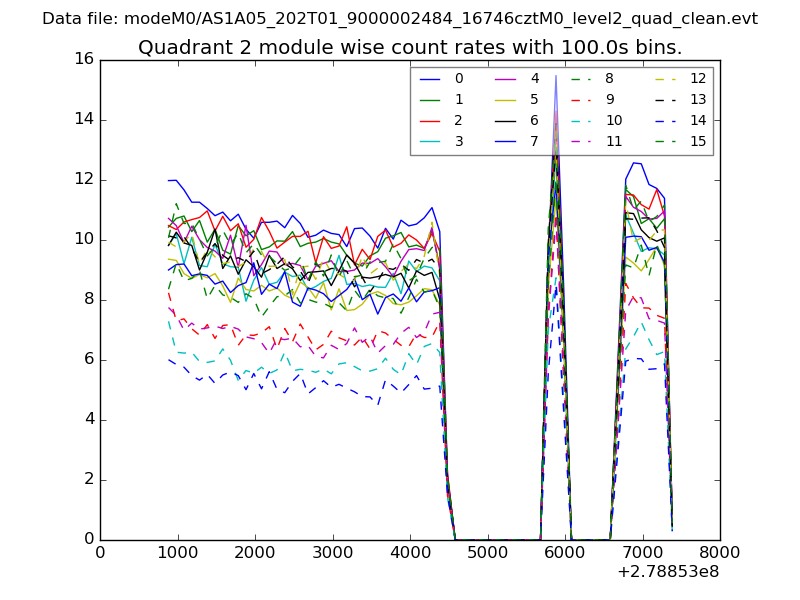
| Module-wise count rates for Quadrant B Data is divided into 100 sec bins |
 |
 |
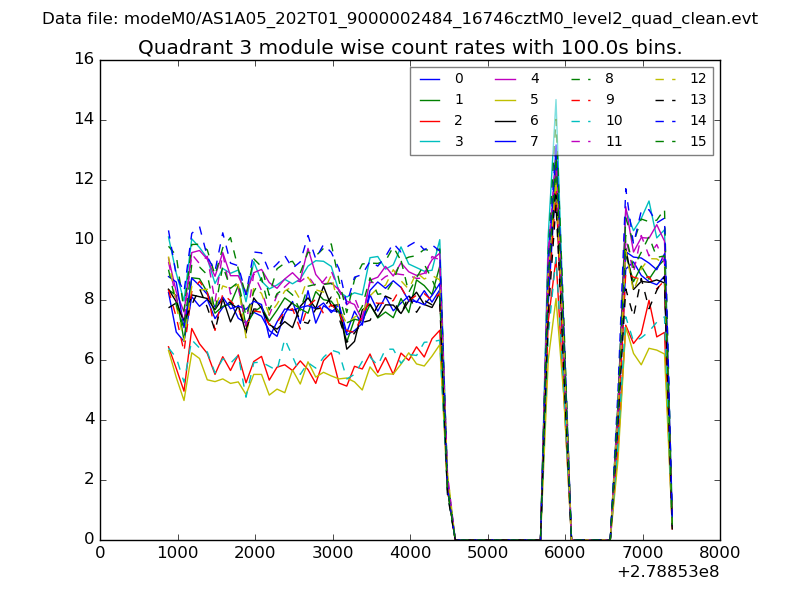
| Module-wise count rates for Quadrant C Data is divided into 100 sec bins |
 |
 |
| Module-wise count rates for Quadrant D Data is divided into 100 sec bins |
 |
 |
| Parameter | Plot |
|---|---|
| CZT HV Monitor | 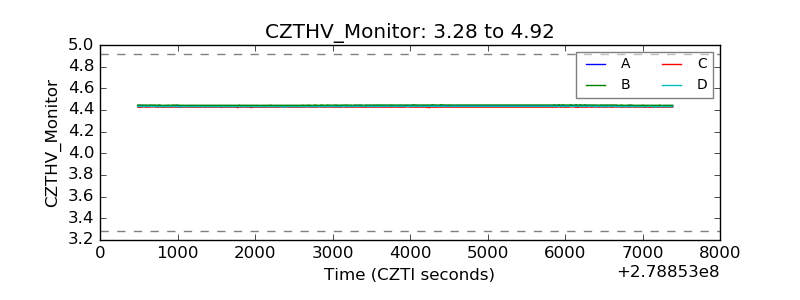 |
| D_VDD | 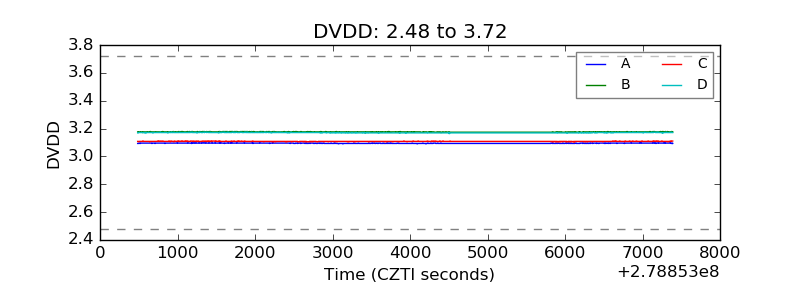 |
| Temperature 1 |  |
| Veto HV Monitor | 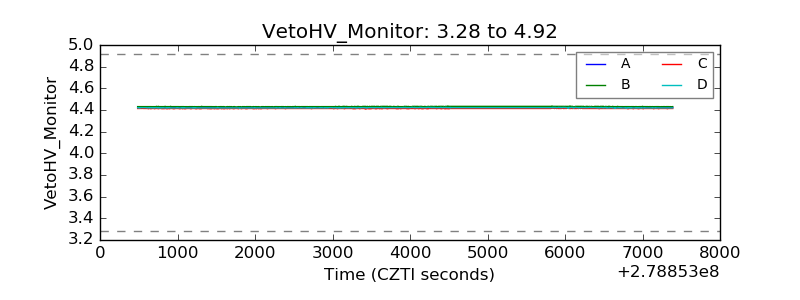 |
| Veto LLD | 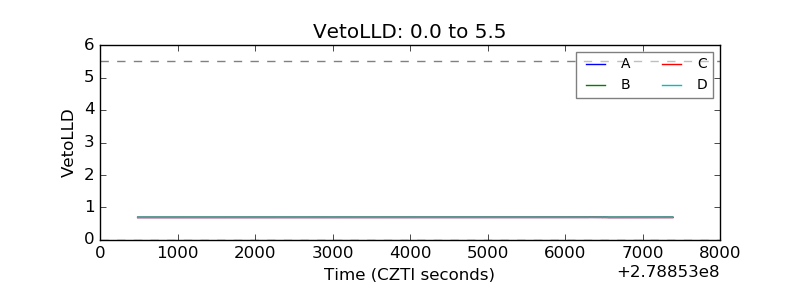 |
| Alpha Counter | 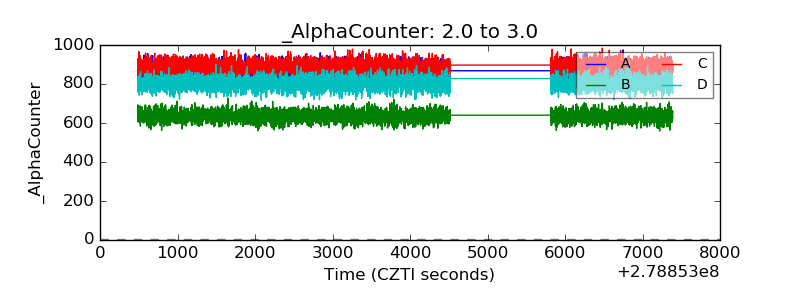 |
| _CPM_Rate | 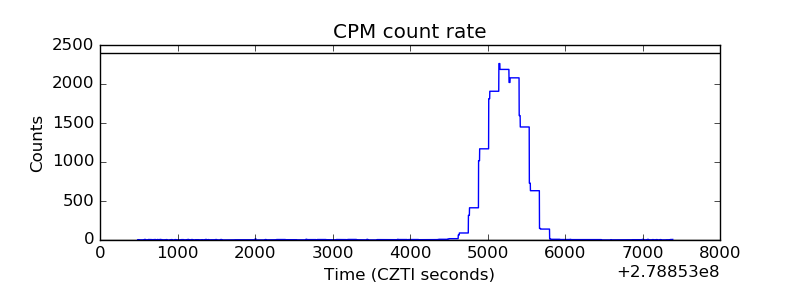 |
| CZT Counter | 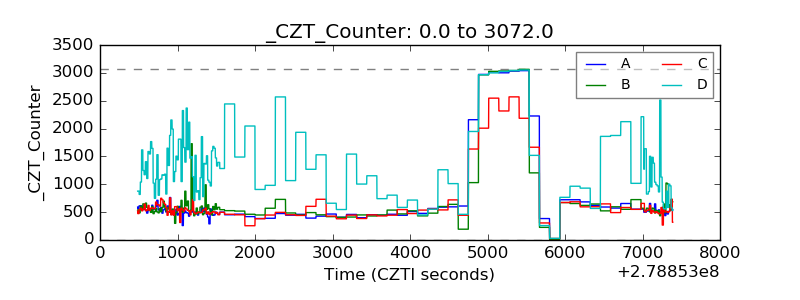 |
| +2.5 Volts monitor | 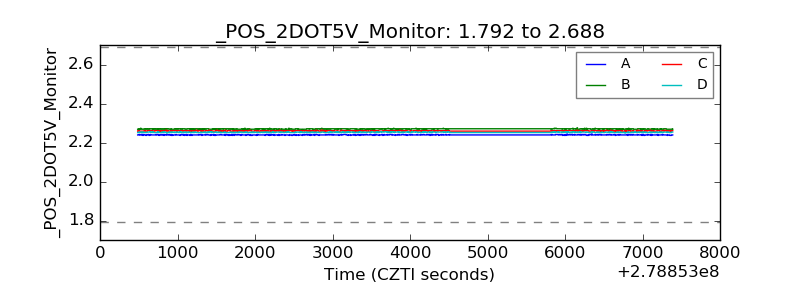 |
| +5 Volts monitor |  |
| _ROLL_ROT | 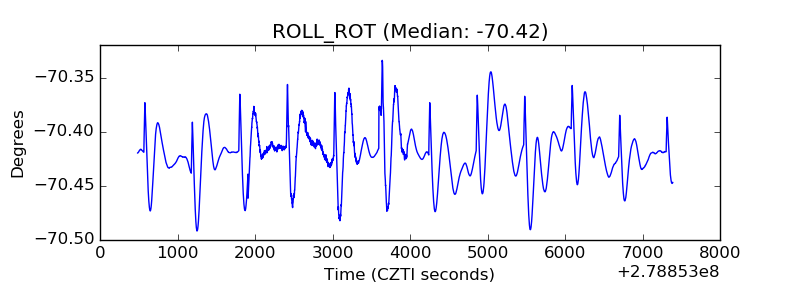 |
| _Roll_DEC | 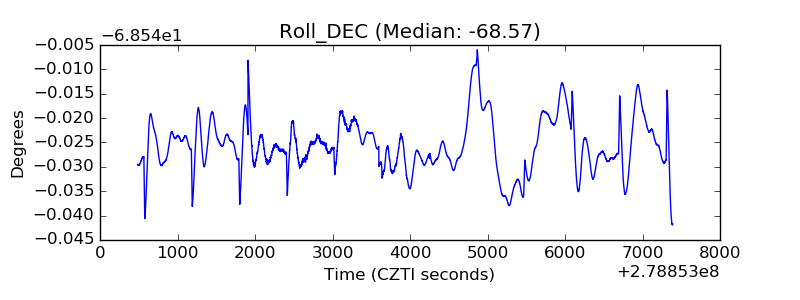 |
| _Roll_RA | 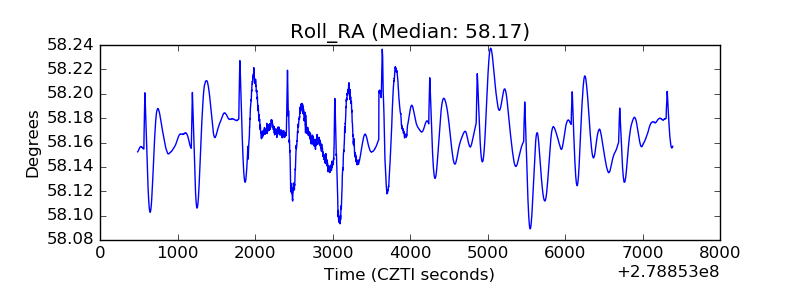 |
| Veto Counter | 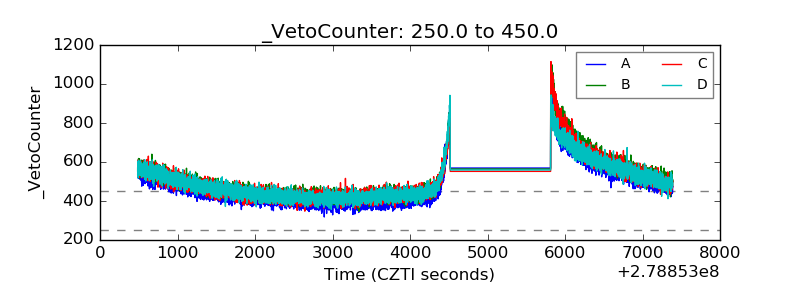 |