| Param | Original file | Final file |
|---|---|---|
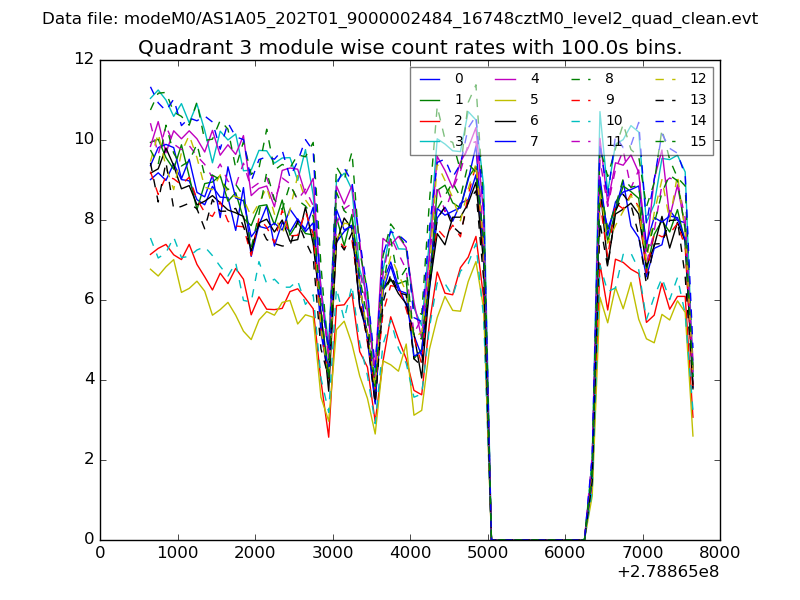
| Filename | modeM0/AS1A05_202T01_9000002484_16748cztM0_level2.evt | modeM0/AS1A05_202T01_9000002484_16748cztM0_level2_quad_clean.evt |
| Size (bytes) | 481,821,120 | 115,568,640 |
| Size | 459.5 MB | 110.2 MB |
| Events in quadrant A | 2,847,479 | 810,326 |
| Events in quadrant B | 3,040,603 | 816,484 |
| Events in quadrant C | 2,993,585 | 771,410 |
| Events in quadrant D | 5,318,677 | 698,748 |
| Mode M0 | |||
|---|---|---|---|
| Quadrant | BADHDUFLAG | Total packets | Discarded packets |
| A | 0 | 12070 | 2 |
| B | 0 | 12585 | 1 |
| C | 0 | 12561 | 1 |
| D | 0 | 19738 | 1 |
| Mode M9 | |||
|---|---|---|---|
| Quadrant | BADHDUFLAG | Total packets | Discarded packets |
| A | 0 | 13 | 0 |
| B | 0 | 13 | 0 |
| C | 0 | 13 | 0 |
| D | 0 | 13 | 0 |
| Mode SS | |||
|---|---|---|---|
| Quadrant | BADHDUFLAG | Total packets | Discarded packets |
| A | 0 | 118 | 0 |
| B | 0 | 118 | 0 |
| C | 0 | 118 | 0 |
| D | 0 | 118 | 0 |
| Quadrant | Total seconds | Saturated seconds | Saturation percentage |
|---|---|---|---|
| A | 5763 | 89 | 1.544335% |
| B | 5763 | 74 | 1.284053% |
| C | 5763 | 109 | 1.891376% |
| D | 5763 | 854 | 14.818671% |
Noise dominated data is calculated using 1-second bins in cleaned event files. If a bin has >2000 counts, and if more than 50% of those come from <1% of pixels, then it is considered to be noise-dominated and hence unusable.
| Quadrant | # 1 sec bins | Bins with >0 counts | Bins with >2000 counts | High rate bins dominated by noise | Noise dominated (total time) | Noise dominated (detector-on time) | Marked lightcurve |
|---|---|---|---|---|---|---|---|
| A | 7054 | 5765 | 11 | 11 | 0.16% | 0.19% | 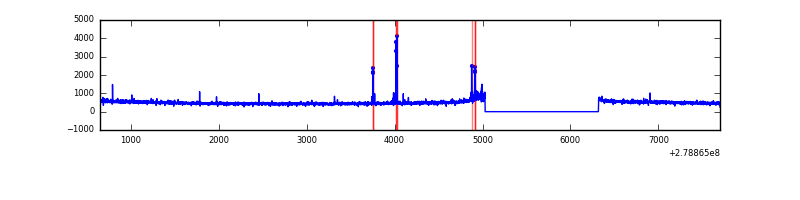 |
| B | 7054 | 5765 | 3 | 3 | 0.04% | 0.05% | 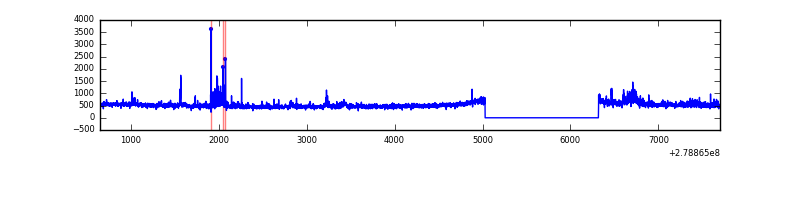 |
| C | 7054 | 5765 | 0 | 0 | 0.00% | 0.00% | 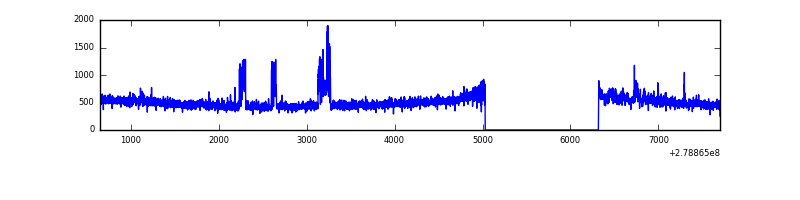 |
| D | 7054 | 5765 | 586 | 586 | 8.31% | 10.16% | 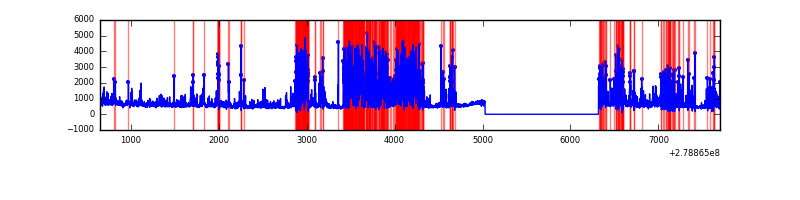 |
Top three noisy pixels from each quadrant. If the there are fewer than three noisy pixels in the level2.evt file, extra rows are filled as -1
| Pixel properties | Quadrant properties | ||||||
|---|---|---|---|---|---|---|---|
| Quadrant | DetID | PixID | Counts | Sigma | Mean | Median | Sigma |
| A | 15 | 174 | 64294 | 440.45 | 724 | 711 | 144.4 |
| A | 0 | 226 | 6442 | 39.7 | 724 | 711 | 144.4 |
| A | 12 | 194 | 5531 | 33.39 | 724 | 711 | 144.4 |
| B | 15 | 35 | 67619 | 496.89 | 726 | 709 | 134.7 |
| B | 3 | 209 | 46707 | 341.59 | 726 | 709 | 134.7 |
| B | 5 | 236 | 28419 | 205.78 | 726 | 709 | 134.7 |
| C | 3 | 233 | 205168 | 1304.17 | 683 | 688 | 156.8 |
| C | 14 | 238 | 110570 | 700.83 | 683 | 688 | 156.8 |
| C | 0 | 207 | 13858 | 84.0 | 683 | 688 | 156.8 |
| D | 1 | 52 | 2458701 | 15773.78 | 648 | 629 | 155.8 |
| D | 2 | 16 | 164408 | 1050.99 | 648 | 629 | 155.8 |
| D | 10 | 70 | 63474 | 403.28 | 648 | 629 | 155.8 |
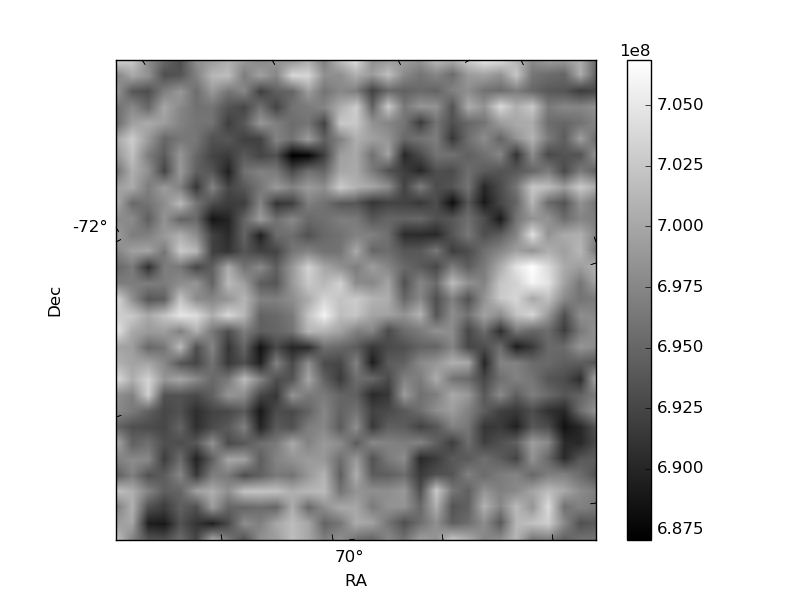
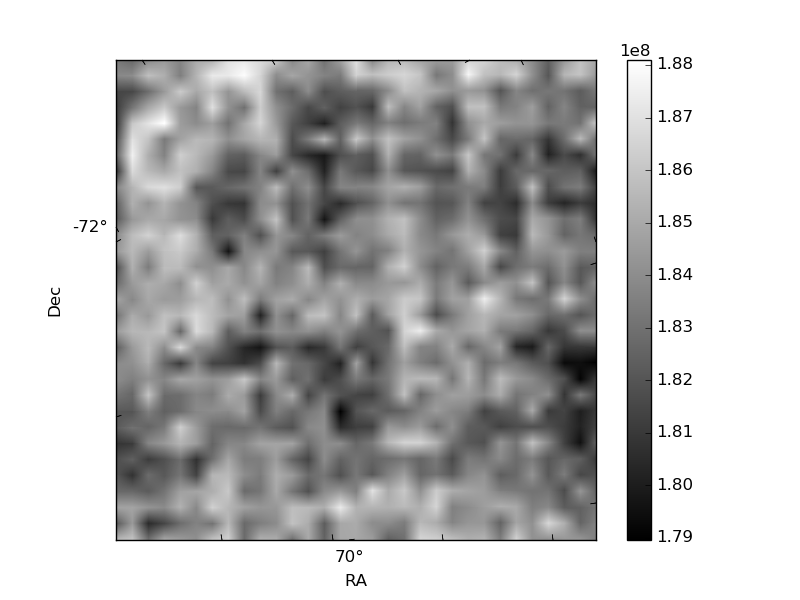
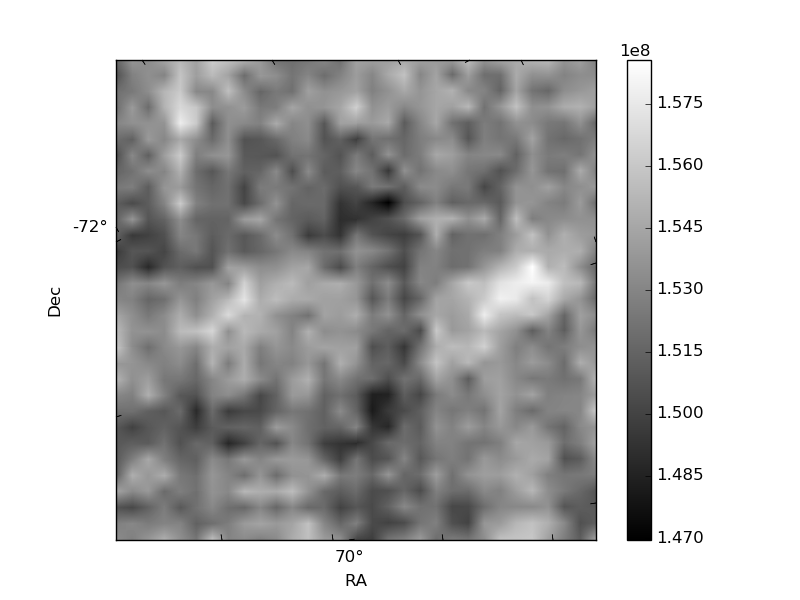
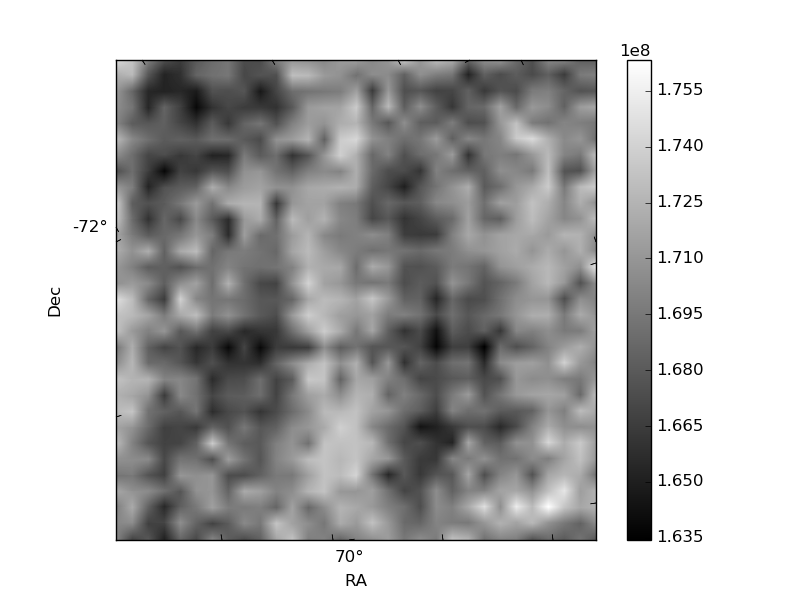
Histogram calculated using DETX and DETY for each event in the final _common_clean file
| Quadrant A | 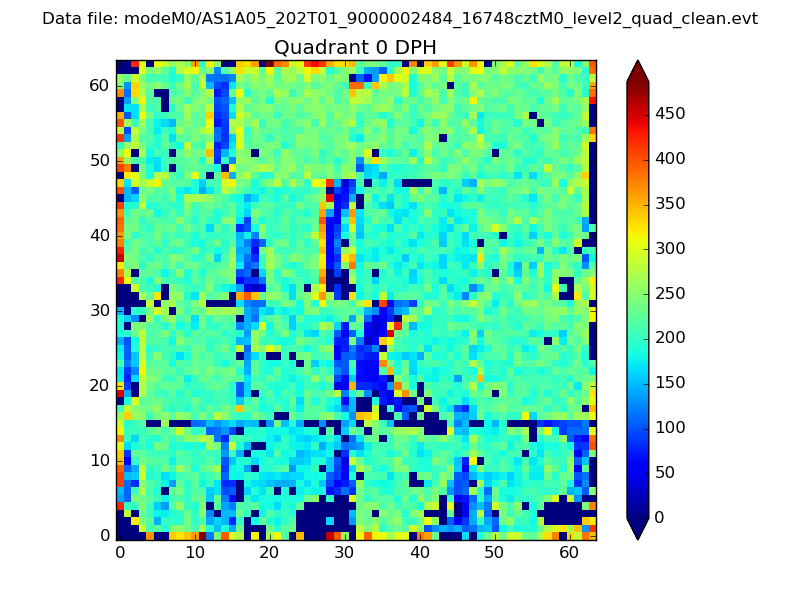 |
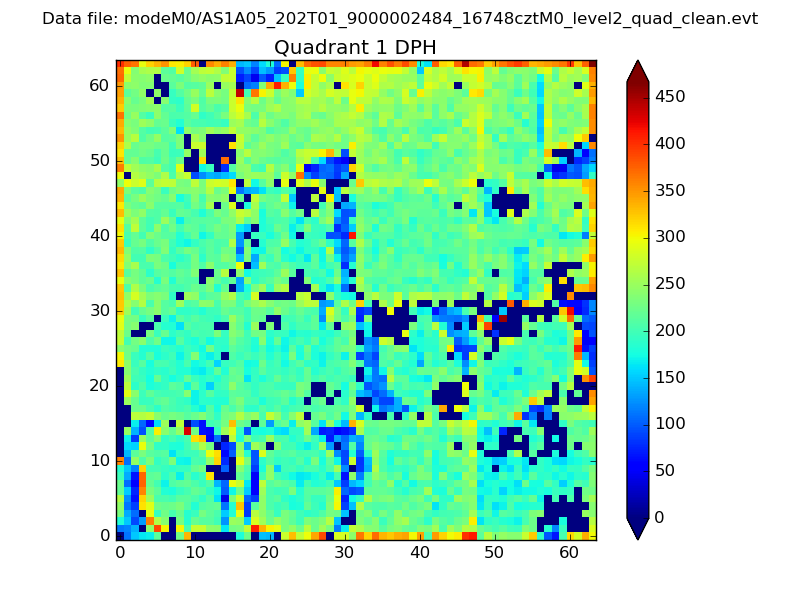 |
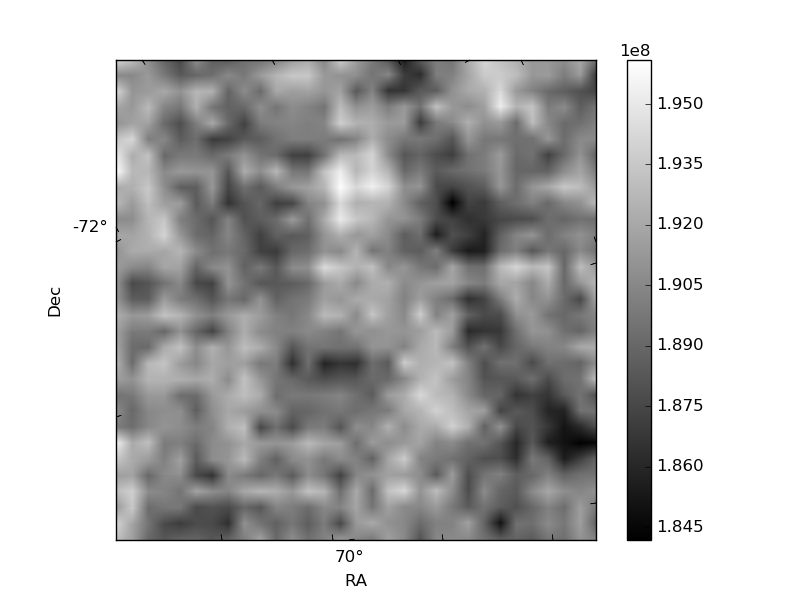
Quadrant B |
|---|---|---|---|
| Quadrant D | 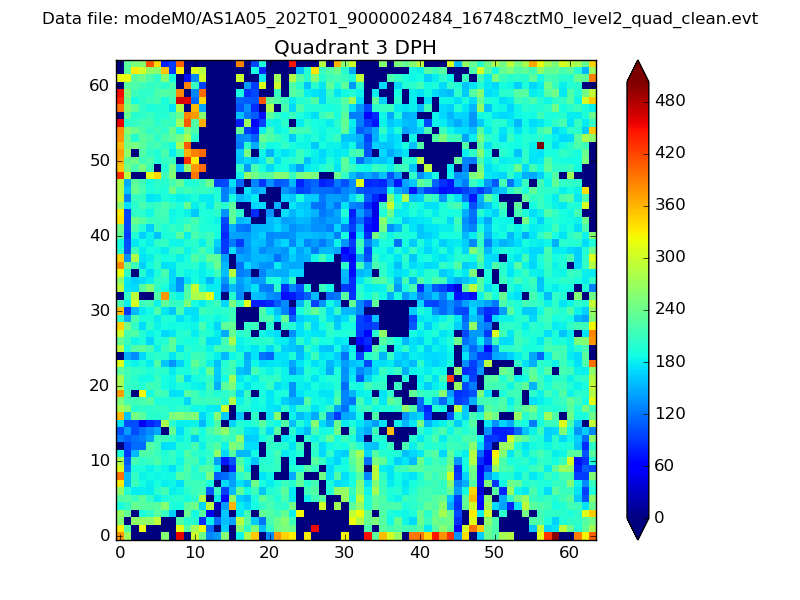 |
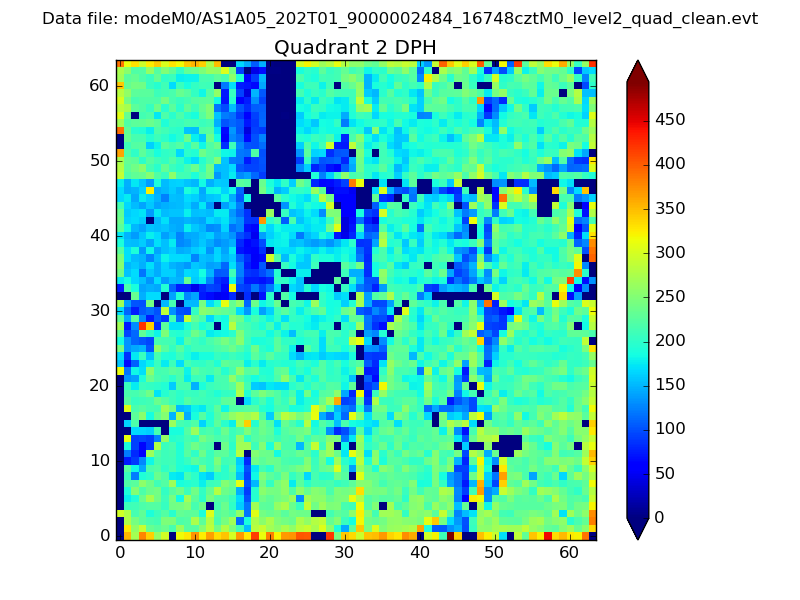 |
Quadrant C |
| Plot type | Count rate plots | Images |
|---|---|---|
| Comparison with Poisson distribution Blue bars denote a histogram of data divided into 1 sec bins. Red curve is a Poisson curve with rate = median count rate of data. |
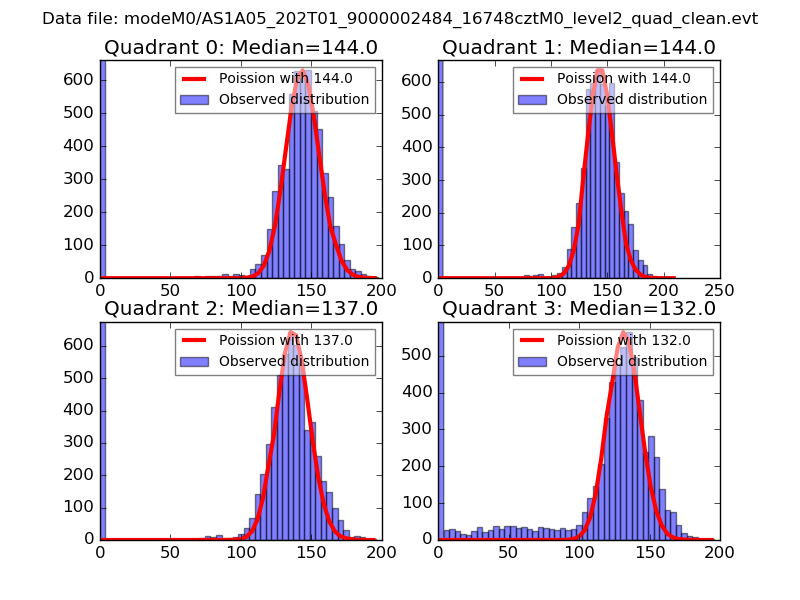 |
 |
| Quadrant-wise count rates Data is divided into 100 sec bins |
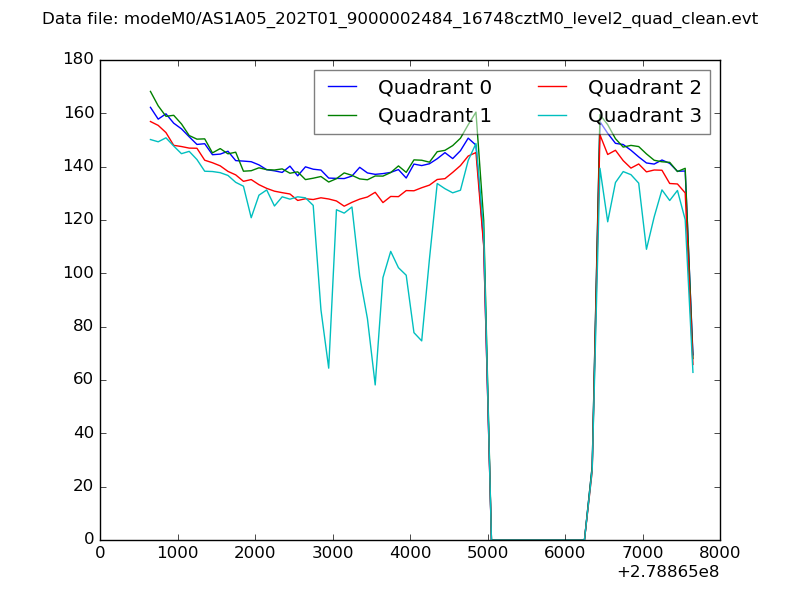 |
|
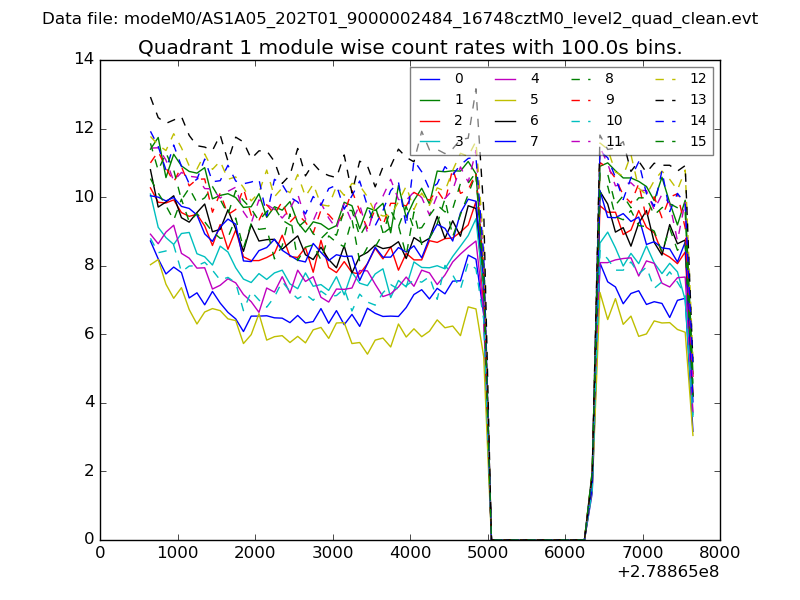
| Module-wise count rates for Quadrant A Data is divided into 100 sec bins |
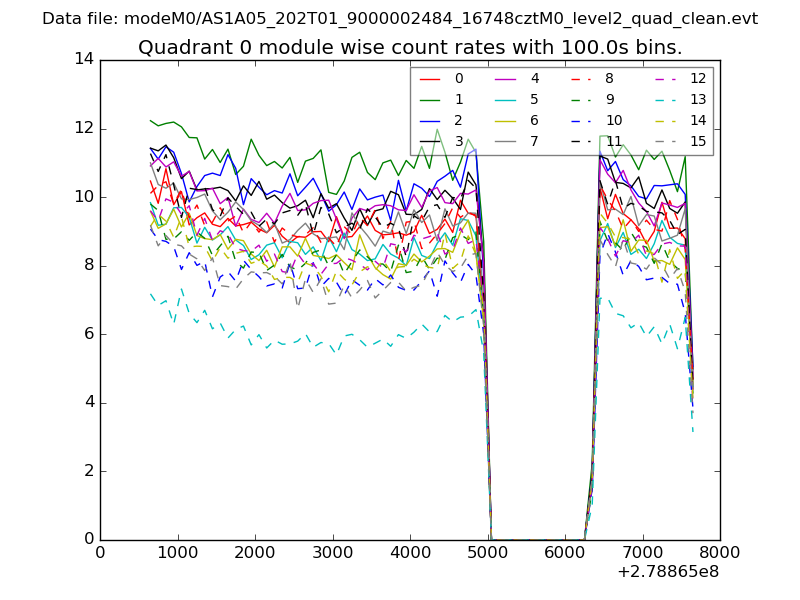 |
 |
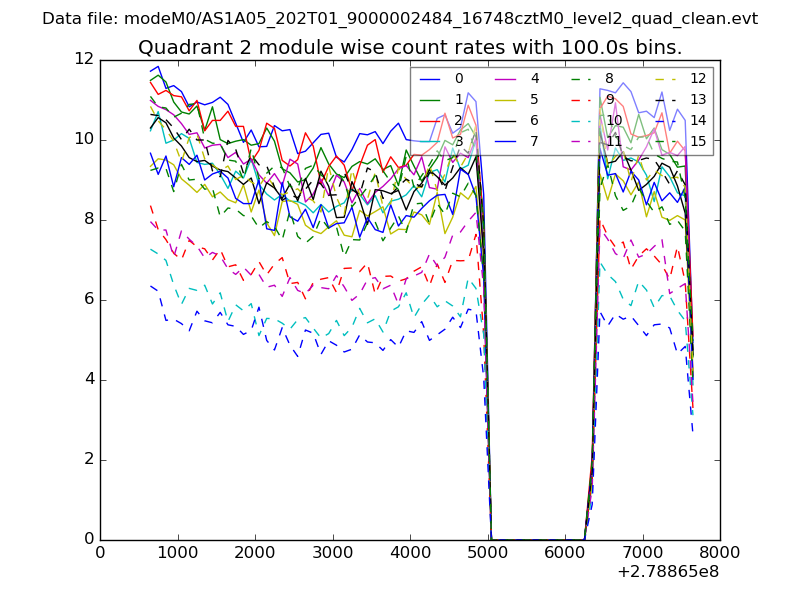
| Module-wise count rates for Quadrant B Data is divided into 100 sec bins |
 |
 |
| Module-wise count rates for Quadrant C Data is divided into 100 sec bins |
 |
 |
| Module-wise count rates for Quadrant D Data is divided into 100 sec bins |
 |
 |
| Parameter | Plot |
|---|---|
| CZT HV Monitor | 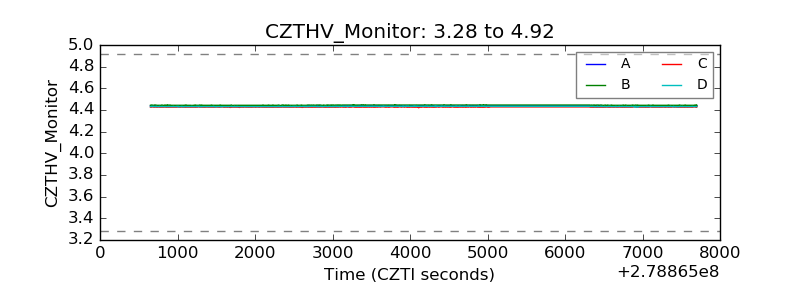 |
| D_VDD | 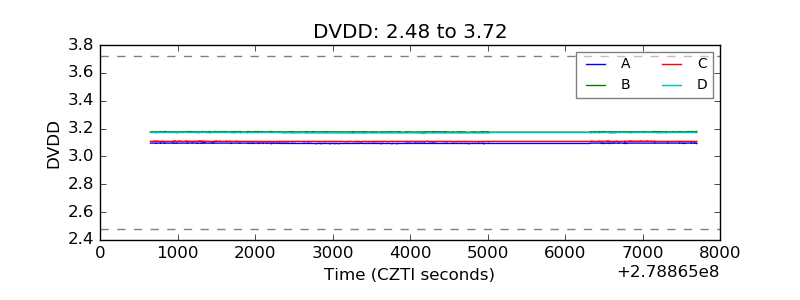 |
| Temperature 1 | 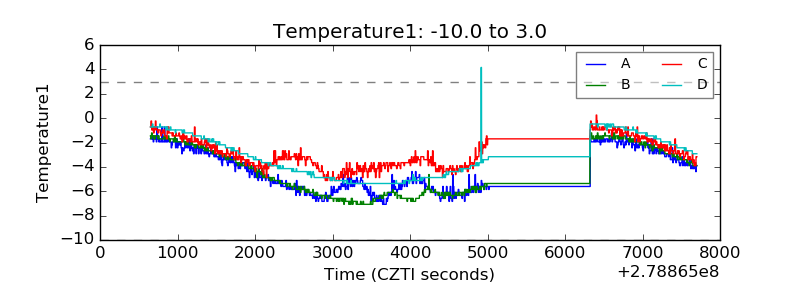 |
| Veto HV Monitor | 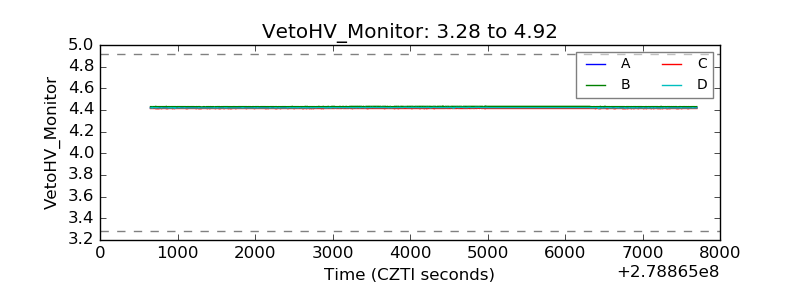 |
| Veto LLD | 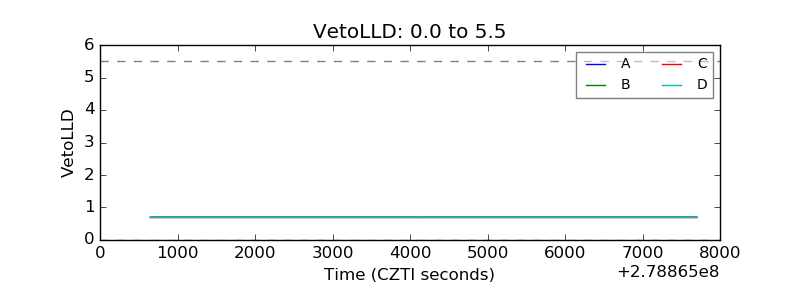 |
| Alpha Counter | 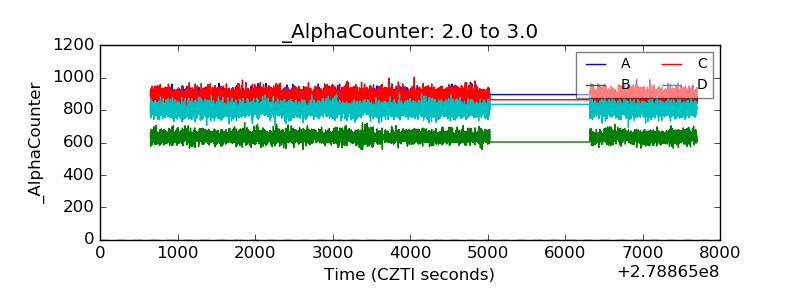 |
| _CPM_Rate | 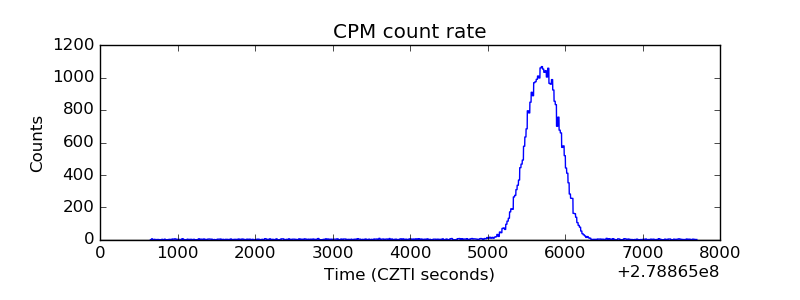 |
| CZT Counter | 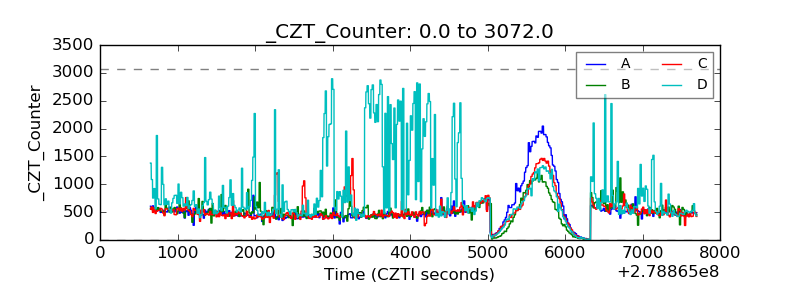 |
| +2.5 Volts monitor |  |
| +5 Volts monitor |  |
| _ROLL_ROT | 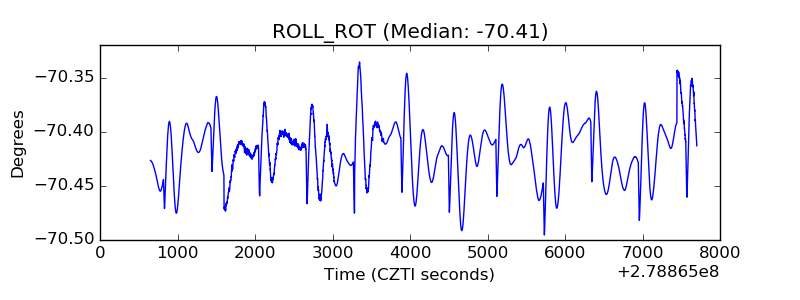 |
| _Roll_DEC | 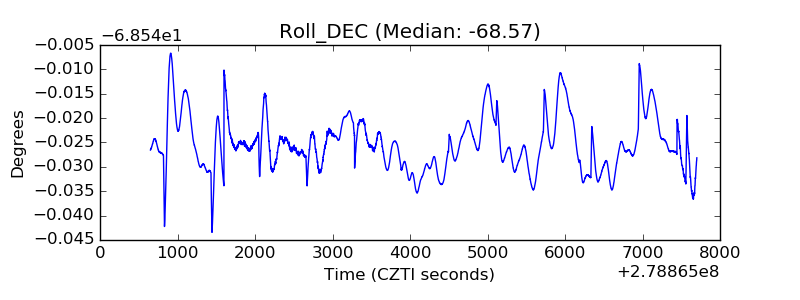 |
| _Roll_RA | 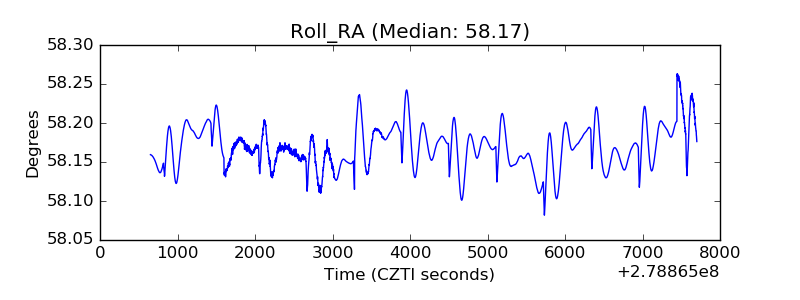 |
| Veto Counter | 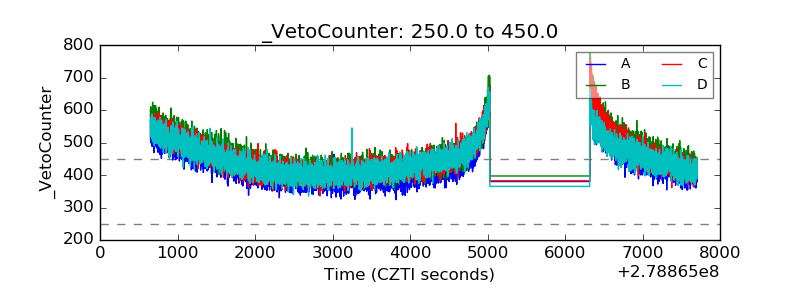 |