| Param | Original file | Final file |
|---|---|---|
| Filename | modeM0/AS1A05_202T01_9000002484_16749cztM0_level2.evt | modeM0/AS1A05_202T01_9000002484_16749cztM0_level2_quad_clean.evt |
| Size (bytes) | 576,887,040 | 123,183,360 |
| Size | 550.2 MB | 117.5 MB |
| Events in quadrant A | 3,089,413 | 867,413 |
| Events in quadrant B | 3,614,941 | 875,267 |
| Events in quadrant C | 3,336,240 | 830,801 |
| Events in quadrant D | 6,989,679 | 703,525 |
| Mode M0 | |||
|---|---|---|---|
| Quadrant | BADHDUFLAG | Total packets | Discarded packets |
| A | 0 | 13413 | 3 |
| B | 0 | 14969 | 2 |
| C | 0 | 14200 | 2 |
| D | 0 | 25252 | 2 |
| Mode M9 | |||
|---|---|---|---|
| Quadrant | BADHDUFLAG | Total packets | Discarded packets |
| A | 0 | 13 | 0 |
| B | 0 | 13 | 0 |
| C | 0 | 13 | 0 |
| D | 0 | 14 | 0 |
| Mode SS | |||
|---|---|---|---|
| Quadrant | BADHDUFLAG | Total packets | Discarded packets |
| A | 0 | 132 | 0 |
| B | 0 | 132 | 0 |
| C | 0 | 132 | 0 |
| D | 0 | 132 | 0 |
| Quadrant | Total seconds | Saturated seconds | Saturation percentage |
|---|---|---|---|
| A | 6499 | 26 | 0.400062% |
| B | 6499 | 100 | 1.538698% |
| C | 6499 | 72 | 1.107863% |
| D | 6499 | 1520 | 23.388214% |
Noise dominated data is calculated using 1-second bins in cleaned event files. If a bin has >2000 counts, and if more than 50% of those come from <1% of pixels, then it is considered to be noise-dominated and hence unusable.
| Quadrant | # 1 sec bins | Bins with >0 counts | Bins with >2000 counts | High rate bins dominated by noise | Noise dominated (total time) | Noise dominated (detector-on time) | Marked lightcurve |
|---|---|---|---|---|---|---|---|
| A | 7520 | 6501 | 0 | 0 | 0.00% | 0.00% | 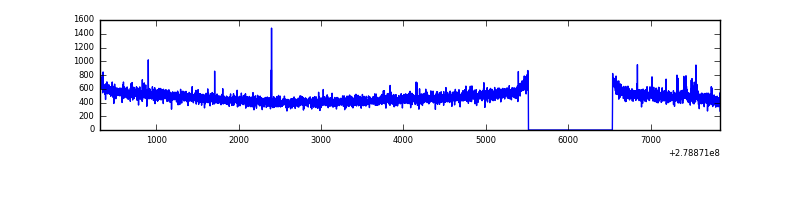 |
| B | 7520 | 6501 | 50 | 50 | 0.66% | 0.77% | 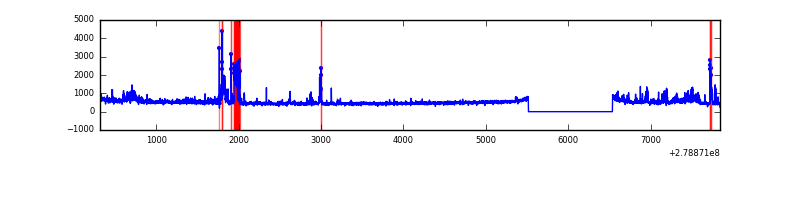 |
| C | 7520 | 6501 | 2 | 2 | 0.03% | 0.03% | 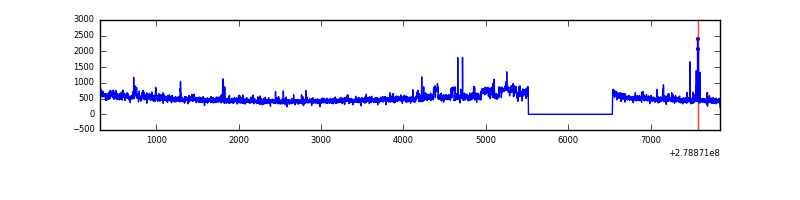 |
| D | 7520 | 6501 | 960 | 960 | 12.77% | 14.77% | 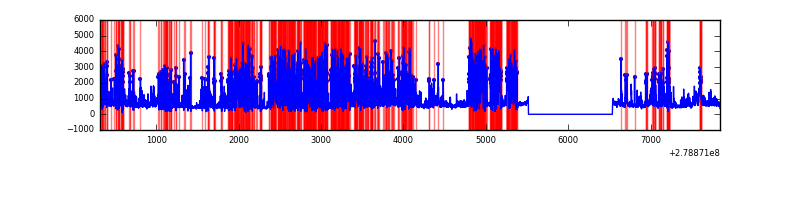 |
Top three noisy pixels from each quadrant. If the there are fewer than three noisy pixels in the level2.evt file, extra rows are filled as -1
| Pixel properties | Quadrant properties | ||||||
|---|---|---|---|---|---|---|---|
| Quadrant | DetID | PixID | Counts | Sigma | Mean | Median | Sigma |
| A | 3 | 1 | 26230 | 159.18 | 795 | 780 | 159.9 |
| A | 15 | 174 | 8253 | 46.74 | 795 | 780 | 159.9 |
| A | 0 | 226 | 7059 | 39.27 | 795 | 780 | 159.9 |
| B | 3 | 209 | 199439 | 1348.12 | 794 | 775 | 147.4 |
| B | 15 | 35 | 123394 | 832.08 | 794 | 775 | 147.4 |
| B | 0 | 189 | 86171 | 579.49 | 794 | 775 | 147.4 |
| C | 3 | 233 | 236134 | 1369.23 | 751 | 757 | 171.9 |
| C | 14 | 238 | 119260 | 689.35 | 751 | 757 | 171.9 |
| C | 0 | 207 | 49360 | 282.73 | 751 | 757 | 171.9 |
| D | 1 | 52 | 3667412 | 22848.14 | 668 | 649 | 160.5 |
| D | 15 | 0 | 290720 | 1807.47 | 668 | 649 | 160.5 |
| D | 2 | 16 | 205090 | 1273.9 | 668 | 649 | 160.5 |
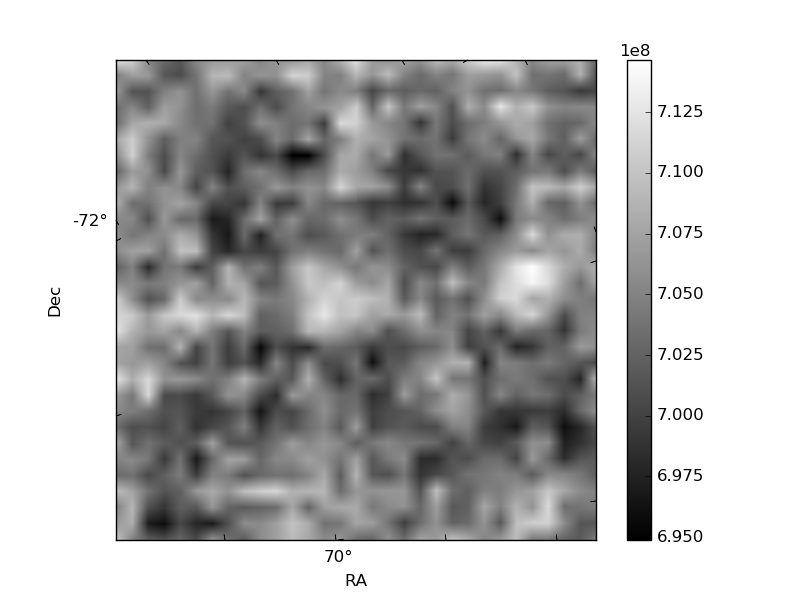
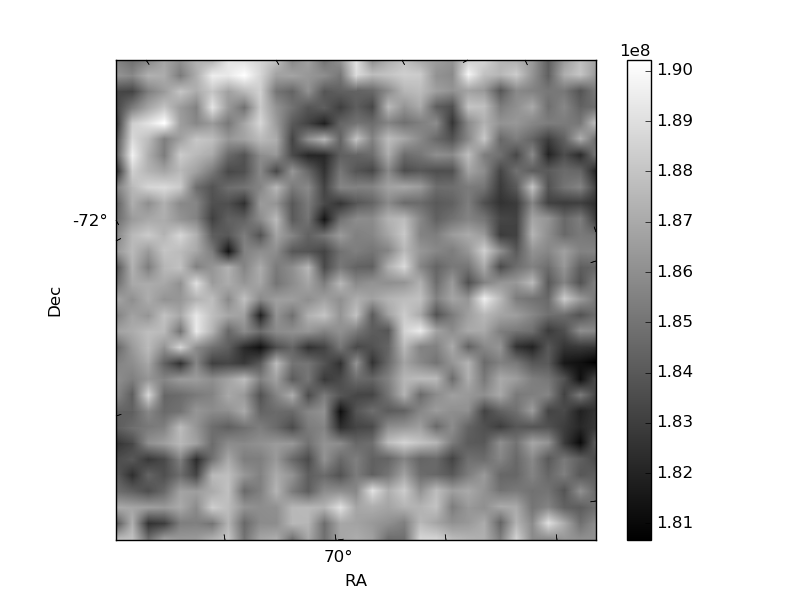
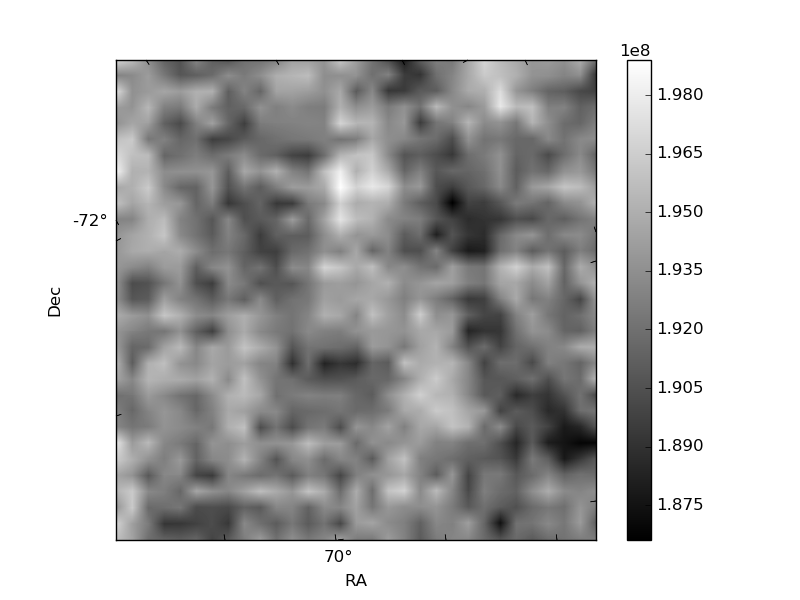
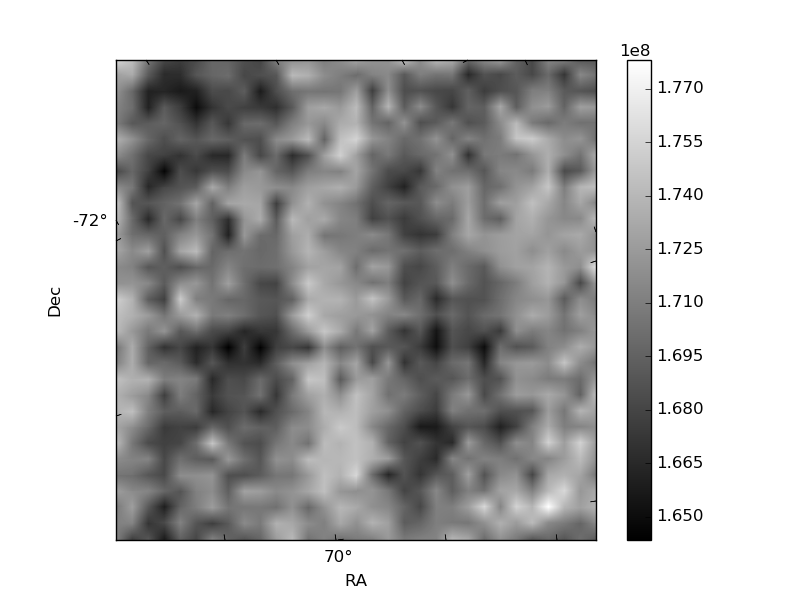
Histogram calculated using DETX and DETY for each event in the final _common_clean file
| Quadrant A | 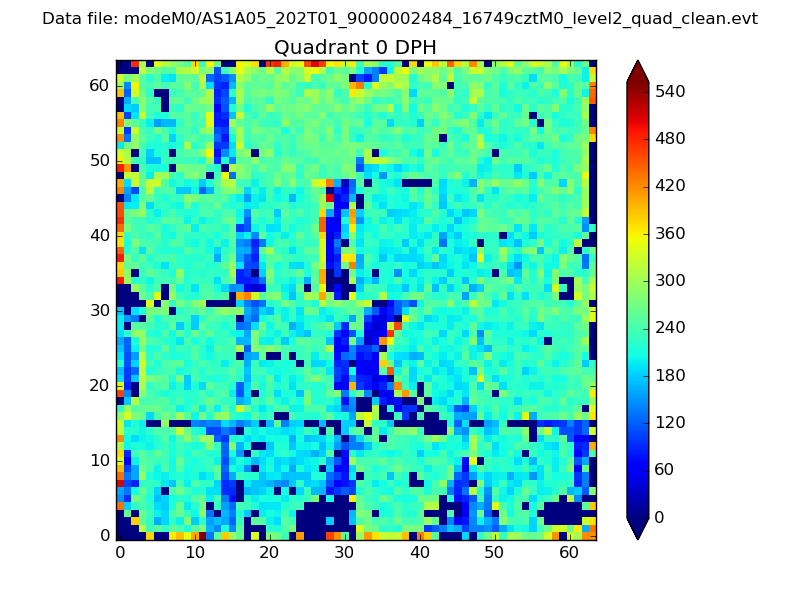 |
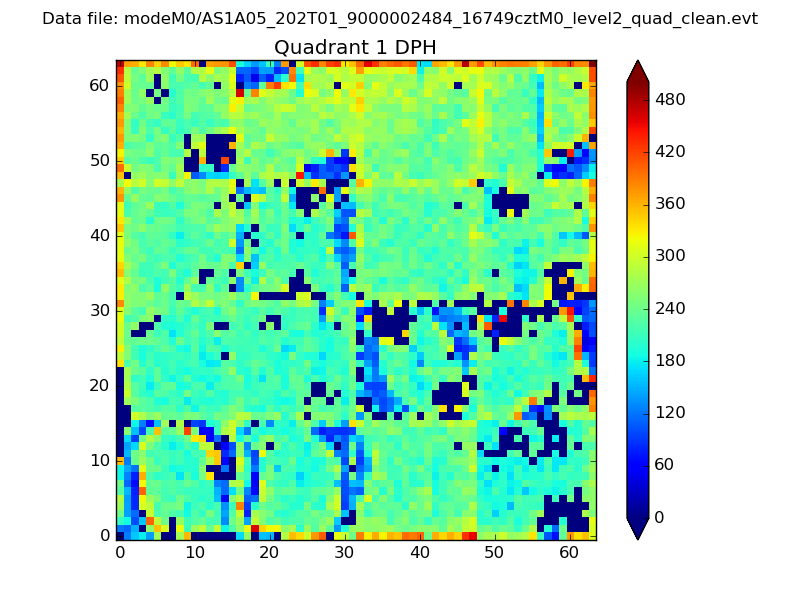 |
Quadrant B |
|---|---|---|---|
| Quadrant D | 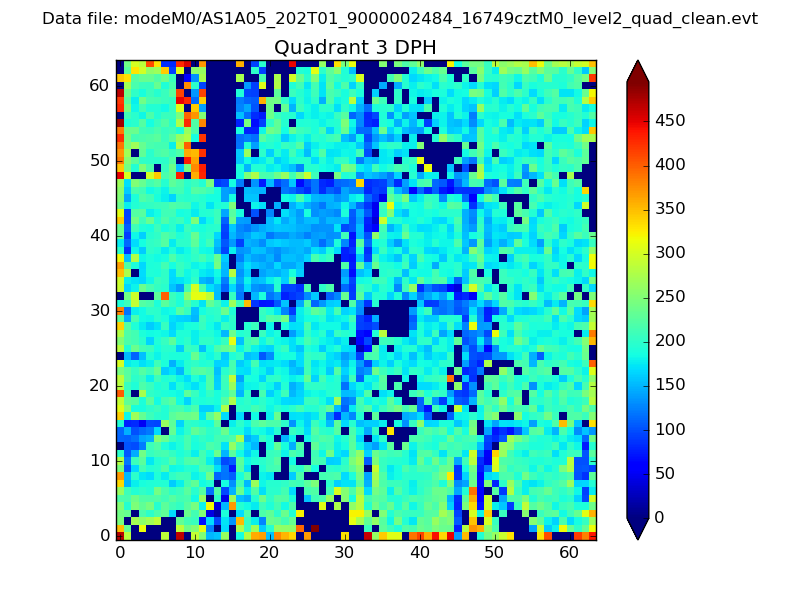 |
 |
Quadrant C |
| Plot type | Count rate plots | Images |
|---|---|---|
| Comparison with Poisson distribution Blue bars denote a histogram of data divided into 1 sec bins. Red curve is a Poisson curve with rate = median count rate of data. |
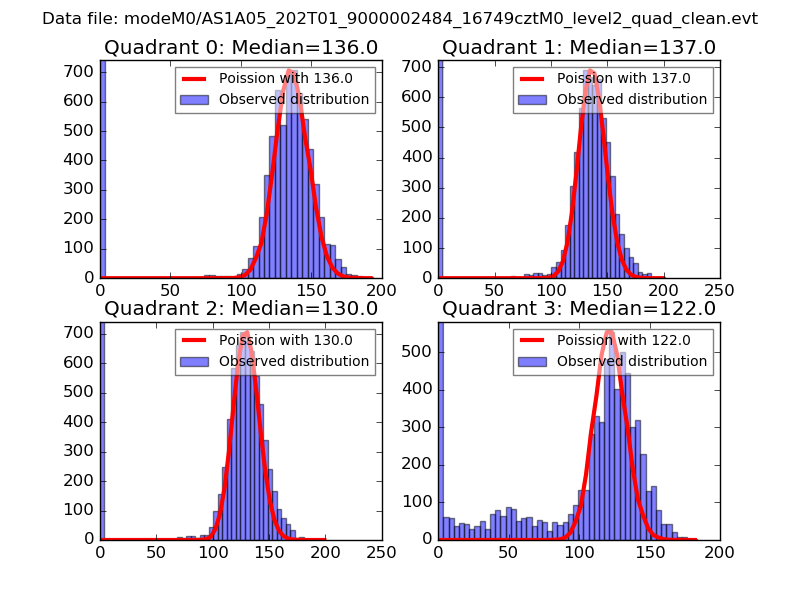 |
 |
| Quadrant-wise count rates Data is divided into 100 sec bins |
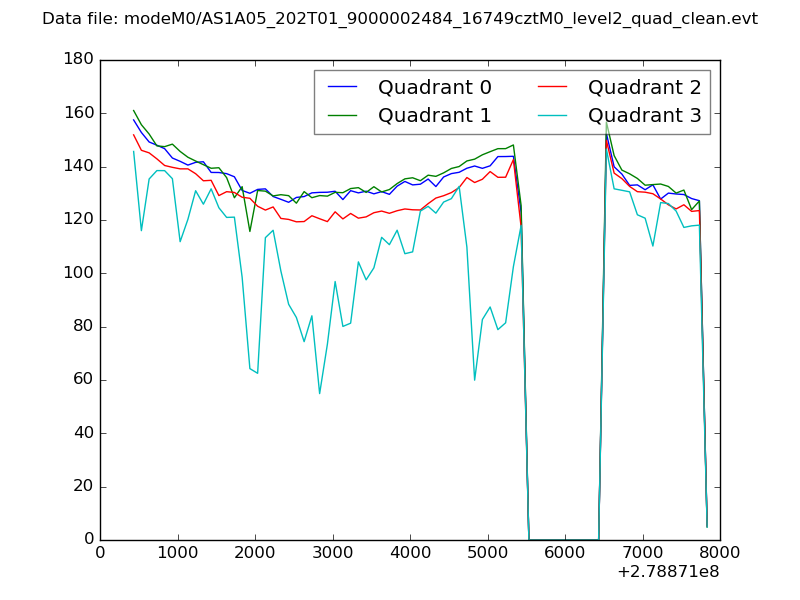 |
|
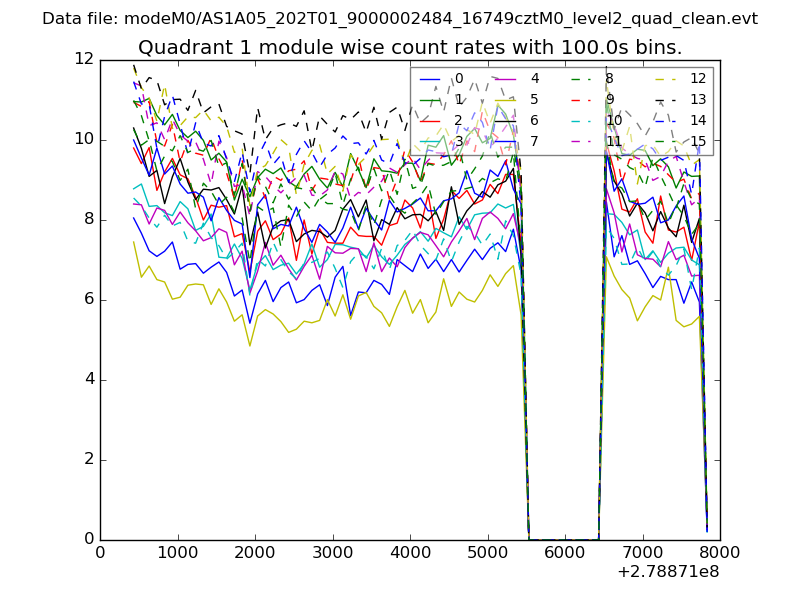
| Module-wise count rates for Quadrant A Data is divided into 100 sec bins |
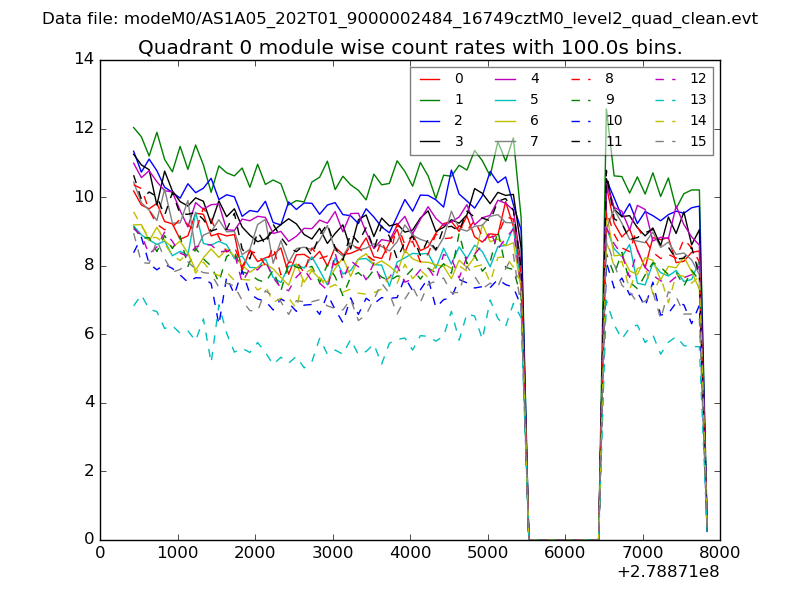 |
 |
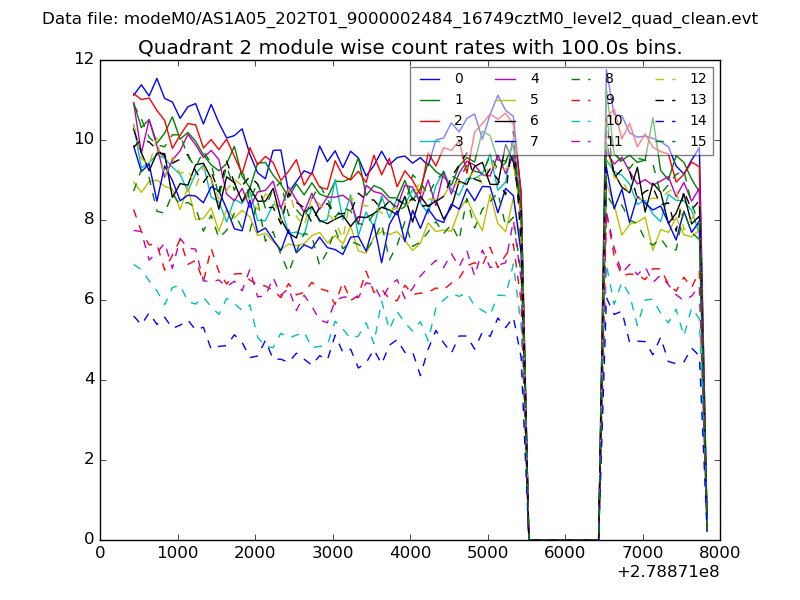
| Module-wise count rates for Quadrant B Data is divided into 100 sec bins |
 |
 |
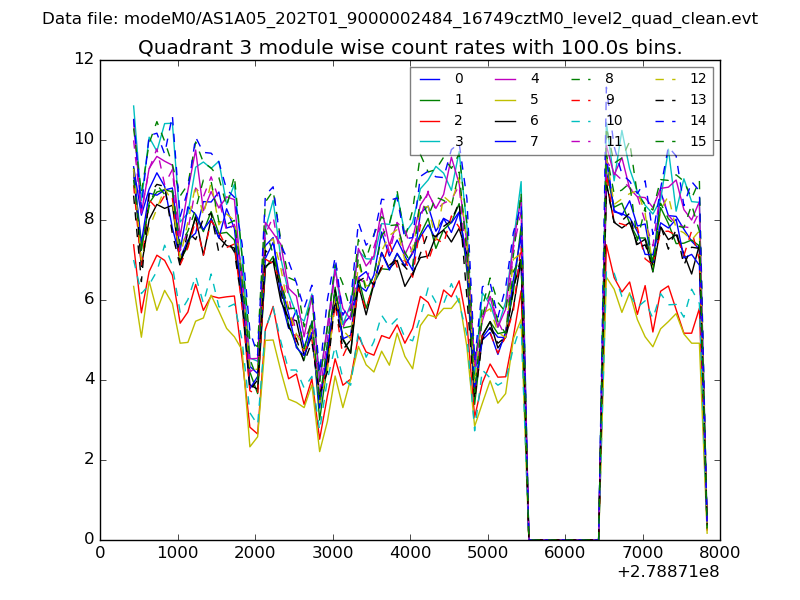
| Module-wise count rates for Quadrant C Data is divided into 100 sec bins |
 |
 |
| Module-wise count rates for Quadrant D Data is divided into 100 sec bins |
 |
 |
| Parameter | Plot |
|---|---|
| CZT HV Monitor | 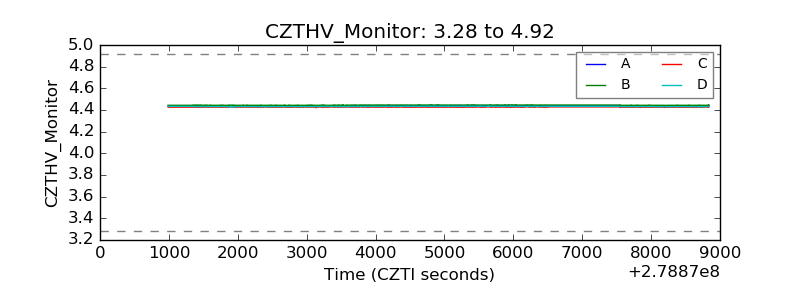 |
| D_VDD | 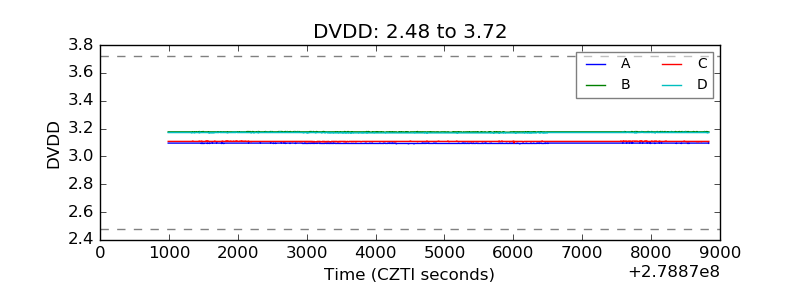 |
| Temperature 1 | 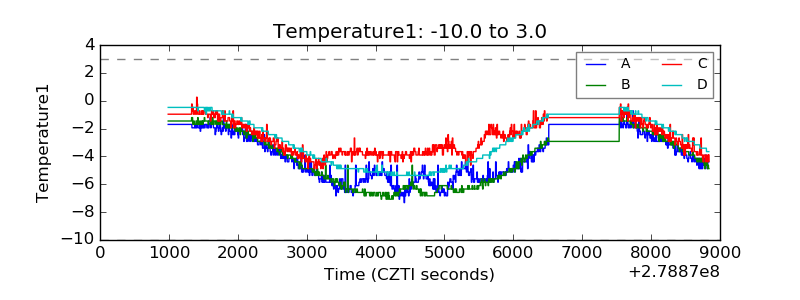 |
| Veto HV Monitor | 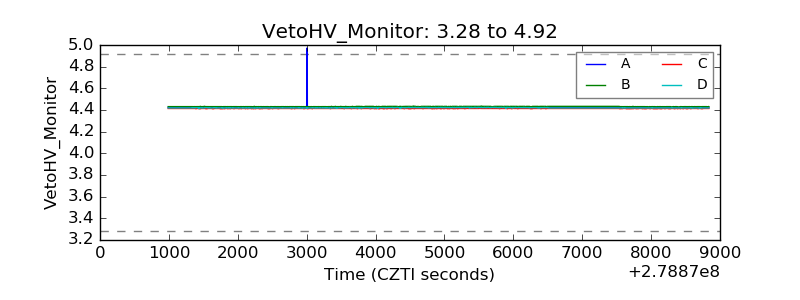 |
| Veto LLD | 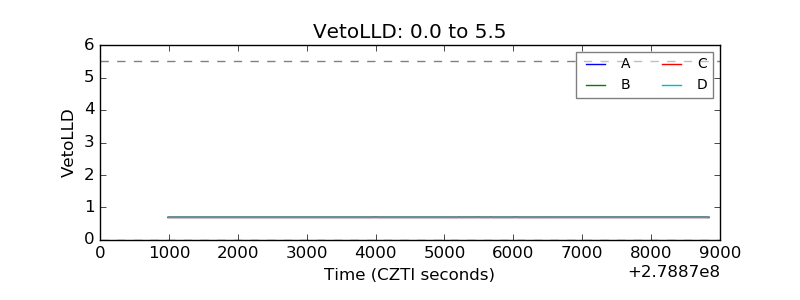 |
| Alpha Counter | 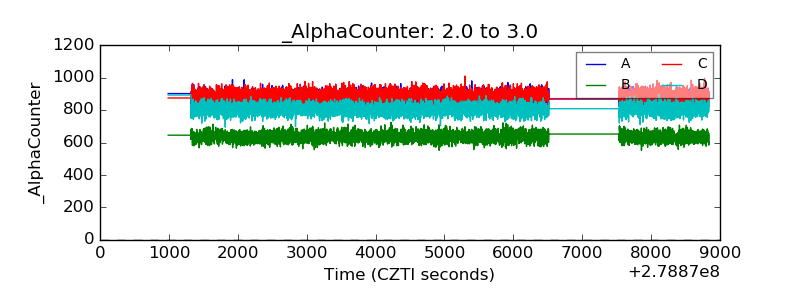 |
| _CPM_Rate | 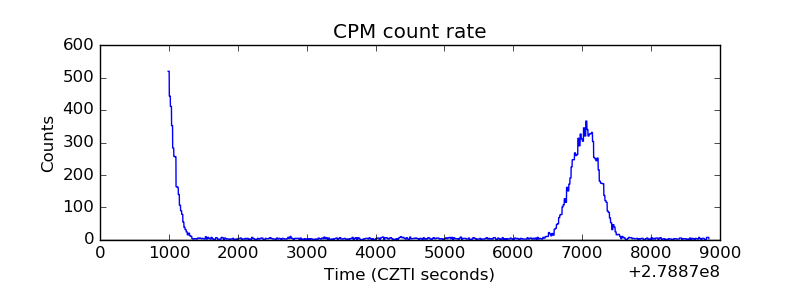 |
| CZT Counter |  |
| +2.5 Volts monitor |  |
| +5 Volts monitor |  |
| _ROLL_ROT | 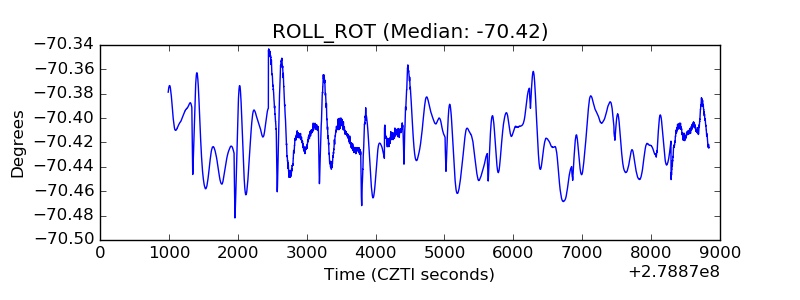 |
| _Roll_DEC | 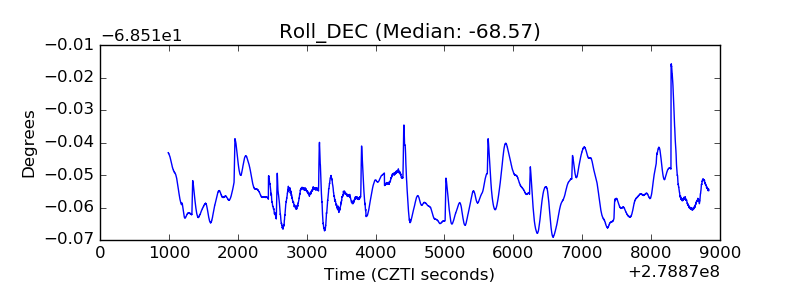 |
| _Roll_RA | 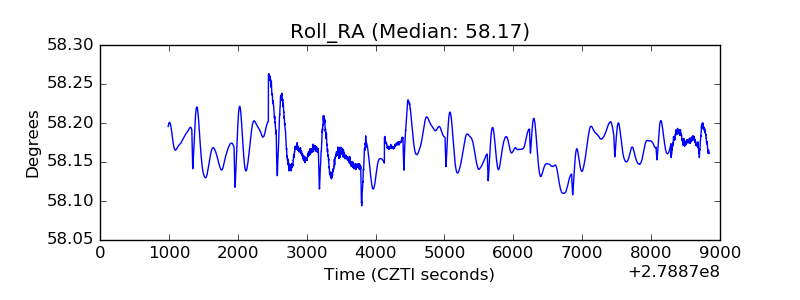 |
| Veto Counter | 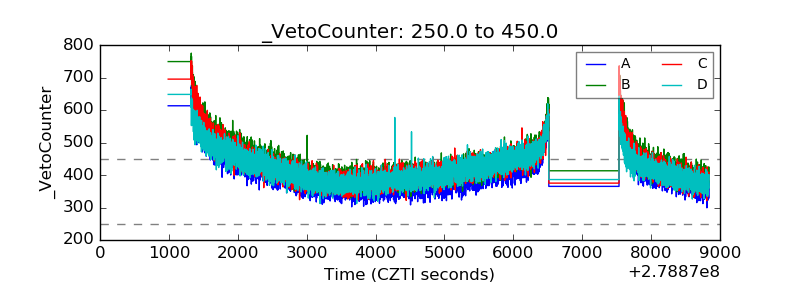 |