| Param | Original file | Final file |
|---|---|---|
| Filename | modeM0/AS1A05_202T01_9000002484_16750cztM0_level2.evt | modeM0/AS1A05_202T01_9000002484_16750cztM0_level2_quad_clean.evt |
| Size (bytes) | 563,296,320 | 119,954,880 |
| Size | 537.2 MB | 114.4 MB |
| Events in quadrant A | 3,258,629 | 811,695 |
| Events in quadrant B | 3,644,921 | 818,014 |
| Events in quadrant C | 3,411,655 | 781,219 |
| Events in quadrant D | 6,266,538 | 731,050 |
| Mode M0 | |||
|---|---|---|---|
| Quadrant | BADHDUFLAG | Total packets | Discarded packets |
| A | 0 | 14506 | 3 |
| B | 0 | 15528 | 2 |
| C | 0 | 14861 | 2 |
| D | 0 | 23761 | 2 |
| Mode M9 | |||
|---|---|---|---|
| Quadrant | BADHDUFLAG | Total packets | Discarded packets |
| A | 0 | 12 | 0 |
| B | 0 | 12 | 0 |
| C | 0 | 12 | 0 |
| D | 0 | 13 | 0 |
| Mode SS | |||
|---|---|---|---|
| Quadrant | BADHDUFLAG | Total packets | Discarded packets |
| A | 0 | 142 | 0 |
| B | 0 | 142 | 0 |
| C | 0 | 142 | 0 |
| D | 0 | 142 | 0 |
| Quadrant | Total seconds | Saturated seconds | Saturation percentage |
|---|---|---|---|
| A | 7052 | 39 | 0.553035% |
| B | 7052 | 85 | 1.205332% |
| C | 7052 | 69 | 0.978446% |
| D | 7052 | 530 | 7.515598% |
Noise dominated data is calculated using 1-second bins in cleaned event files. If a bin has >2000 counts, and if more than 50% of those come from <1% of pixels, then it is considered to be noise-dominated and hence unusable.
| Quadrant | # 1 sec bins | Bins with >0 counts | Bins with >2000 counts | High rate bins dominated by noise | Noise dominated (total time) | Noise dominated (detector-on time) | Marked lightcurve |
|---|---|---|---|---|---|---|---|
| A | 7643 | 7054 | 0 | 0 | 0.00% | 0.00% | 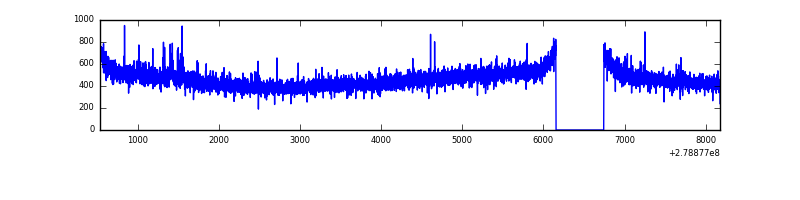 |
| B | 7643 | 7054 | 14 | 14 | 0.18% | 0.20% | 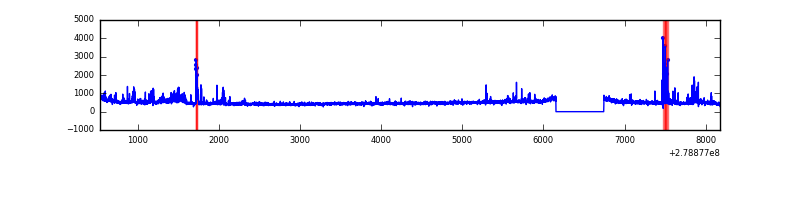 |
| C | 7643 | 7054 | 2 | 2 | 0.03% | 0.03% | 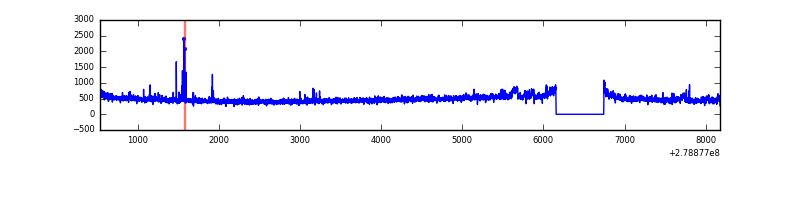 |
| D | 7643 | 7054 | 357 | 357 | 4.67% | 5.06% | 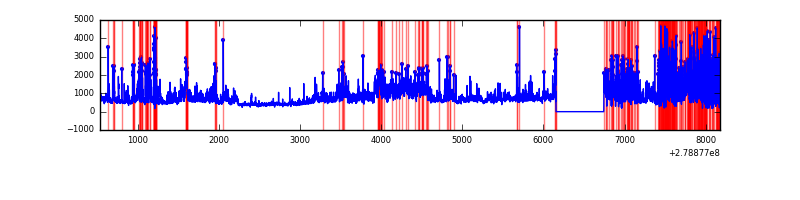 |
Top three noisy pixels from each quadrant. If the there are fewer than three noisy pixels in the level2.evt file, extra rows are filled as -1
| Pixel properties | Quadrant properties | ||||||
|---|---|---|---|---|---|---|---|
| Quadrant | DetID | PixID | Counts | Sigma | Mean | Median | Sigma |
| A | 3 | 1 | 23186 | 132.43 | 838 | 821 | 168.9 |
| A | 15 | 174 | 15876 | 89.15 | 838 | 821 | 168.9 |
| A | 0 | 226 | 7351 | 38.67 | 838 | 821 | 168.9 |
| B | 15 | 35 | 142704 | 891.65 | 841 | 820 | 159.1 |
| B | 0 | 189 | 86021 | 535.43 | 841 | 820 | 159.1 |
| B | 0 | 197 | 35874 | 220.29 | 841 | 820 | 159.1 |
| C | 3 | 233 | 139555 | 752.08 | 800 | 804 | 184.5 |
| C | 14 | 238 | 124881 | 672.54 | 800 | 804 | 184.5 |
| C | 0 | 207 | 28693 | 151.17 | 800 | 804 | 184.5 |
| D | 1 | 52 | 1558731 | 8189.09 | 783 | 759 | 190.2 |
| D | 2 | 16 | 1269374 | 6668.16 | 783 | 759 | 190.2 |
| D | 15 | 0 | 235610 | 1234.44 | 783 | 759 | 190.2 |
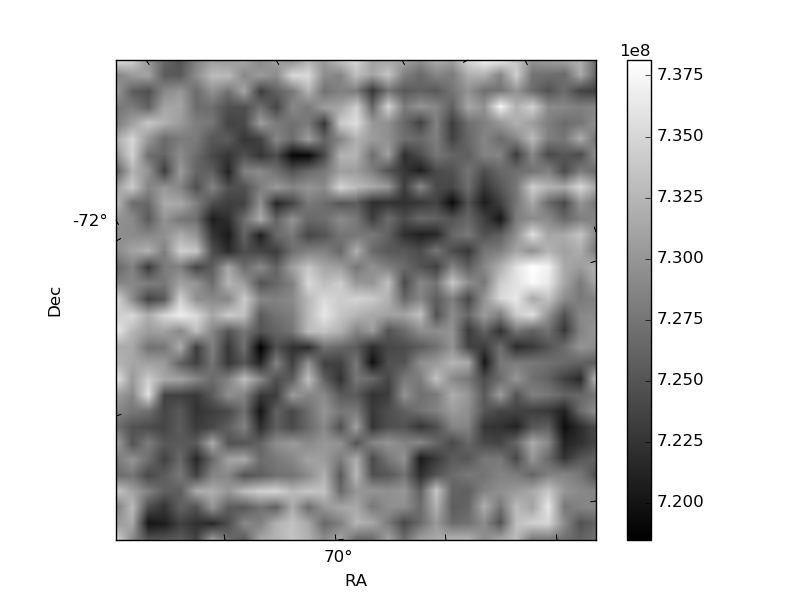
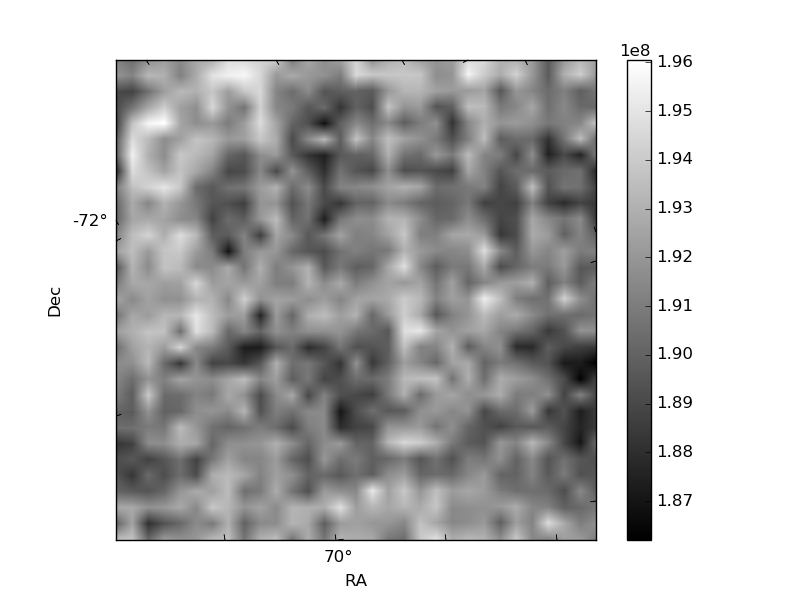
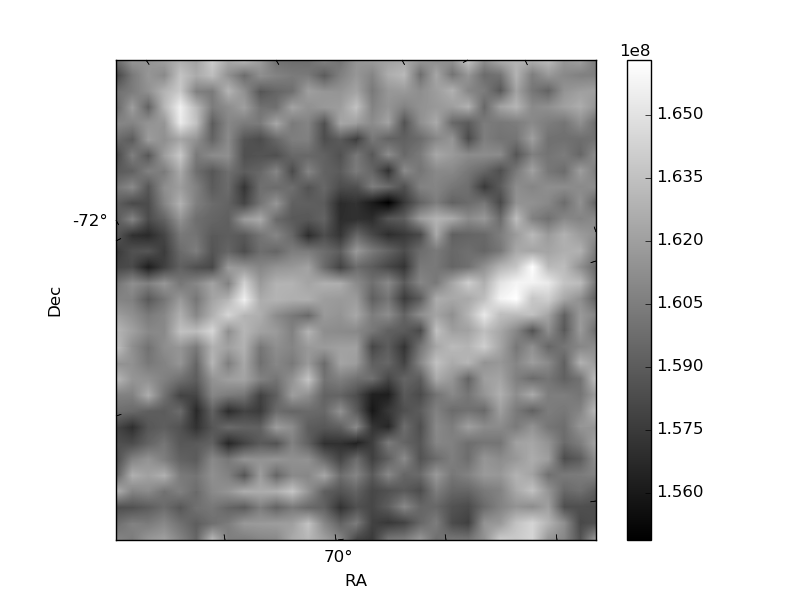
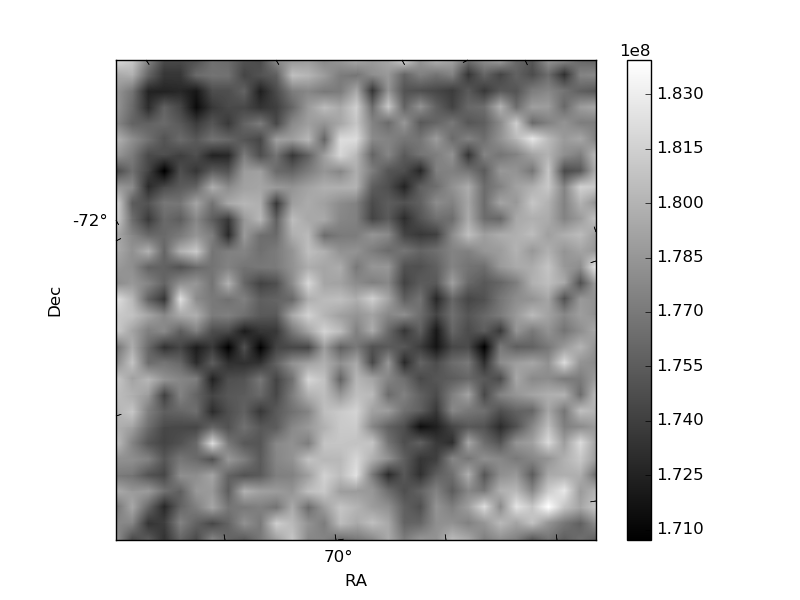
Histogram calculated using DETX and DETY for each event in the final _common_clean file
| Quadrant A | 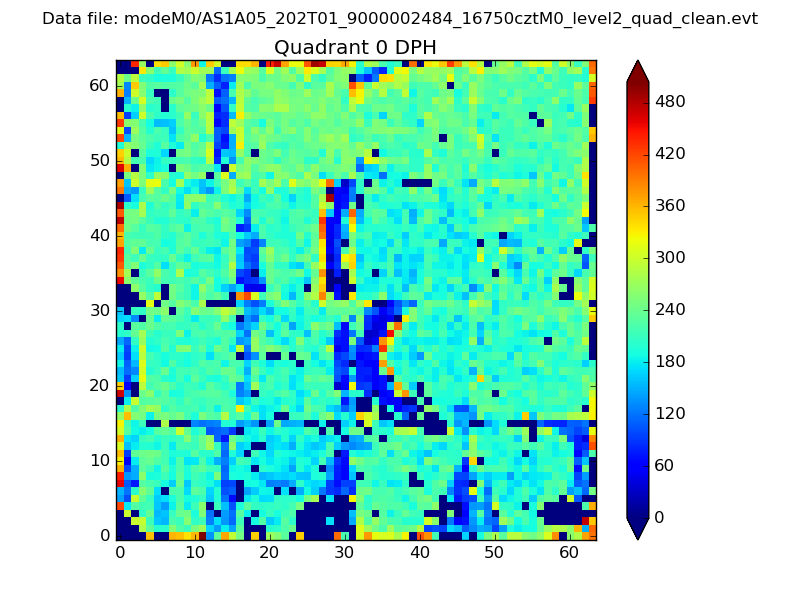 |
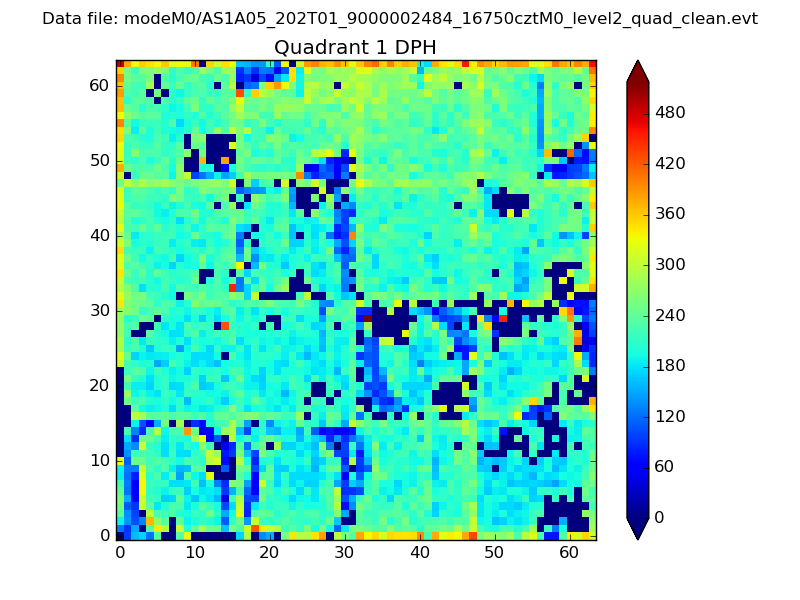 |
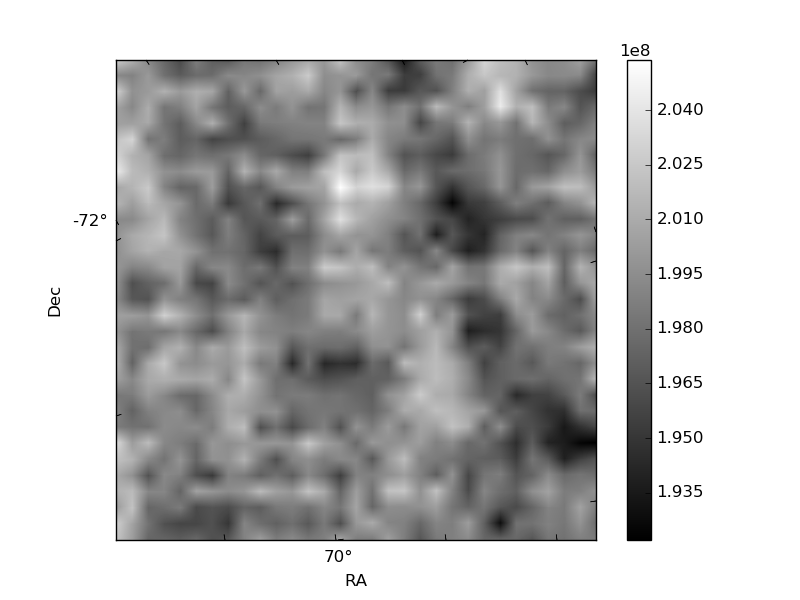
Quadrant B |
|---|---|---|---|
| Quadrant D | 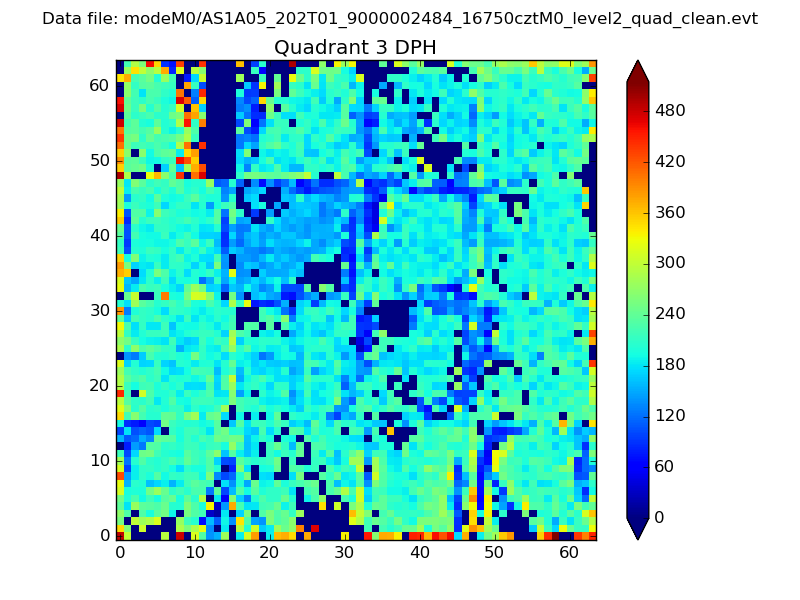 |
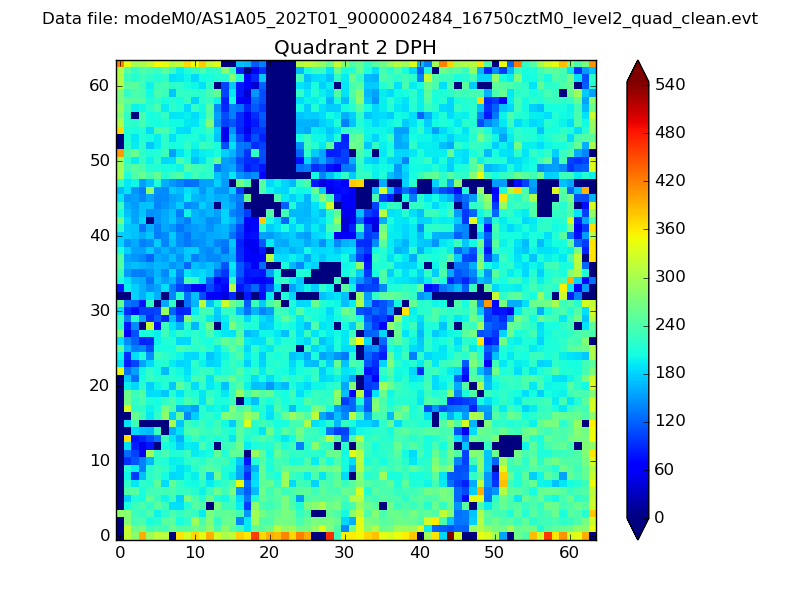 |
Quadrant C |
| Plot type | Count rate plots | Images |
|---|---|---|
| Comparison with Poisson distribution Blue bars denote a histogram of data divided into 1 sec bins. Red curve is a Poisson curve with rate = median count rate of data. |
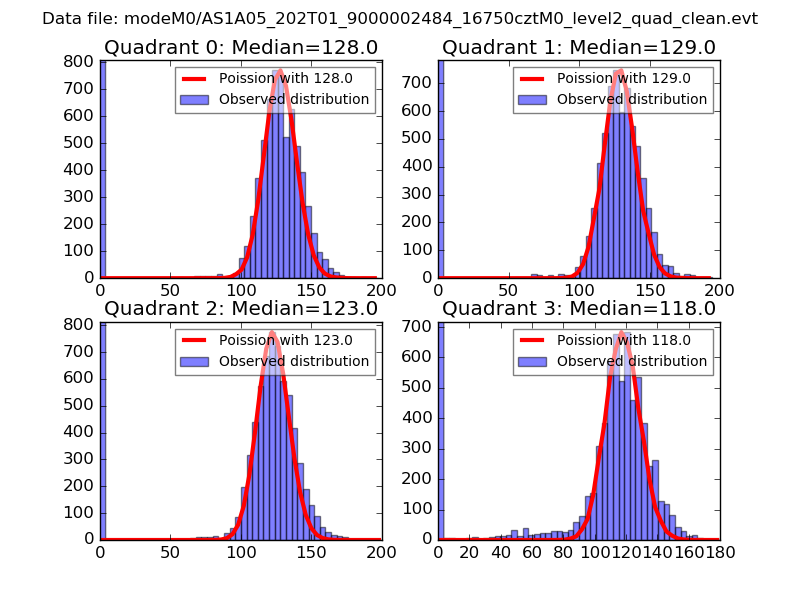 |
 |
| Quadrant-wise count rates Data is divided into 100 sec bins |
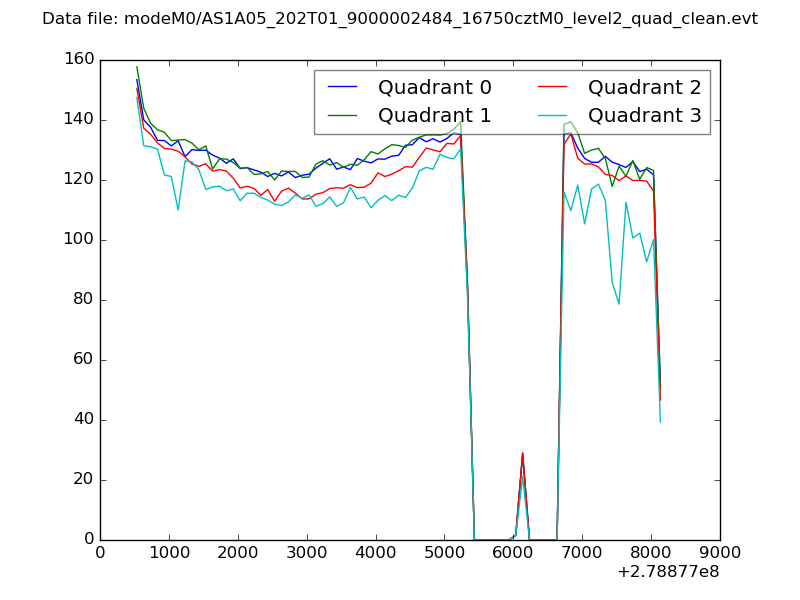 |
|
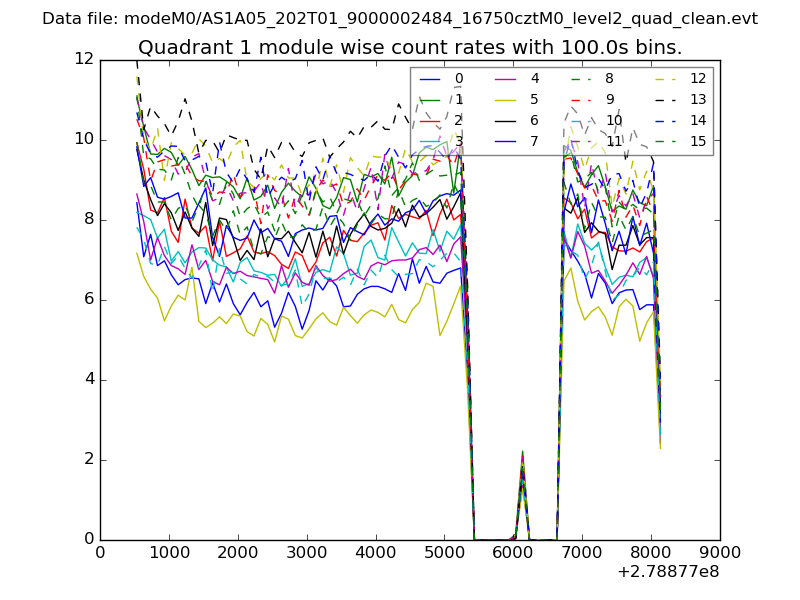
| Module-wise count rates for Quadrant A Data is divided into 100 sec bins |
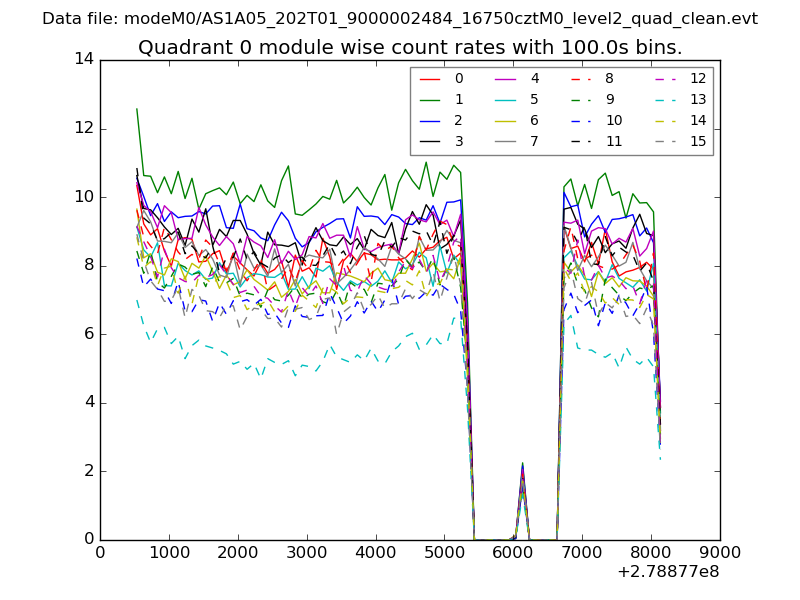 |
 |
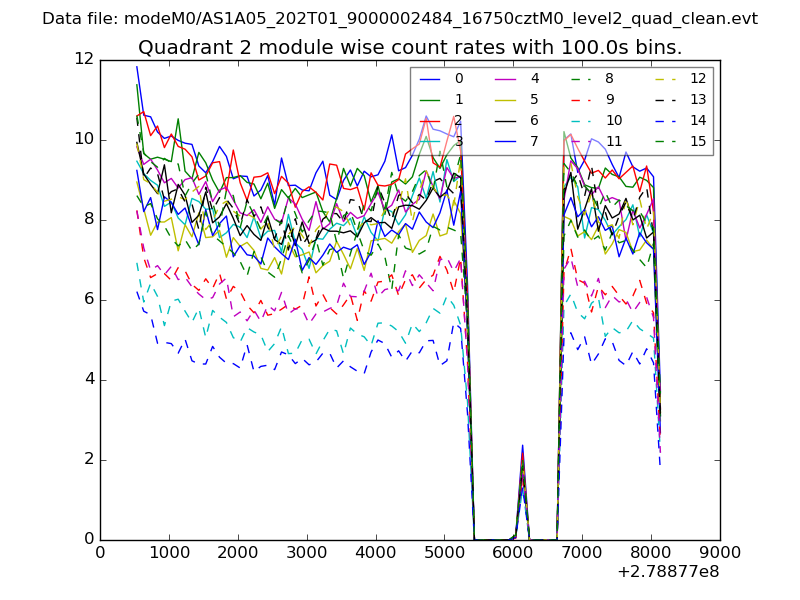
| Module-wise count rates for Quadrant B Data is divided into 100 sec bins |
 |
 |
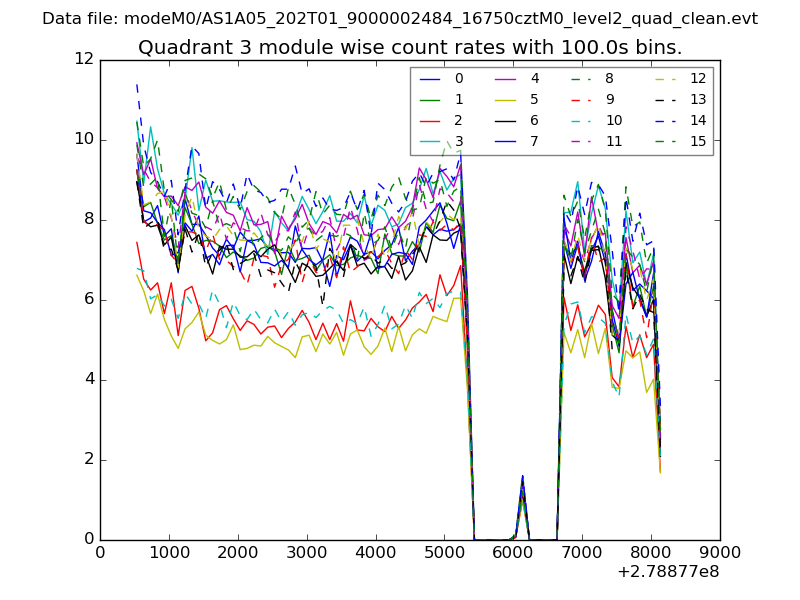
| Module-wise count rates for Quadrant C Data is divided into 100 sec bins |
 |
 |
| Module-wise count rates for Quadrant D Data is divided into 100 sec bins |
 |
 |
| Parameter | Plot |
|---|---|
| CZT HV Monitor | 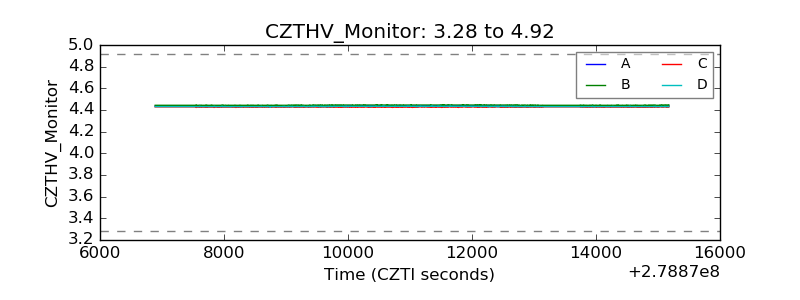 |
| D_VDD | 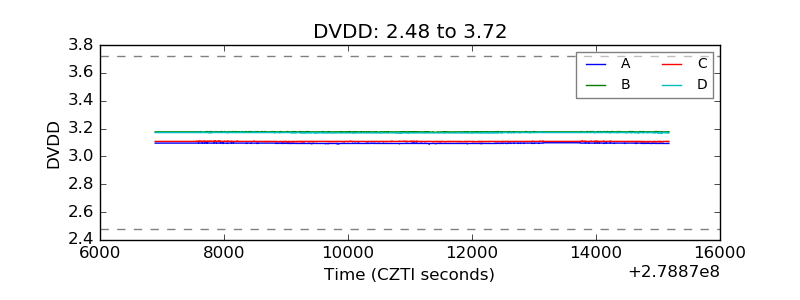 |
| Temperature 1 | 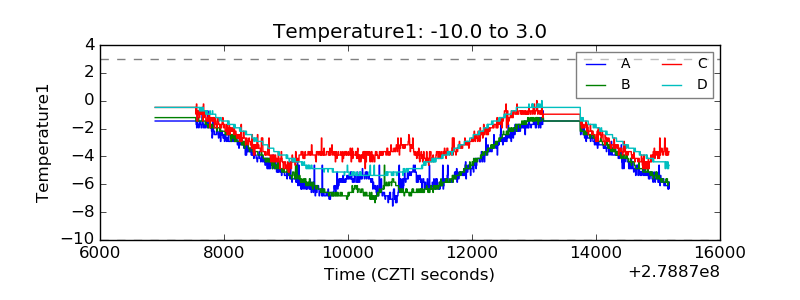 |
| Veto HV Monitor | 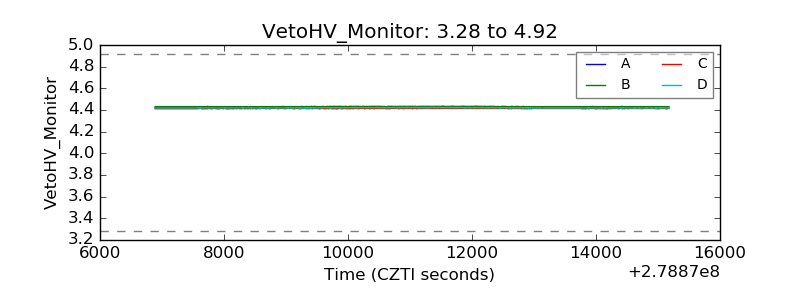 |
| Veto LLD | 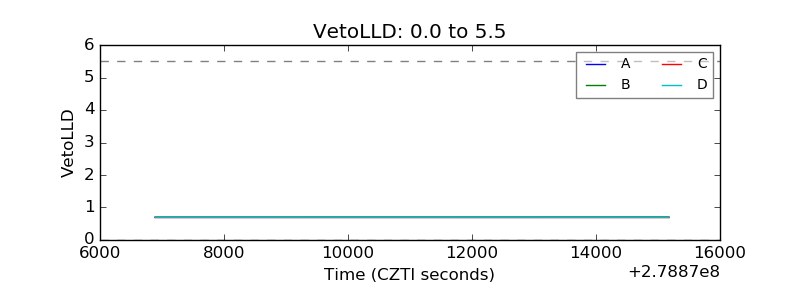 |
| Alpha Counter | 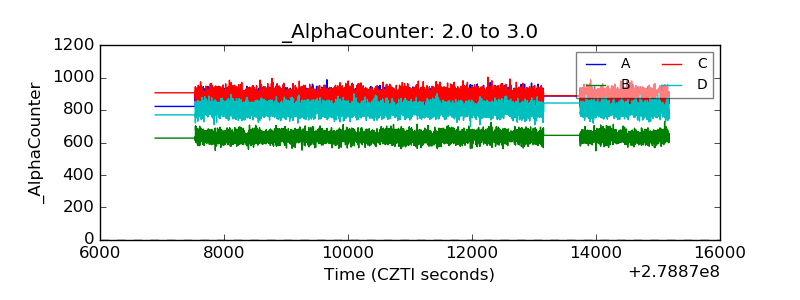 |
| _CPM_Rate | 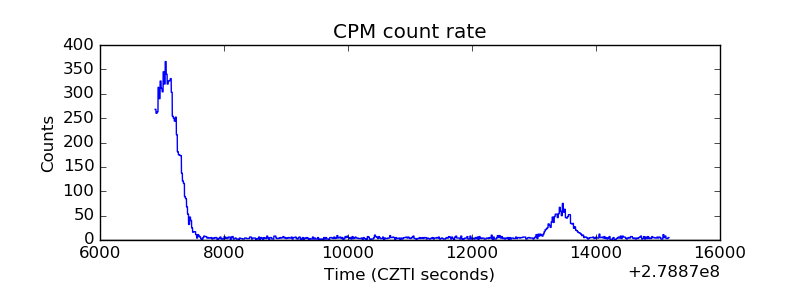 |
| CZT Counter | 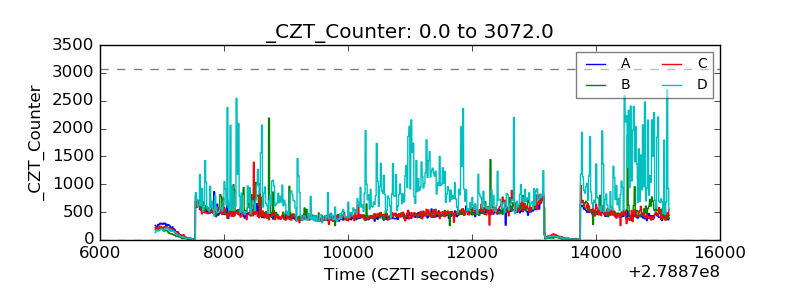 |
| +2.5 Volts monitor | 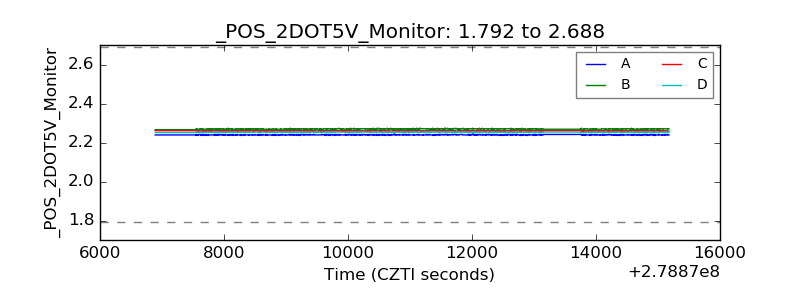 |
| +5 Volts monitor |  |
| _ROLL_ROT | 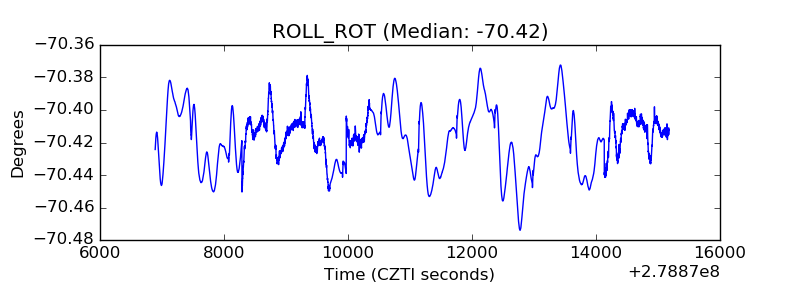 |
| _Roll_DEC | 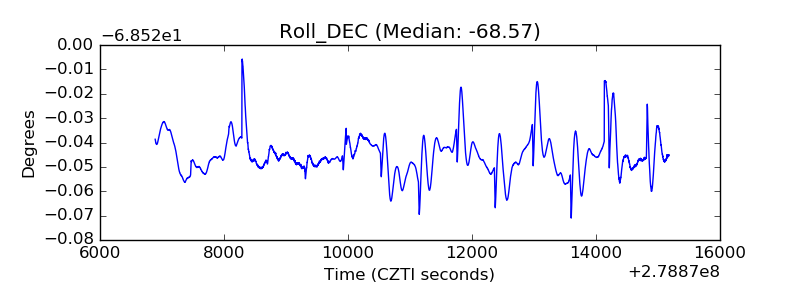 |
| _Roll_RA | 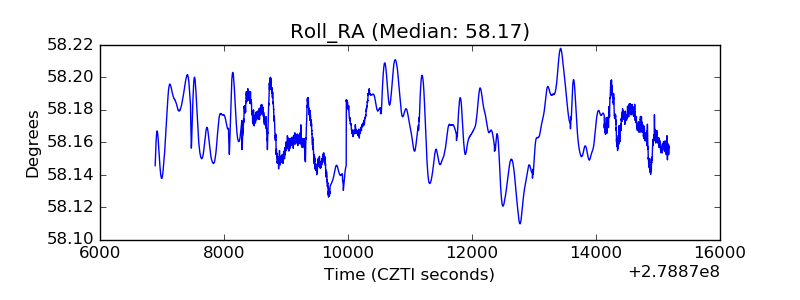 |
| Veto Counter | 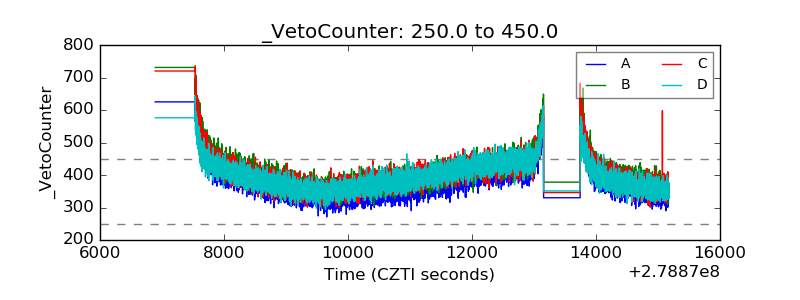 |