| Param | Original file | Final file |
|---|---|---|
| Filename | modeM0/AS1A05_202T01_9000002484_16751cztM0_level2.evt | modeM0/AS1A05_202T01_9000002484_16751cztM0_level2_quad_clean.evt |
| Size (bytes) | 666,305,280 | 124,197,120 |
| Size | 635.4 MB | 118.4 MB |
| Events in quadrant A | 3,518,942 | 840,819 |
| Events in quadrant B | 3,808,717 | 847,588 |
| Events in quadrant C | 3,656,820 | 812,775 |
| Events in quadrant D | 8,687,920 | 739,156 |
| Mode M0 | |||
|---|---|---|---|
| Quadrant | BADHDUFLAG | Total packets | Discarded packets |
| A | 0 | 15621 | 3 |
| B | 0 | 16234 | 2 |
| C | 0 | 15736 | 2 |
| D | 0 | 31132 | 2 |
| Mode M9 | |||
|---|---|---|---|
| Quadrant | BADHDUFLAG | Total packets | Discarded packets |
| A | 0 | 3 | 0 |
| B | 0 | 3 | 0 |
| C | 0 | 3 | 0 |
| D | 0 | 3 | 0 |
| Mode SS | |||
|---|---|---|---|
| Quadrant | BADHDUFLAG | Total packets | Discarded packets |
| A | 0 | 152 | 0 |
| B | 0 | 152 | 0 |
| C | 0 | 152 | 0 |
| D | 0 | 152 | 0 |
| Quadrant | Total seconds | Saturated seconds | Saturation percentage |
|---|---|---|---|
| A | 7487 | 46 | 0.614398% |
| B | 7487 | 89 | 1.188727% |
| C | 7487 | 58 | 0.774676% |
| D | 7487 | 1101 | 14.705490% |
Noise dominated data is calculated using 1-second bins in cleaned event files. If a bin has >2000 counts, and if more than 50% of those come from <1% of pixels, then it is considered to be noise-dominated and hence unusable.
| Quadrant | # 1 sec bins | Bins with >0 counts | Bins with >2000 counts | High rate bins dominated by noise | Noise dominated (total time) | Noise dominated (detector-on time) | Marked lightcurve |
|---|---|---|---|---|---|---|---|
| A | 7758 | 7489 | 22 | 22 | 0.28% | 0.29% | 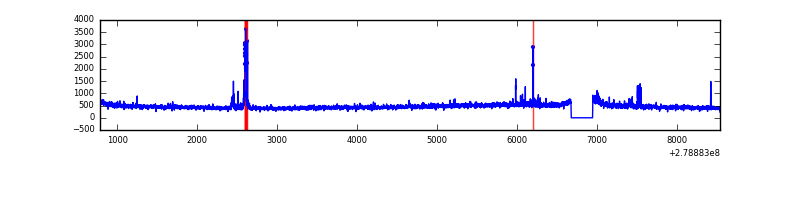 |
| B | 7758 | 7489 | 15 | 15 | 0.19% | 0.20% | 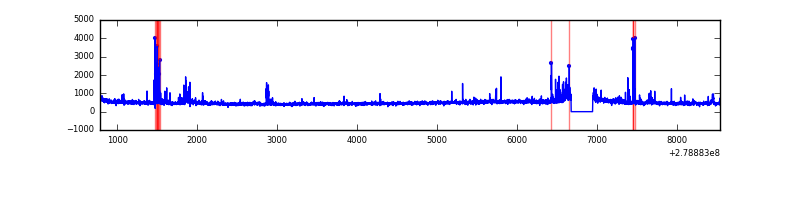 |
| C | 7758 | 7489 | 4 | 4 | 0.05% | 0.05% | 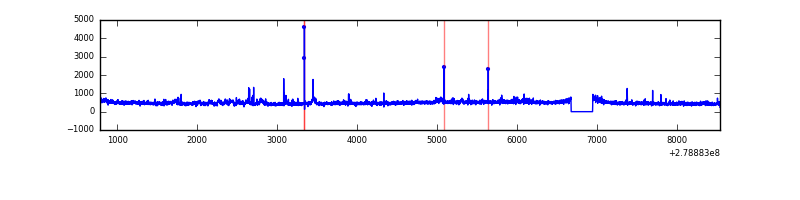 |
| D | 7758 | 7489 | 878 | 878 | 11.32% | 11.72% | 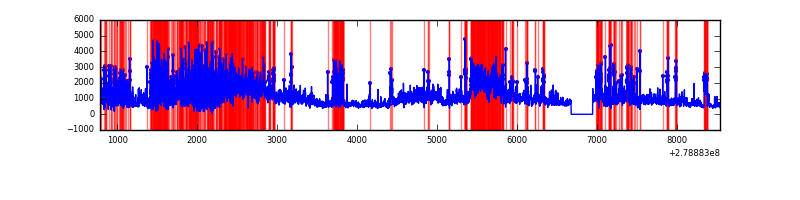 |
Top three noisy pixels from each quadrant. If the there are fewer than three noisy pixels in the level2.evt file, extra rows are filled as -1
| Pixel properties | Quadrant properties | ||||||
|---|---|---|---|---|---|---|---|
| Quadrant | DetID | PixID | Counts | Sigma | Mean | Median | Sigma |
| A | 15 | 174 | 116218 | 648.7 | 875 | 857 | 177.8 |
| A | 3 | 1 | 39507 | 217.34 | 875 | 857 | 177.8 |
| A | 0 | 226 | 7800 | 39.04 | 875 | 857 | 177.8 |
| B | 15 | 35 | 115882 | 692.74 | 880 | 857 | 166.0 |
| B | 7 | 220 | 54040 | 320.3 | 880 | 857 | 166.0 |
| B | 0 | 197 | 50213 | 297.25 | 880 | 857 | 166.0 |
| C | 3 | 233 | 166250 | 853.92 | 836 | 842 | 193.7 |
| C | 14 | 238 | 131075 | 672.33 | 836 | 842 | 193.7 |
| C | 0 | 207 | 94940 | 485.78 | 836 | 842 | 193.7 |
| D | 1 | 52 | 5230335 | 27275.19 | 798 | 776 | 191.7 |
| D | 2 | 16 | 175424 | 910.89 | 798 | 776 | 191.7 |
| D | 11 | 176 | 91502 | 473.19 | 798 | 776 | 191.7 |
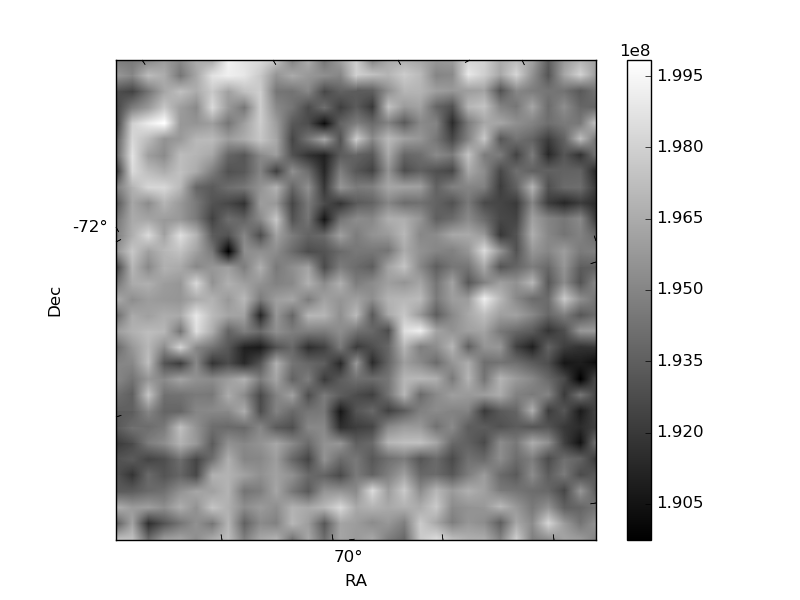
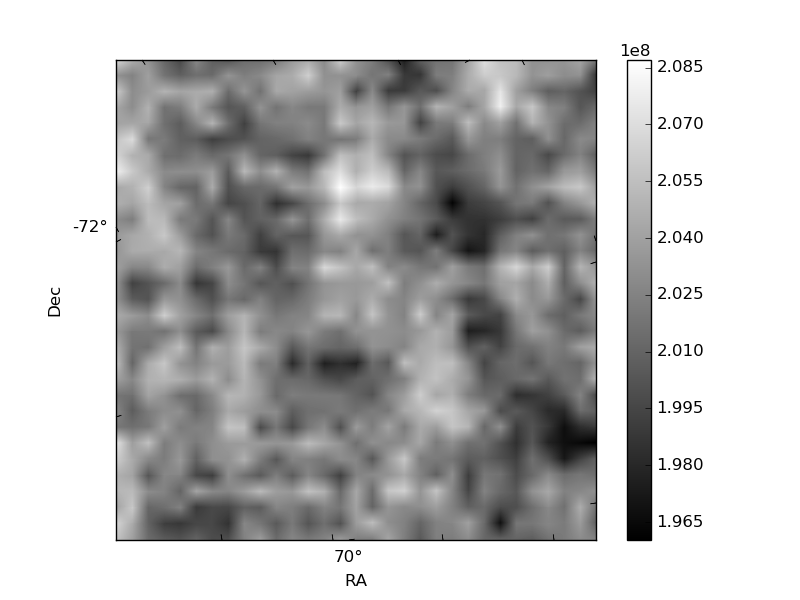
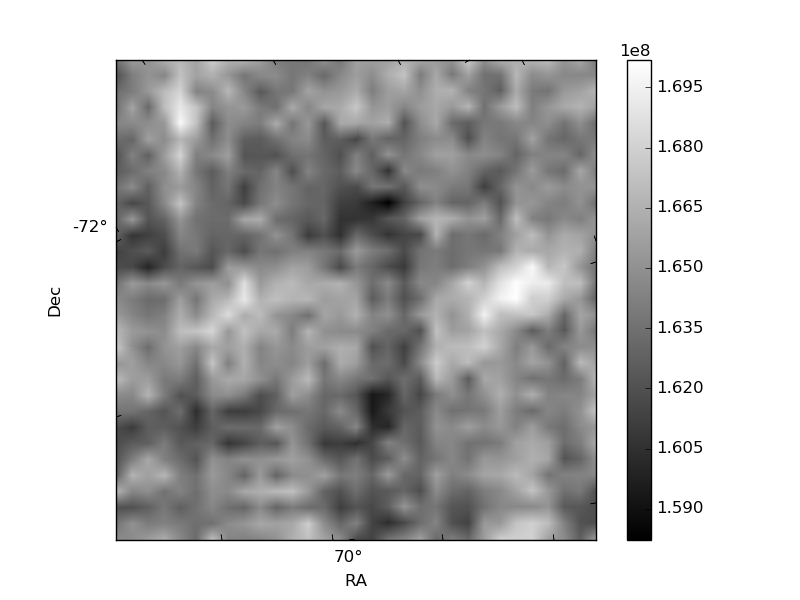
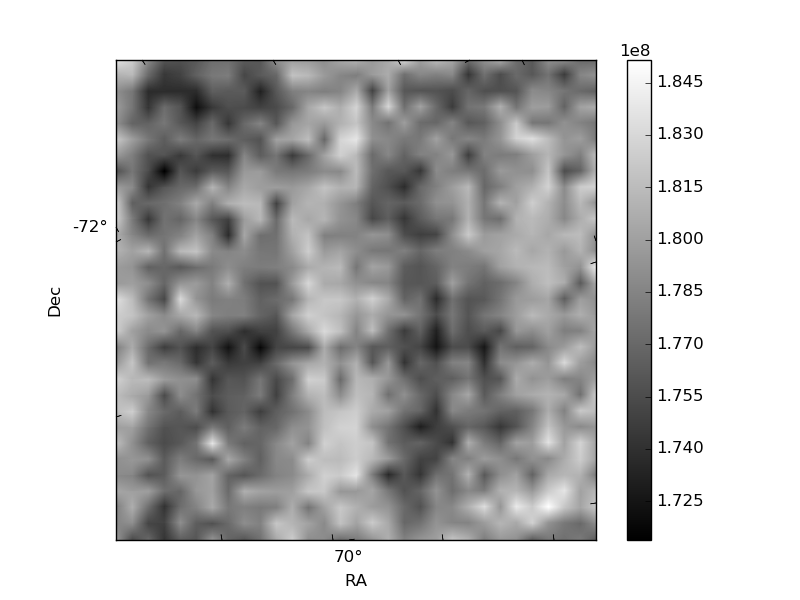
Histogram calculated using DETX and DETY for each event in the final _common_clean file
| Quadrant A | 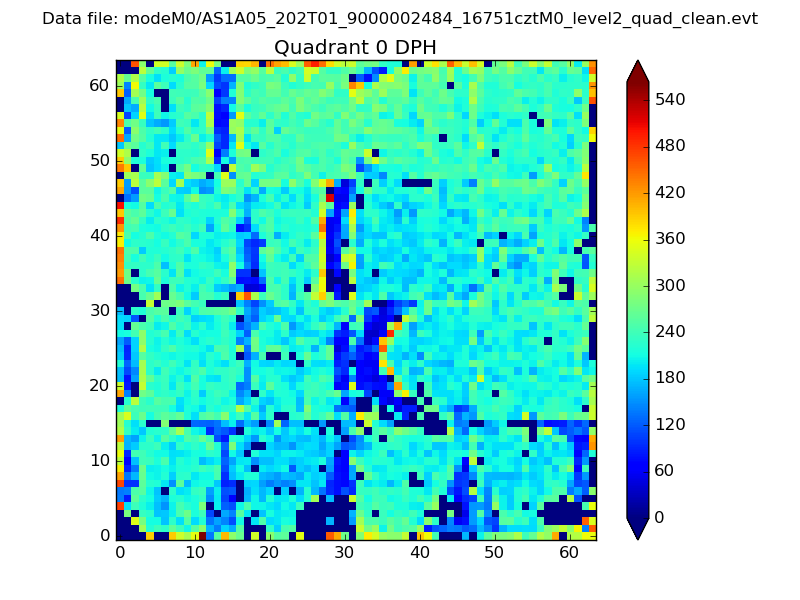 |
 |
Quadrant B |
|---|---|---|---|
| Quadrant D | 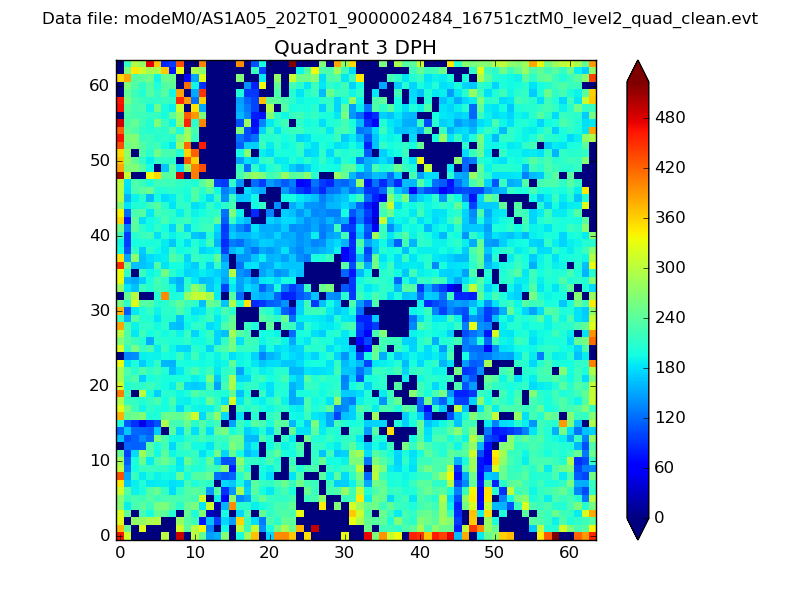 |
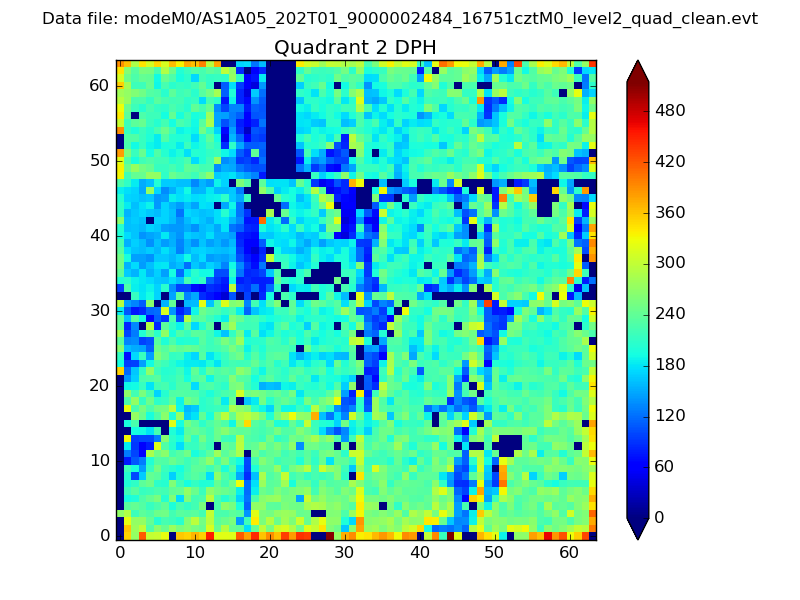 |
Quadrant C |
| Plot type | Count rate plots | Images |
|---|---|---|
| Comparison with Poisson distribution Blue bars denote a histogram of data divided into 1 sec bins. Red curve is a Poisson curve with rate = median count rate of data. |
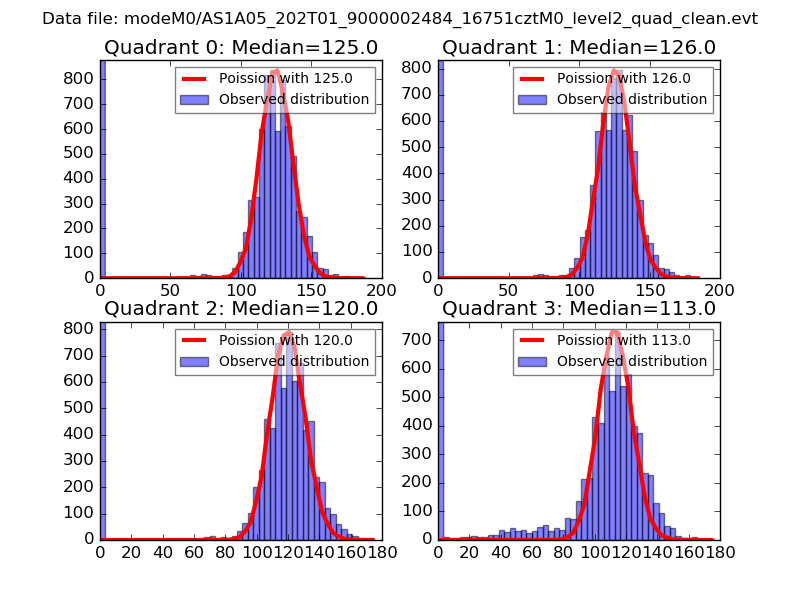 |
 |
| Quadrant-wise count rates Data is divided into 100 sec bins |
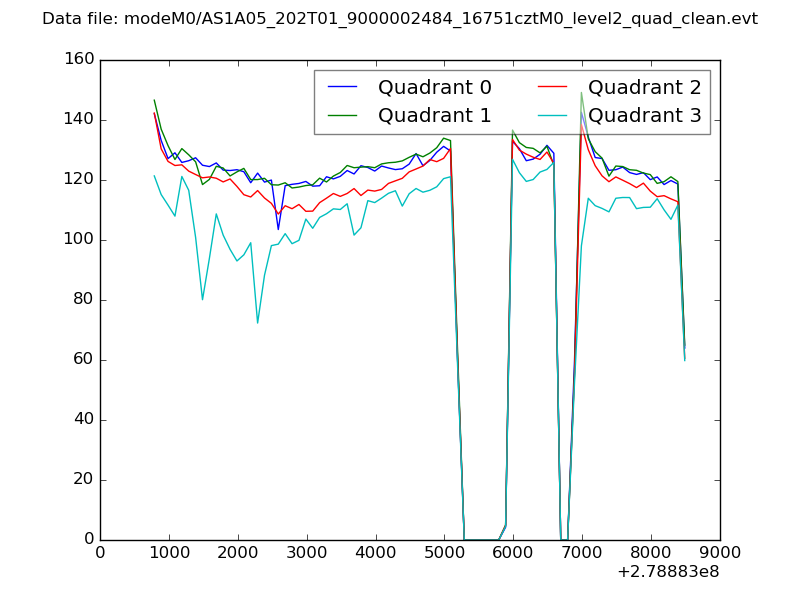 |
|
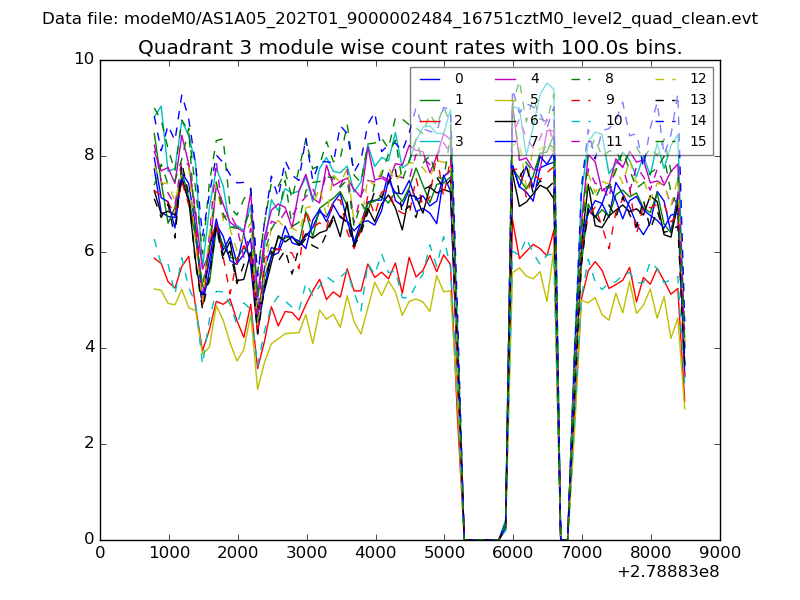
| Module-wise count rates for Quadrant A Data is divided into 100 sec bins |
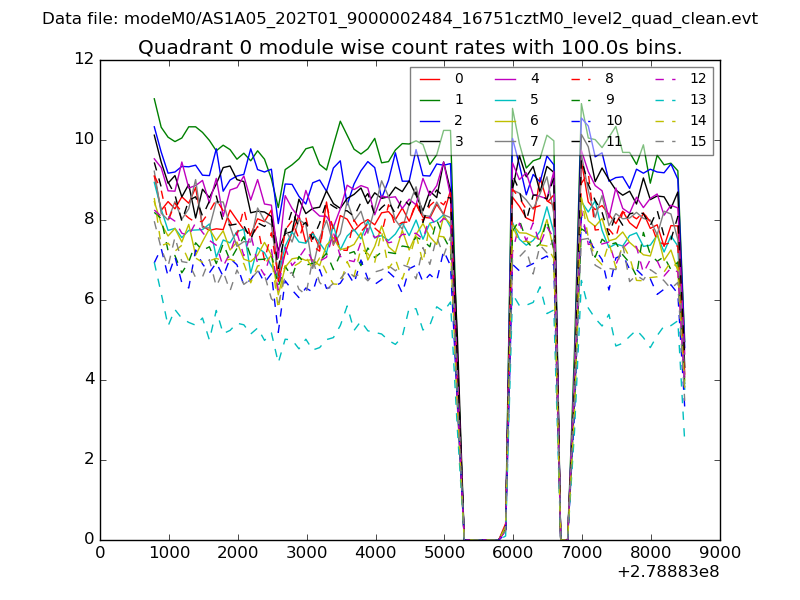 |
 |
| Module-wise count rates for Quadrant B Data is divided into 100 sec bins |
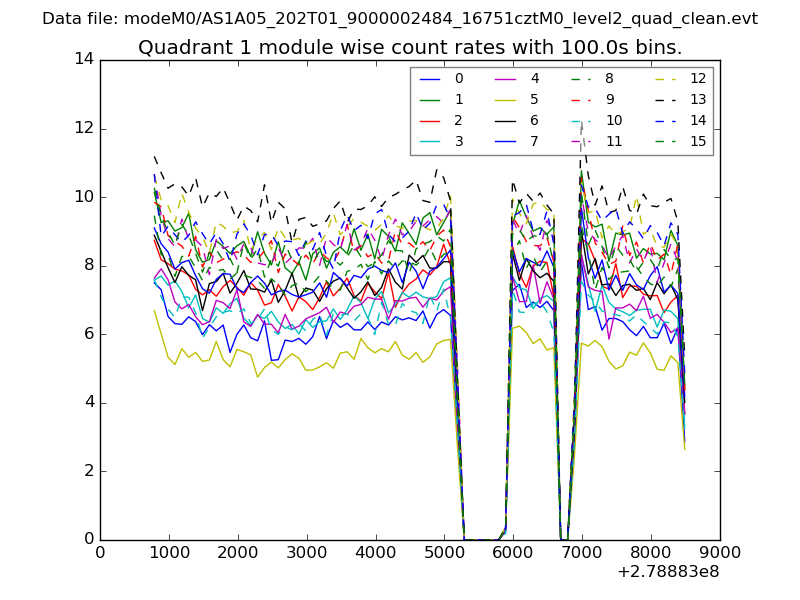 |
 |
| Module-wise count rates for Quadrant C Data is divided into 100 sec bins |
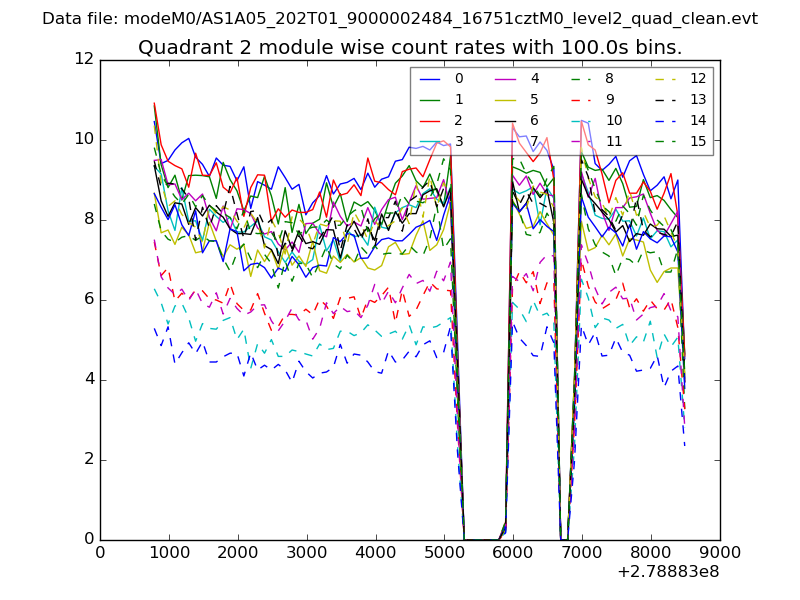 |
 |
| Module-wise count rates for Quadrant D Data is divided into 100 sec bins |
 |
 |
| Parameter | Plot |
|---|---|
| CZT HV Monitor | 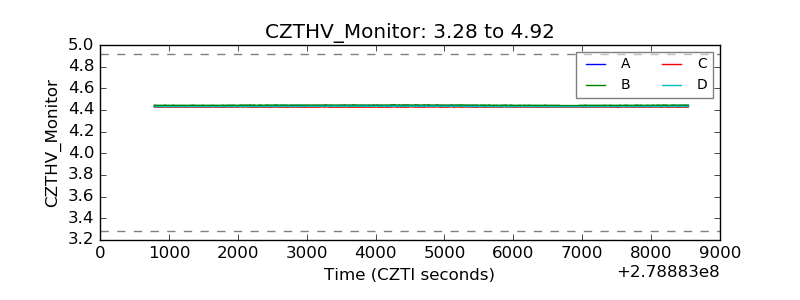 |
| D_VDD | 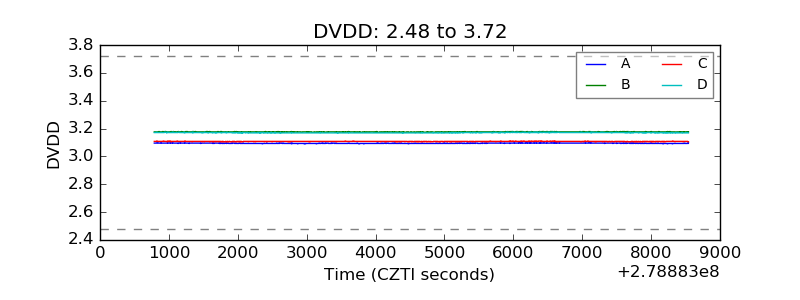 |
| Temperature 1 | 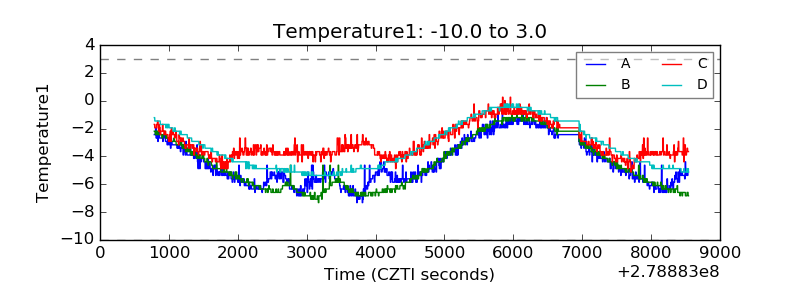 |
| Veto HV Monitor |  |
| Veto LLD | 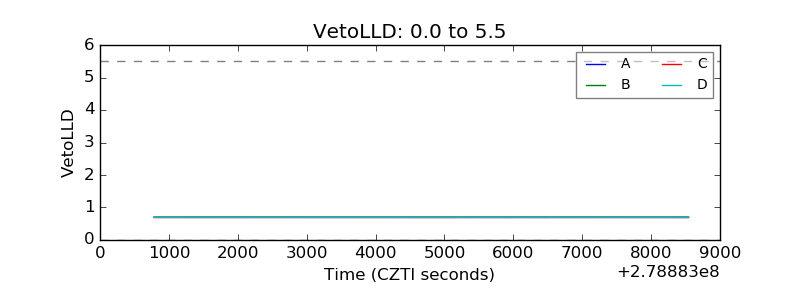 |
| Alpha Counter | 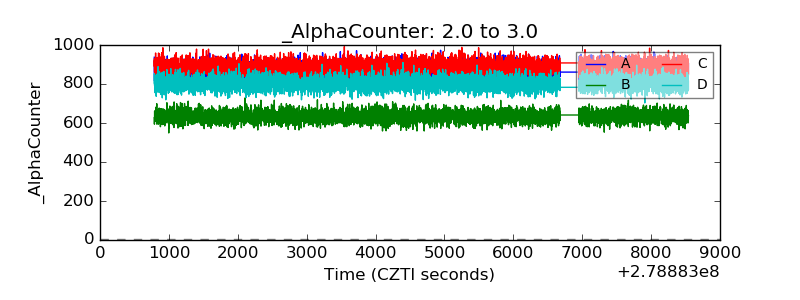 |
| _CPM_Rate | 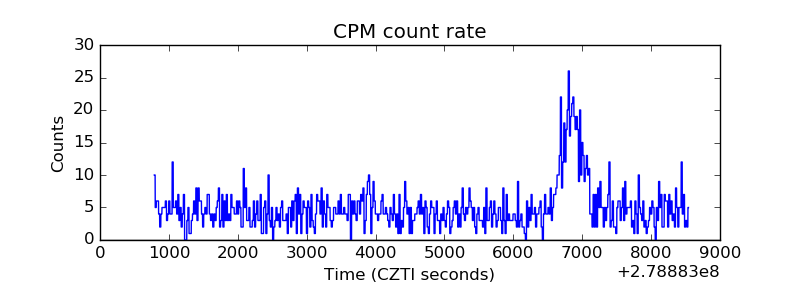 |
| CZT Counter |  |
| +2.5 Volts monitor |  |
| +5 Volts monitor | 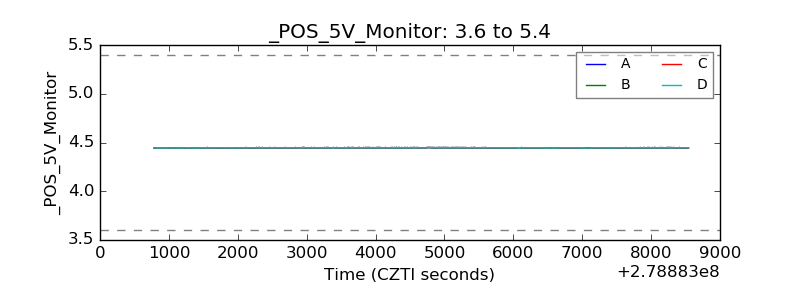 |
| _ROLL_ROT | 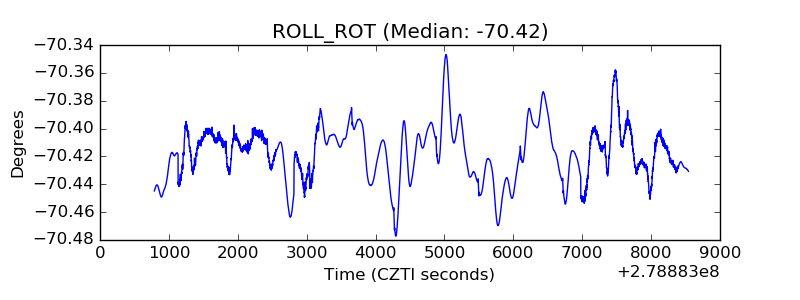 |
| _Roll_DEC | 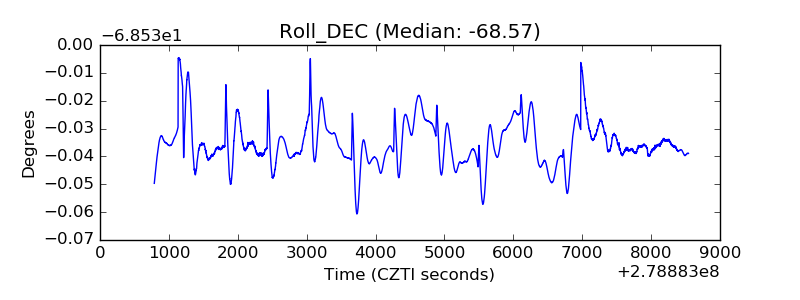 |
| _Roll_RA |  |
| Veto Counter | 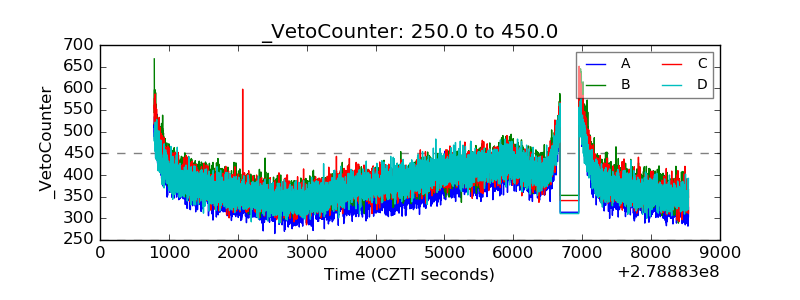 |