| Param | Original file | Final file |
|---|---|---|
| Filename | modeM0/AS1A05_202T01_9000002484_16755cztM0_level2.evt | modeM0/AS1A05_202T01_9000002484_16755cztM0_level2_quad_clean.evt |
| Size (bytes) | 490,584,960 | 102,648,960 |
| Size | 467.9 MB | 97.9 MB |
| Events in quadrant A | 2,921,147 | 682,940 |
| Events in quadrant B | 3,257,027 | 689,194 |
| Events in quadrant C | 3,365,426 | 660,155 |
| Events in quadrant D | 4,885,318 | 635,776 |
| Mode M0 | |||
|---|---|---|---|
| Quadrant | BADHDUFLAG | Total packets | Discarded packets |
| A | 0 | 12961 | 1 |
| B | 0 | 13897 | 1 |
| C | 0 | 14157 | 1 |
| D | 0 | 18818 | 1 |
| Mode M9 | |||
|---|---|---|---|
| Quadrant | BADHDUFLAG | Total packets | Discarded packets |
| A | 0 | 2 | 0 |
| B | 0 | 2 | 0 |
| C | 0 | 2 | 0 |
| D | 0 | 2 | 0 |
| Mode SS | |||
|---|---|---|---|
| Quadrant | BADHDUFLAG | Total packets | Discarded packets |
| A | 0 | 128 | 0 |
| B | 0 | 128 | 0 |
| C | 0 | 128 | 0 |
| D | 0 | 128 | 0 |
| Quadrant | Total seconds | Saturated seconds | Saturation percentage |
|---|---|---|---|
| A | 6315 | 33 | 0.522565% |
| B | 6315 | 113 | 1.789390% |
| C | 6315 | 81 | 1.282660% |
| D | 6315 | 277 | 4.386382% |
Noise dominated data is calculated using 1-second bins in cleaned event files. If a bin has >2000 counts, and if more than 50% of those come from <1% of pixels, then it is considered to be noise-dominated and hence unusable.
| Quadrant | # 1 sec bins | Bins with >0 counts | Bins with >2000 counts | High rate bins dominated by noise | Noise dominated (total time) | Noise dominated (detector-on time) | Marked lightcurve |
|---|---|---|---|---|---|---|---|
| A | 6556 | 6317 | 5 | 5 | 0.08% | 0.08% | 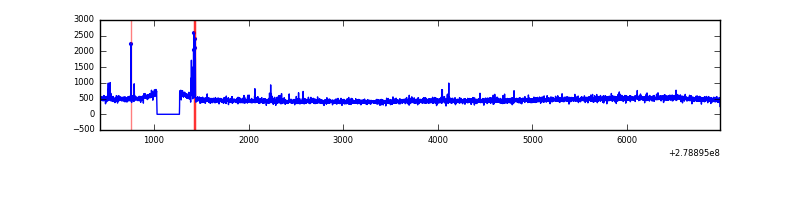 |
| B | 6556 | 6317 | 15 | 15 | 0.23% | 0.24% | 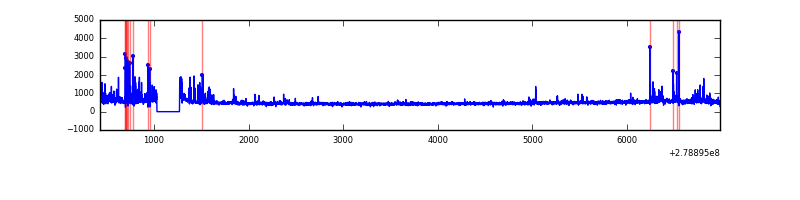 |
| C | 6556 | 6317 | 1 | 1 | 0.02% | 0.02% | 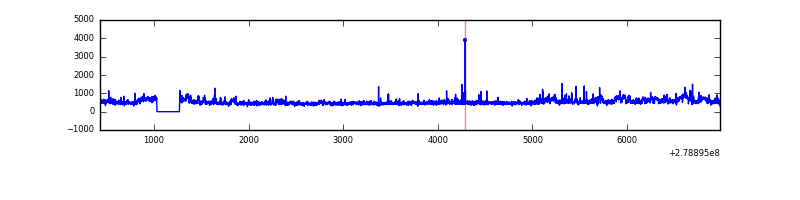 |
| D | 6556 | 6317 | 186 | 186 | 2.84% | 2.94% | 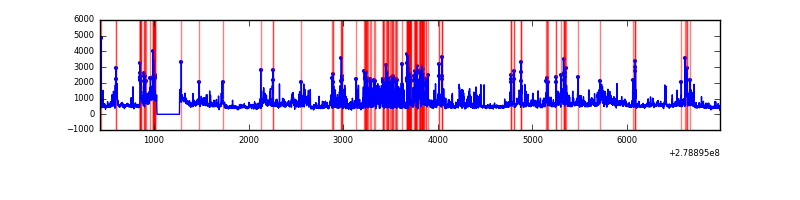 |
Top three noisy pixels from each quadrant. If the there are fewer than three noisy pixels in the level2.evt file, extra rows are filled as -1
| Pixel properties | Quadrant properties | ||||||
|---|---|---|---|---|---|---|---|
| Quadrant | DetID | PixID | Counts | Sigma | Mean | Median | Sigma |
| A | 15 | 174 | 41109 | 267.68 | 744 | 726 | 150.9 |
| A | 3 | 1 | 23599 | 151.62 | 744 | 726 | 150.9 |
| A | 0 | 226 | 6603 | 38.96 | 744 | 726 | 150.9 |
| B | 10 | 16 | 159387 | 1112.0 | 742 | 724 | 142.7 |
| B | 15 | 35 | 61233 | 424.08 | 742 | 724 | 142.7 |
| B | 0 | 189 | 43958 | 303.01 | 742 | 724 | 142.7 |
| C | 3 | 233 | 325006 | 1953.54 | 711 | 714 | 166.0 |
| C | 0 | 207 | 154578 | 926.88 | 711 | 714 | 166.0 |
| C | 14 | 238 | 108171 | 647.32 | 711 | 714 | 166.0 |
| D | 1 | 52 | 1655872 | 9419.85 | 711 | 685 | 175.7 |
| D | 11 | 176 | 410659 | 2333.21 | 711 | 685 | 175.7 |
| D | 2 | 33 | 55417 | 311.49 | 711 | 685 | 175.7 |
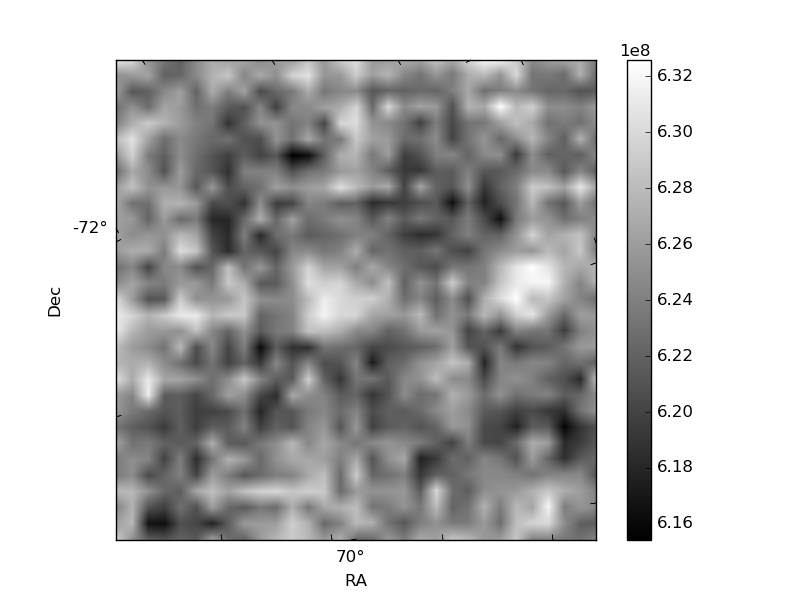
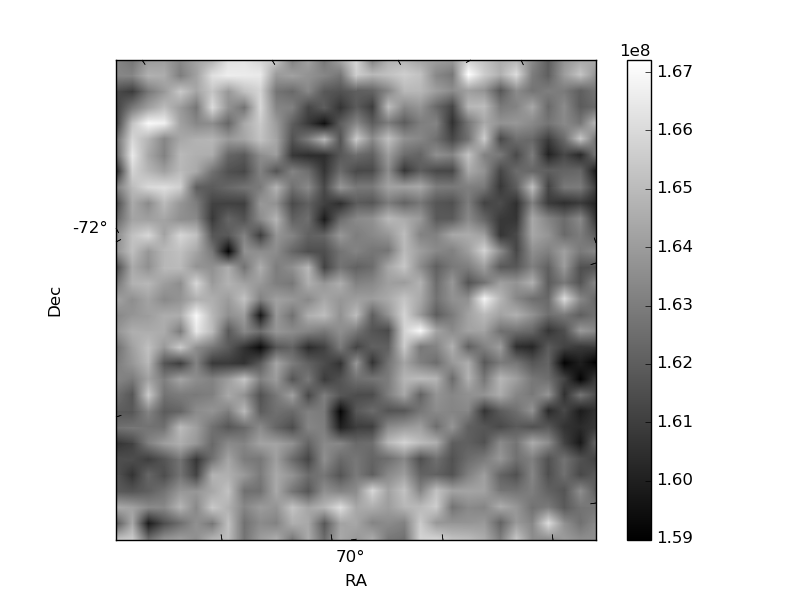
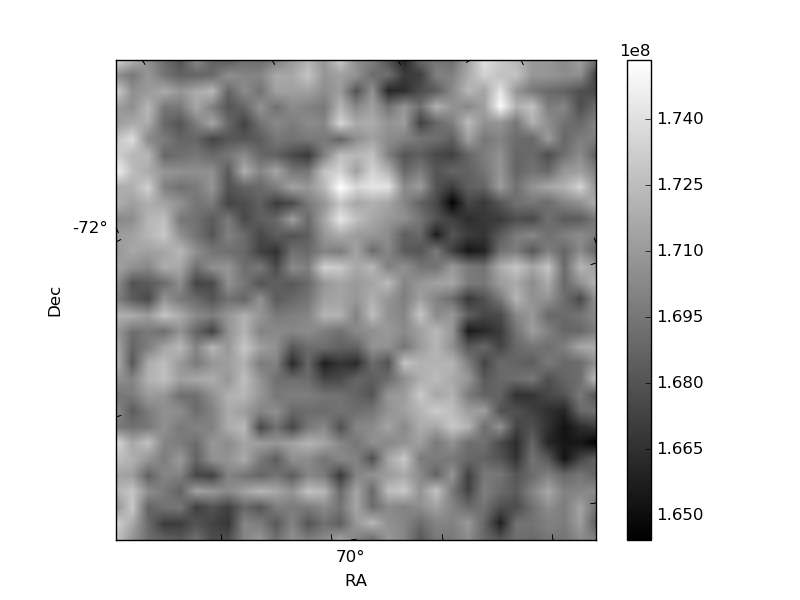
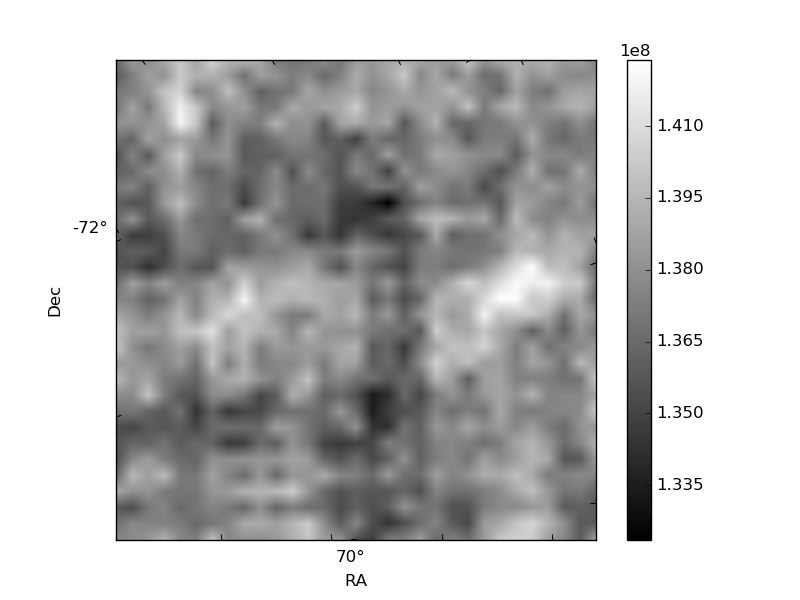
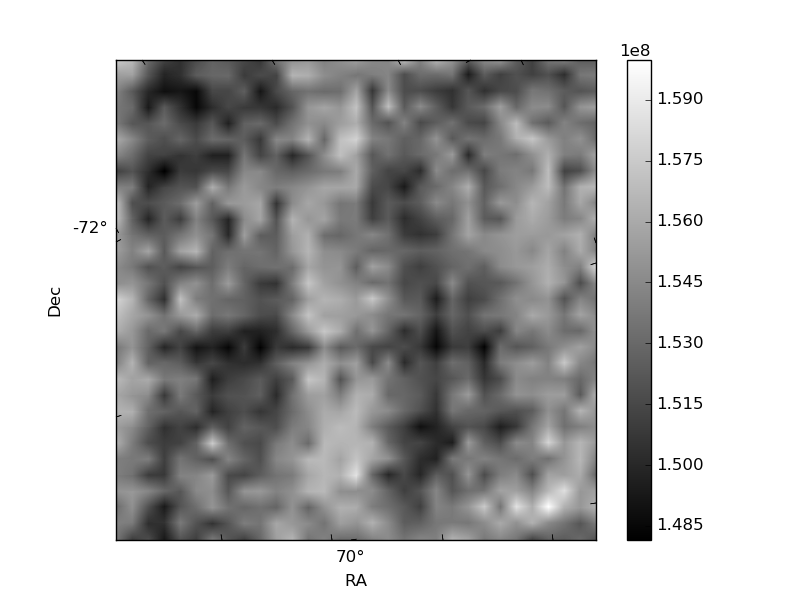
Histogram calculated using DETX and DETY for each event in the final _common_clean file
| Quadrant A | 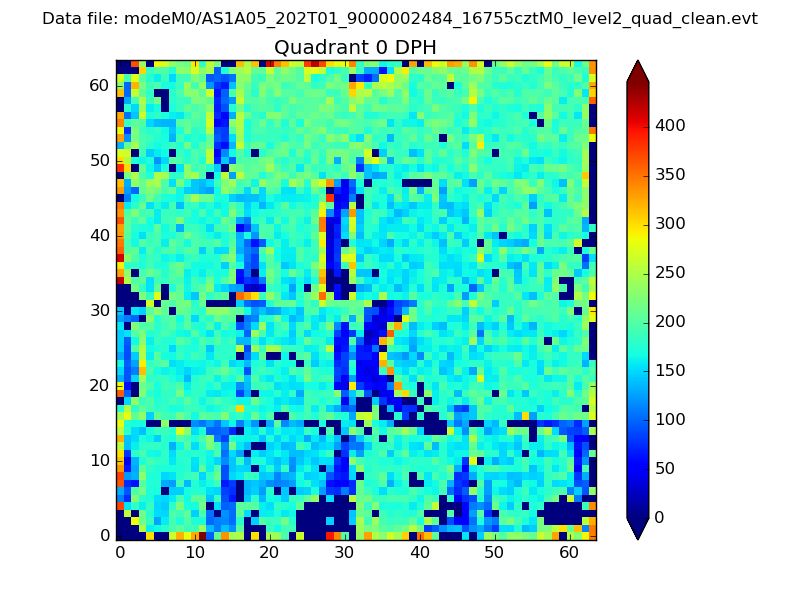 |
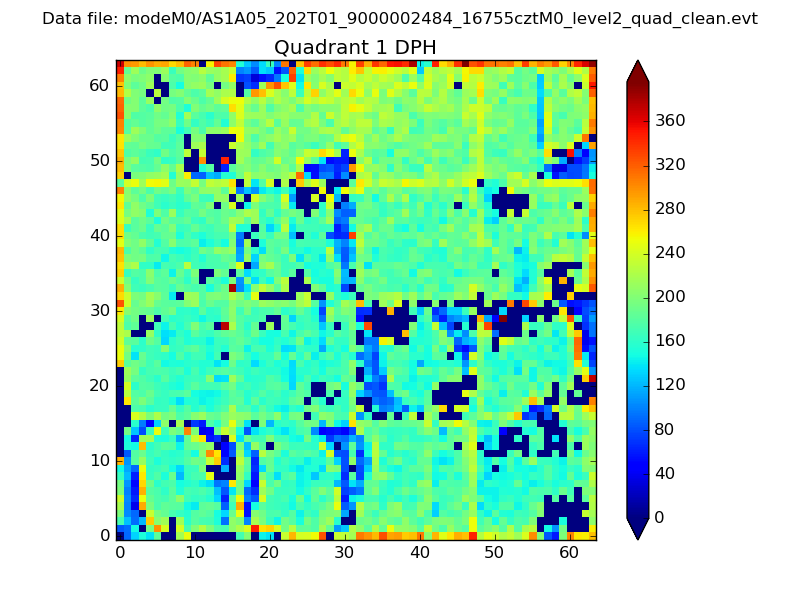 |
Quadrant B |
|---|---|---|---|
| Quadrant D | 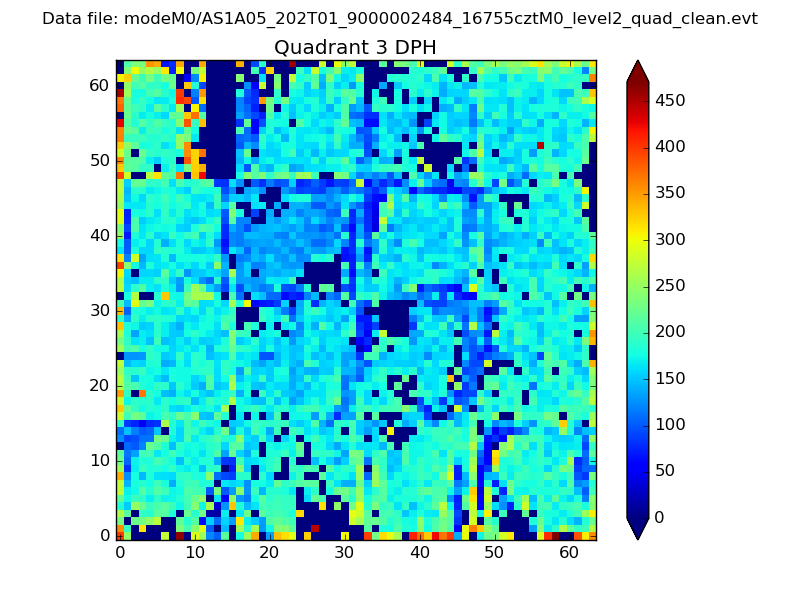 |
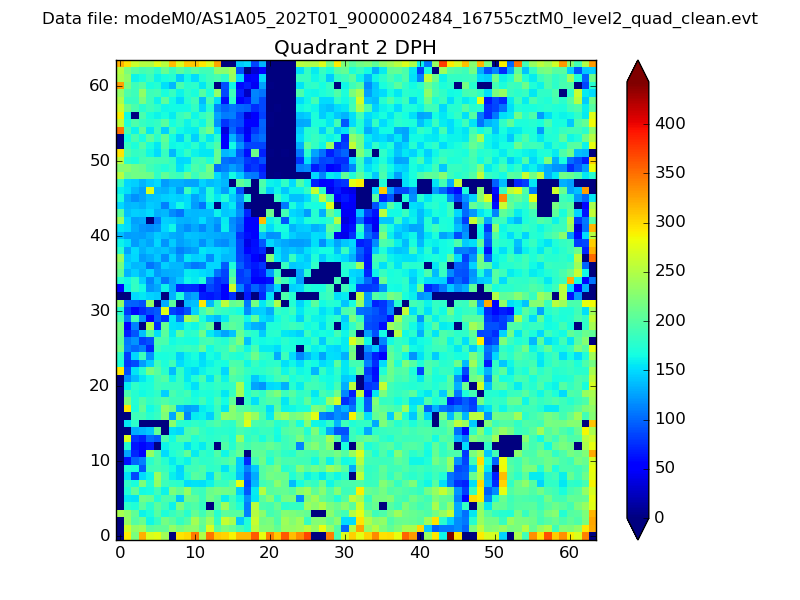 |
Quadrant C |
| Plot type | Count rate plots | Images |
|---|---|---|
| Comparison with Poisson distribution Blue bars denote a histogram of data divided into 1 sec bins. Red curve is a Poisson curve with rate = median count rate of data. |
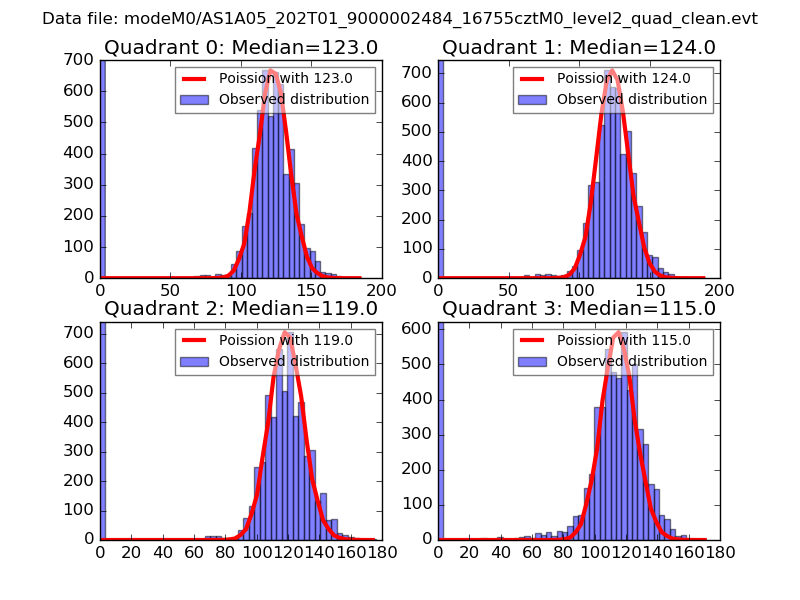 |
 |
| Quadrant-wise count rates Data is divided into 100 sec bins |
 |
|
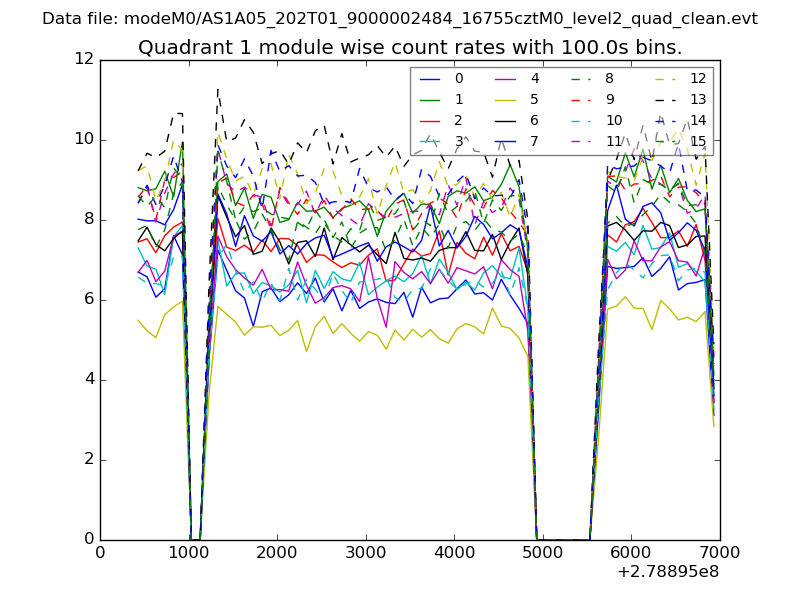
| Module-wise count rates for Quadrant A Data is divided into 100 sec bins |
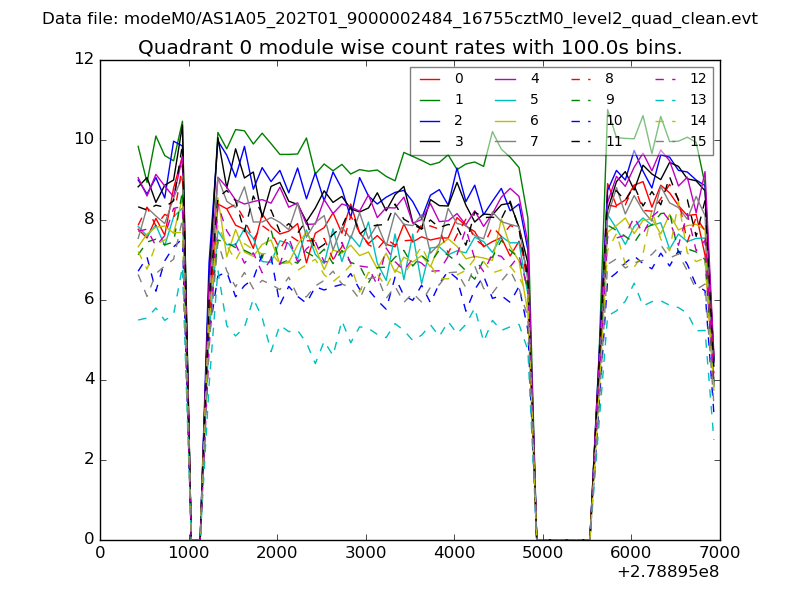 |
 |
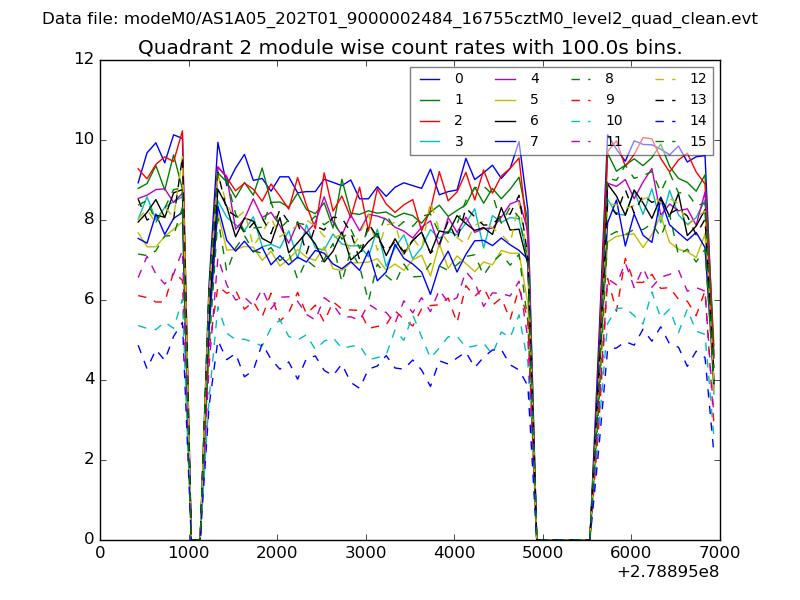
| Module-wise count rates for Quadrant B Data is divided into 100 sec bins |
 |
 |
| Module-wise count rates for Quadrant C Data is divided into 100 sec bins |
 |
 |
| Module-wise count rates for Quadrant D Data is divided into 100 sec bins |
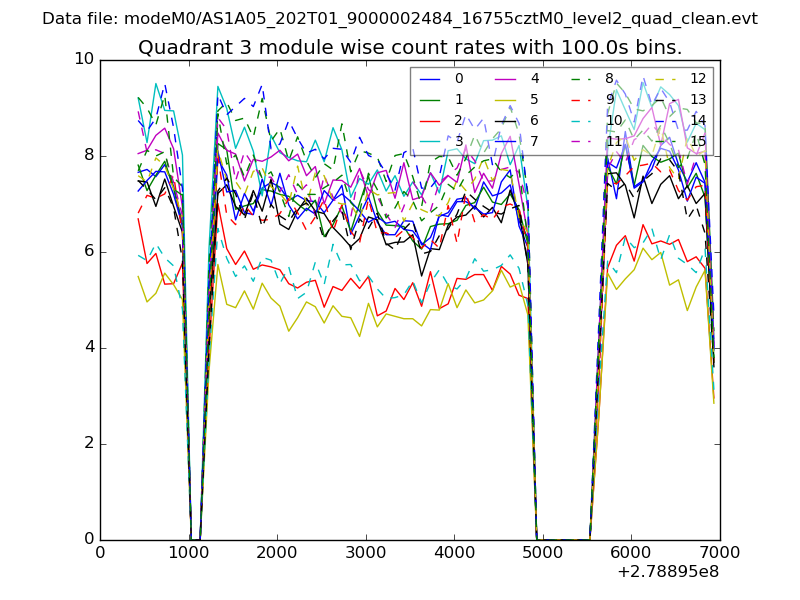 |
 |
| Parameter | Plot |
|---|---|
| CZT HV Monitor | 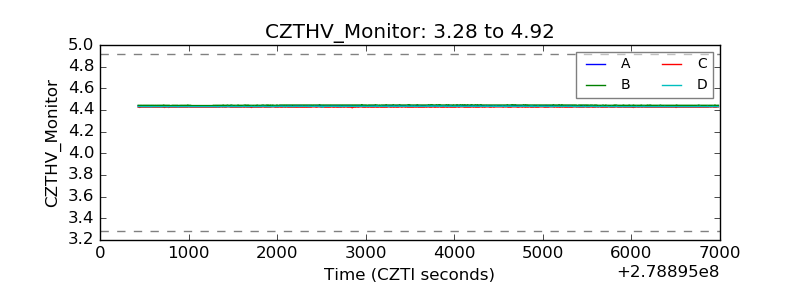 |
| D_VDD | 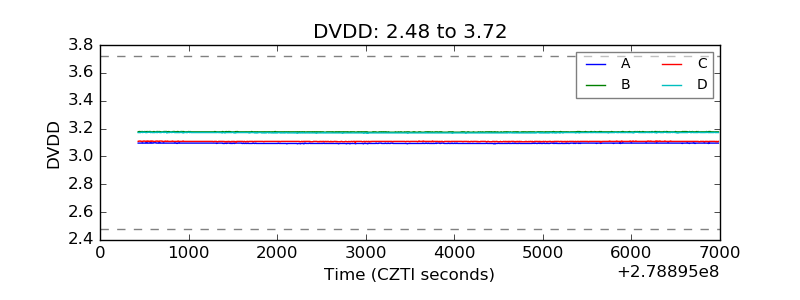 |
| Temperature 1 | 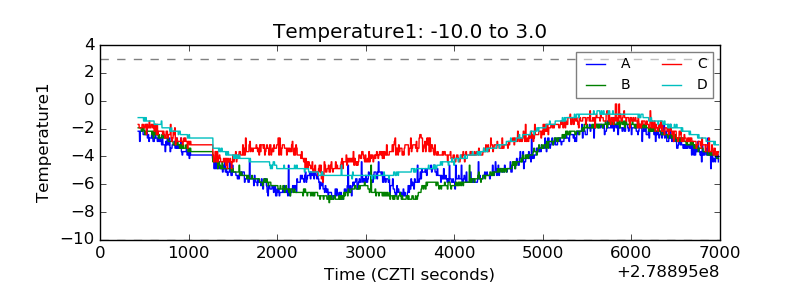 |
| Veto HV Monitor |  |
| Veto LLD | 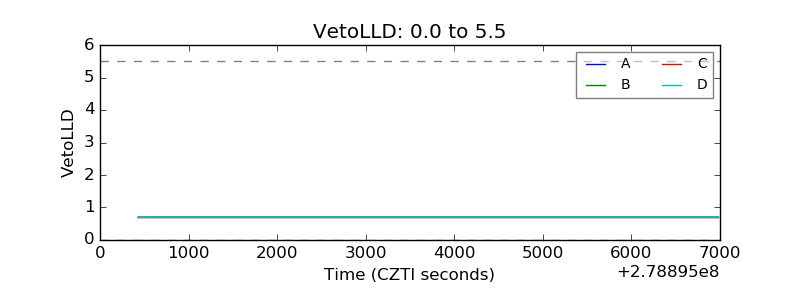 |
| Alpha Counter |  |
| _CPM_Rate | 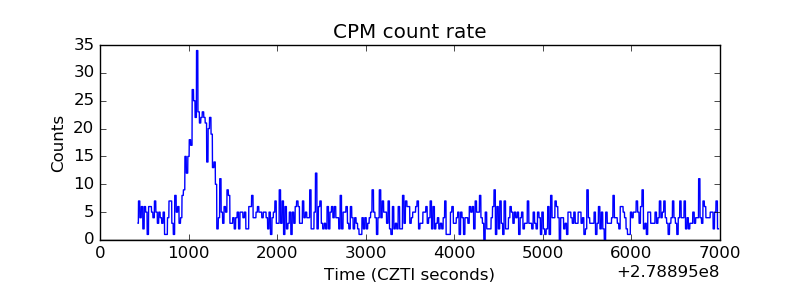 |
| CZT Counter | 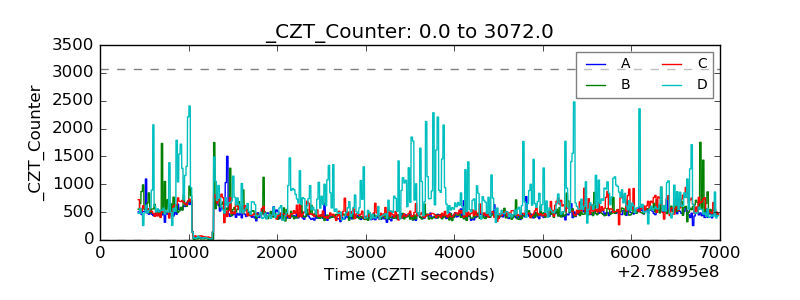 |
| +2.5 Volts monitor | 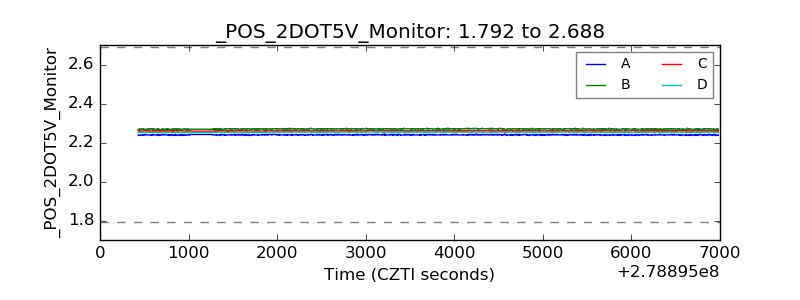 |
| +5 Volts monitor |  |
| _ROLL_ROT | 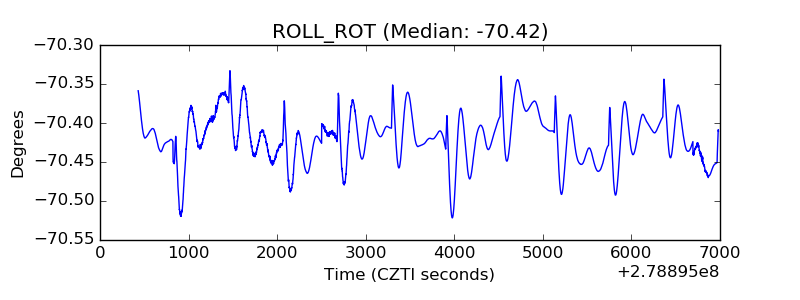 |
| _Roll_DEC | 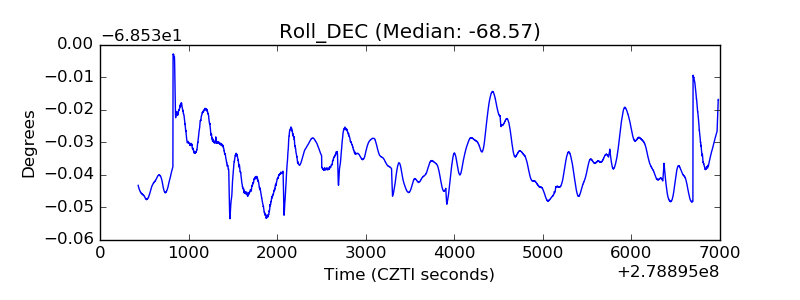 |
| _Roll_RA | 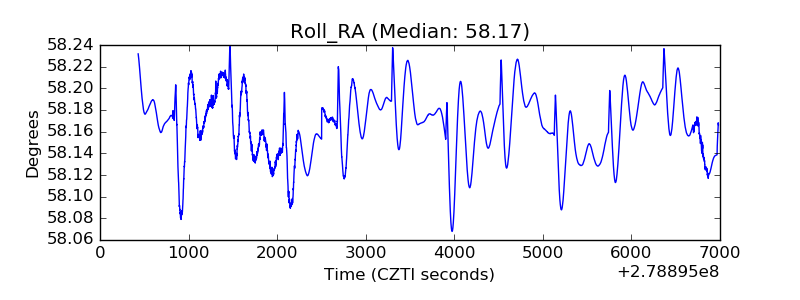 |
| Veto Counter | 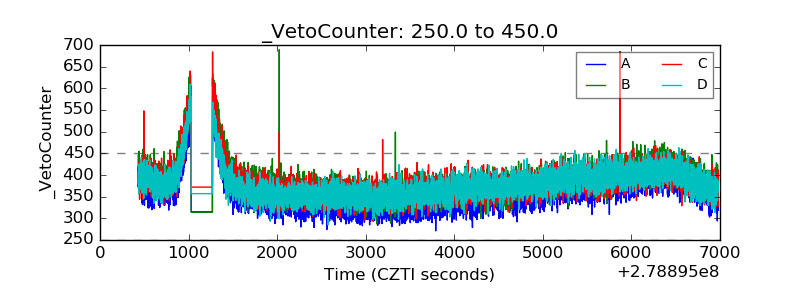 |