| Param | Original file | Final file |
|---|---|---|
| Filename | modeM0/AS1A05_004T05_9000002488cztM0_level2.fits | modeM0/AS1A05_004T05_9000002488cztM0_level2_quad_clean.evt |
| Size (bytes) | 533,969,280 | 476,616,960 |
| Size | 509.2 MB | 454.5 MB |
| Events in quadrant A | 3,334,412 | 2,827,094 |
| Events in quadrant B | 3,204,128 | 2,878,131 |
| Events in quadrant C | 3,214,890 | 2,732,626 |
| Events in quadrant D | 2,626,518 | 2,208,846 |
| Mode SS | |||
|---|---|---|---|
| Quadrant | BADHDUFLAG | Total packets | Discarded packets |
| A | 0 | 1124 | 0 |
| B | 0 | 1124 | 0 |
| C | 0 | 1124 | 0 |
| D | 0 | 1124 | 0 |
| Mode M9 | |||
|---|---|---|---|
| Quadrant | BADHDUFLAG | Total packets | Discarded packets |
| A | 0 | 93 | 0 |
| B | 0 | 93 | 0 |
| C | 0 | 93 | 0 |
| D | 0 | 94 | 0 |
| Mode M0 | |||
|---|---|---|---|
| Quadrant | BADHDUFLAG | Total packets | Discarded packets |
| A | 0 | 128314 | 0 |
| B | 0 | 122760 | 0 |
| C | 0 | 157990 | 0 |
| D | 0 | 200390 | 0 |
| Quadrant | Total seconds | Saturated seconds | Saturation percentage |
|---|---|---|---|
| A | 55186 | 2094 | 3.794441% |
| B | 55186 | 893 | 1.618164% |
| C | 55185 | 2004 | 3.631422% |
| D | 55182 | 9129 | 16.543438% |
Noise dominated data is calculated using 1-second bins in cleaned event files. If a bin has >2000 counts, and if more than 50% of those come from <1% of pixels, then it is considered to be noise-dominated and hence unusable.
| Quadrant | # 1 sec bins | Bins with >0 counts | Bins with >2000 counts | High rate bins dominated by noise | Noise dominated (total time) | Noise dominated (detector-on time) | Marked lightcurve |
|---|---|---|---|---|---|---|---|
| A | 75104 | 55172 | 0 | 0 | 0.00% | 0.00% |  |
| B | 75104 | 55187 | 0 | 0 | 0.00% | 0.00% |  |
| C | 75104 | 55186 | 0 | 0 | 0.00% | 0.00% |  |
| D | 75104 | 55072 | 0 | 0 | 0.00% | 0.00% |  |
Top three noisy pixels from each quadrant. If the there are fewer than three noisy pixels in the level2.evt file, extra rows are filled as -1
| Pixel properties | Quadrant properties | ||||||
|---|---|---|---|---|---|---|---|
| Quadrant | DetID | PixID | Counts | Sigma | Mean | Median | Sigma |
| A | 0 | 29 | 2775 | 9.31 | 866 | 816 | 210.5 |
| A | 7 | 110 | 2688 | 8.89 | 866 | 816 | 210.5 |
| A | 15 | 236 | 2495 | 7.98 | 866 | 816 | 210.5 |
| B | 2 | 9 | 2643 | 11.08 | 846 | 808 | 165.6 |
| B | 2 | 8 | 2212 | 8.48 | 846 | 808 | 165.6 |
| B | 5 | 225 | 2132 | 8.0 | 846 | 808 | 165.6 |
| C | 1 | 81 | 2481 | 7.69 | 848 | 791 | 219.7 |
| C | 1 | 80 | 2461 | 7.6 | 848 | 791 | 219.7 |
| C | 12 | 241 | 2266 | 6.71 | 848 | 791 | 219.7 |
| D | 6 | 231 | 1938 | 6.25 | 749 | 682 | 200.8 |
| D | 7 | 3 | 1850 | 5.82 | 749 | 682 | 200.8 |
| D | 3 | 14 | 1828 | 5.71 | 749 | 682 | 200.8 |
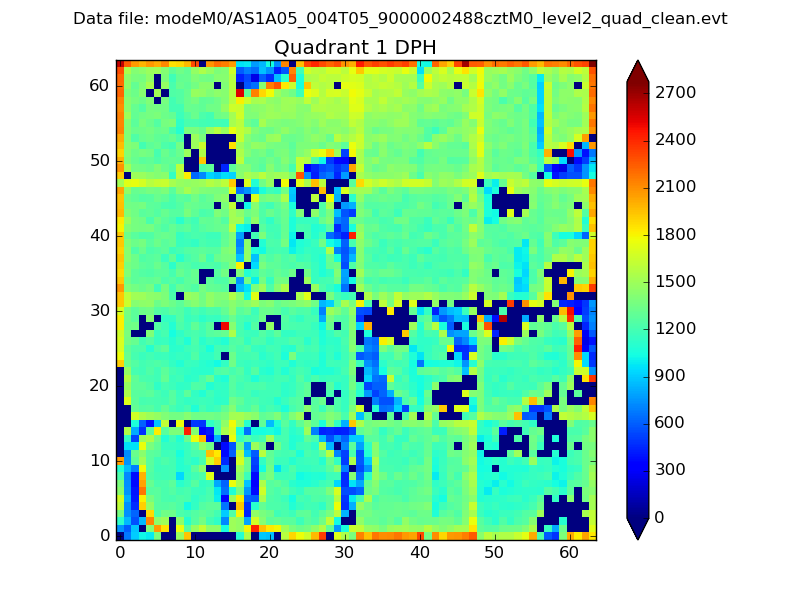
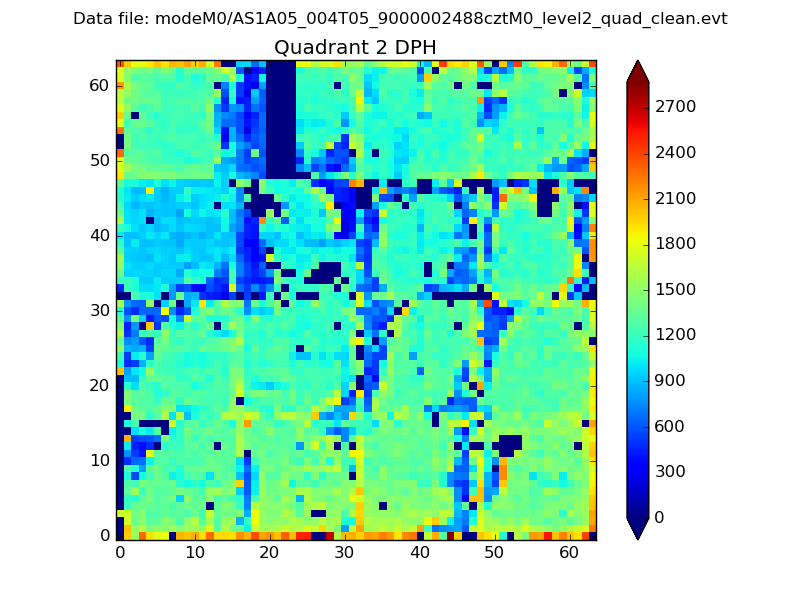
Histogram calculated using DETX and DETY for each event in the final _common_clean file
| Quadrant A |  |
 |
Quadrant B |
|---|---|---|---|
| Quadrant D |  |
 |
Quadrant C |
| Plot type | Count rate plots | Images |
|---|---|---|
| Comparison with Poisson distribution Blue bars denote a histogram of data divided into 1 sec bins. Red curve is a Poisson curve with rate = median count rate of data. |
 |
 |
| Quadrant-wise count rates Data is divided into 100 sec bins |
 |
|
| Module-wise count rates for Quadrant A Data is divided into 100 sec bins |
 |
 |
| Module-wise count rates for Quadrant B Data is divided into 100 sec bins |
 |
 |
| Module-wise count rates for Quadrant C Data is divided into 100 sec bins |
 |
 |
| Module-wise count rates for Quadrant D Data is divided into 100 sec bins |
 |
 |
| Parameter | Plot |
|---|---|
| CZT HV Monitor |  |
| D_VDD |  |
| Temperature 1 |  |
| Veto HV Monitor |  |
| Veto LLD |  |
| Alpha Counter |  |
| _CPM_Rate |  |
| CZT Counter |  |
| +2.5 Volts monitor |  |
| +5 Volts monitor |  |
| _ROLL_ROT |  |
| _Roll_DEC |  |
| _Roll_RA | 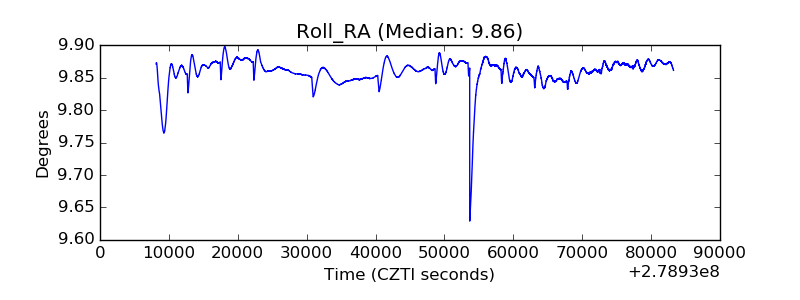 |
| Veto Counter |  |