| Param | Original file | Final file |
|---|---|---|
| Filename | modeM0/AS1A05_004T05_9000002488_16760cztM0_level2.evt | modeM0/AS1A05_004T05_9000002488_16760cztM0_level2_quad_clean.evt |
| Size (bytes) | 267,125,760 | 29,600,640 |
| Size | 254.8 MB | 28.2 MB |
| Events in quadrant A | 1,803,527 | 191,167 |
| Events in quadrant B | 1,336,562 | 195,106 |
| Events in quadrant C | 1,341,565 | 187,865 |
| Events in quadrant D | 3,456,964 | 161,932 |
| Mode SS | |||
|---|---|---|---|
| Quadrant | BADHDUFLAG | Total packets | Discarded packets |
| A | 0 | 46 | 0 |
| B | 0 | 46 | 0 |
| C | 0 | 46 | 0 |
| D | 0 | 46 | 0 |
| Mode M9 | |||
|---|---|---|---|
| Quadrant | BADHDUFLAG | Total packets | Discarded packets |
| A | 0 | 13 | 0 |
| B | 0 | 13 | 0 |
| C | 0 | 13 | 0 |
| D | 0 | 13 | 0 |
| Mode M0 | |||
|---|---|---|---|
| Quadrant | BADHDUFLAG | Total packets | Discarded packets |
| A | 0 | 6846 | 4 |
| B | 0 | 5502 | 3 |
| C | 0 | 5530 | 5 |
| D | 0 | 11844 | 38 |
| Quadrant | Total seconds | Saturated seconds | Saturation percentage |
|---|---|---|---|
| A | 2209 | 248 | 11.226799% |
| B | 2209 | 101 | 4.572205% |
| C | 2208 | 105 | 4.755435% |
| D | 2205 | 618 | 28.027211% |
Noise dominated data is calculated using 1-second bins in cleaned event files. If a bin has >2000 counts, and if more than 50% of those come from <1% of pixels, then it is considered to be noise-dominated and hence unusable.
| Quadrant | # 1 sec bins | Bins with >0 counts | Bins with >2000 counts | High rate bins dominated by noise | Noise dominated (total time) | Noise dominated (detector-on time) | Marked lightcurve |
|---|---|---|---|---|---|---|---|
| A | 3481 | 2211 | 104 | 104 | 2.99% | 4.70% | 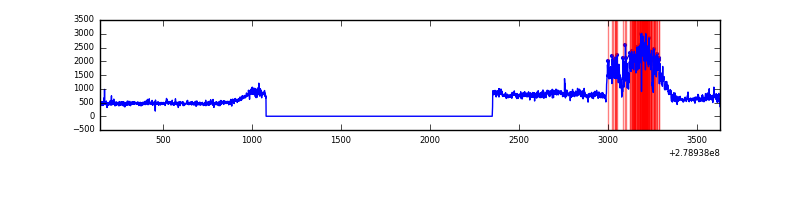 |
| B | 3481 | 2211 | 6 | 6 | 0.17% | 0.27% | 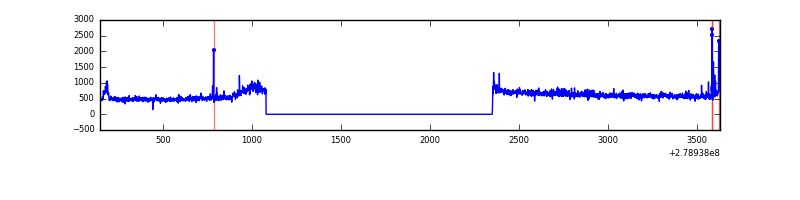 |
| C | 3481 | 2211 | 6 | 6 | 0.17% | 0.27% | 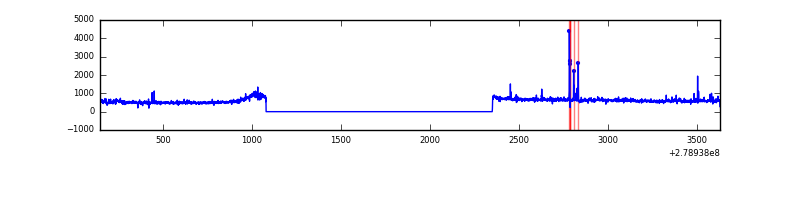 |
| D | 3481 | 2211 | 511 | 511 | 14.68% | 23.11% | 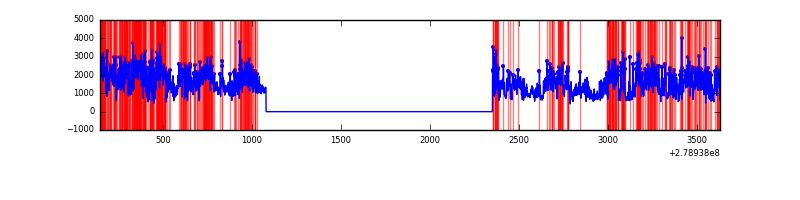 |
Top three noisy pixels from each quadrant. If the there are fewer than three noisy pixels in the level2.evt file, extra rows are filled as -1
| Pixel properties | Quadrant properties | ||||||
|---|---|---|---|---|---|---|---|
| Quadrant | DetID | PixID | Counts | Sigma | Mean | Median | Sigma |
| A | 15 | 174 | 518444 | 7762.03 | 323 | 316 | 66.8 |
| A | 14 | 4 | 42626 | 633.84 | 323 | 316 | 66.8 |
| A | 0 | 226 | 2875 | 38.34 | 323 | 316 | 66.8 |
| B | 10 | 16 | 20924 | 327.58 | 322 | 315 | 62.9 |
| B | 15 | 35 | 19648 | 307.3 | 322 | 315 | 62.9 |
| B | 5 | 236 | 12911 | 200.21 | 322 | 315 | 62.9 |
| C | 0 | 207 | 50632 | 697.91 | 306 | 309 | 72.1 |
| C | 14 | 238 | 47037 | 648.05 | 306 | 309 | 72.1 |
| C | 3 | 233 | 41665 | 573.55 | 306 | 309 | 72.1 |
| D | 1 | 52 | 2048460 | 28625.85 | 291 | 283 | 71.5 |
| D | 11 | 176 | 114366 | 1594.45 | 291 | 283 | 71.5 |
| D | 13 | 232 | 99745 | 1390.11 | 291 | 283 | 71.5 |
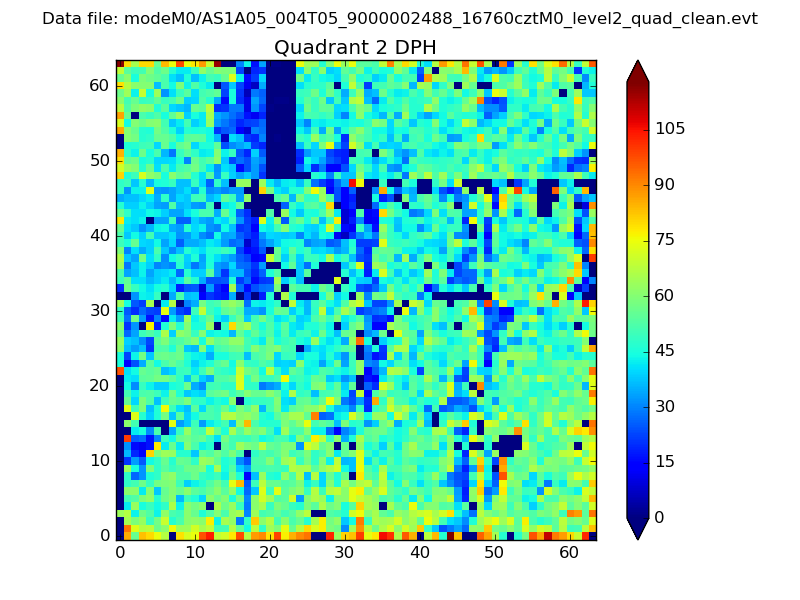
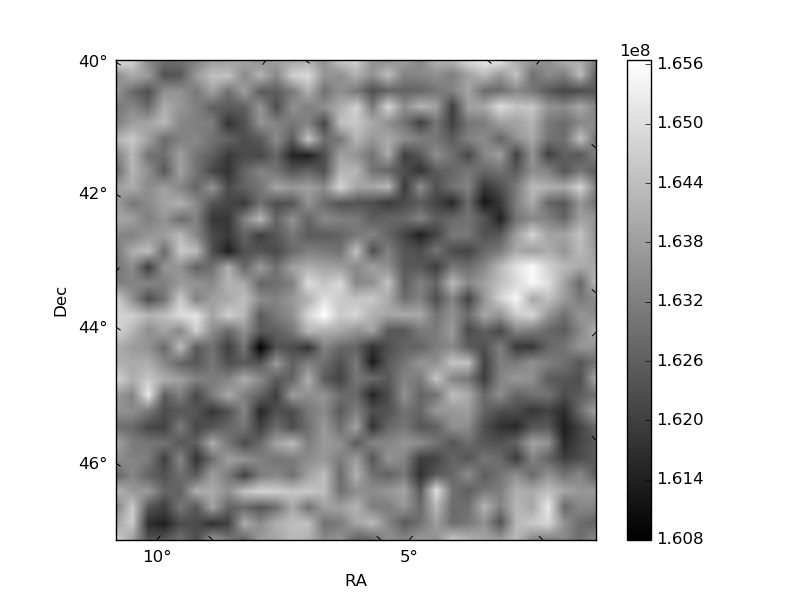
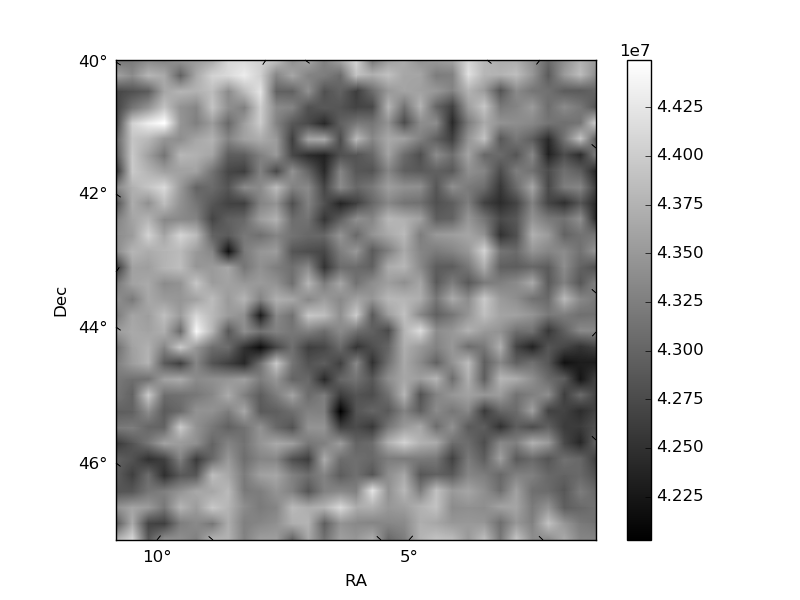
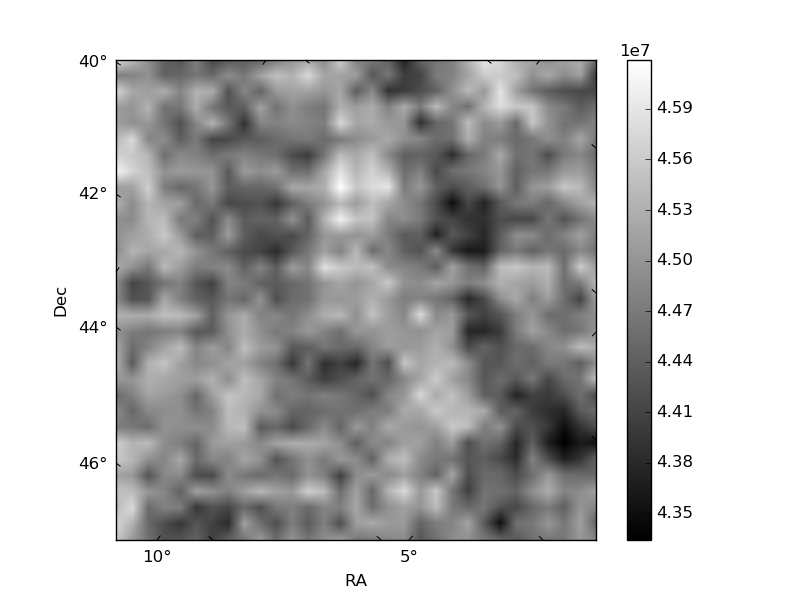
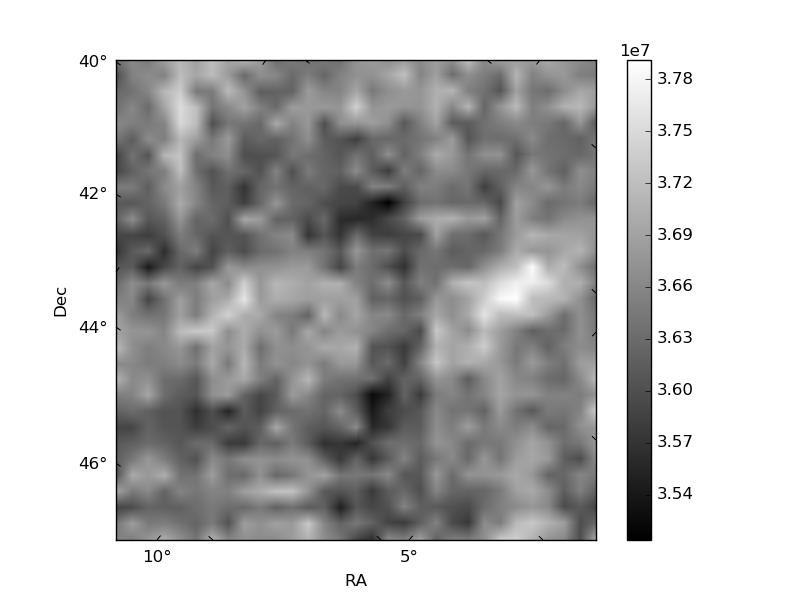
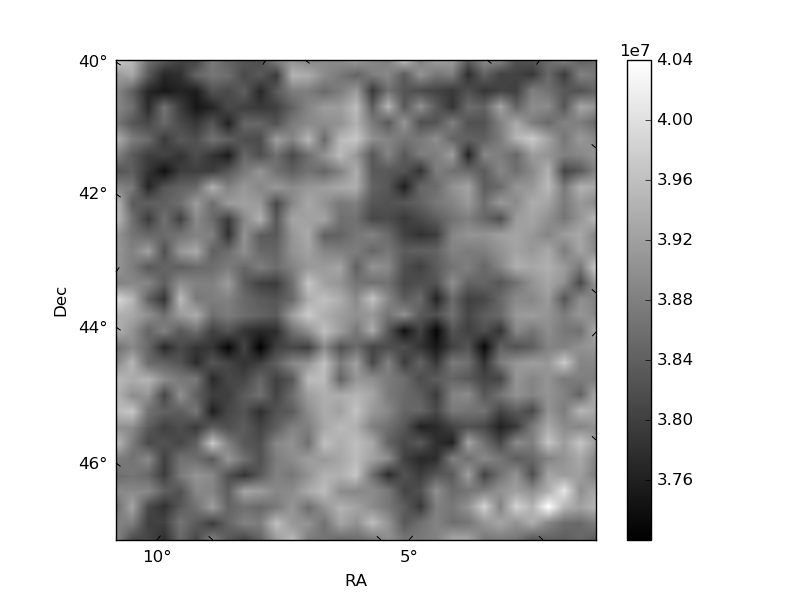
Histogram calculated using DETX and DETY for each event in the final _common_clean file
| Quadrant A | 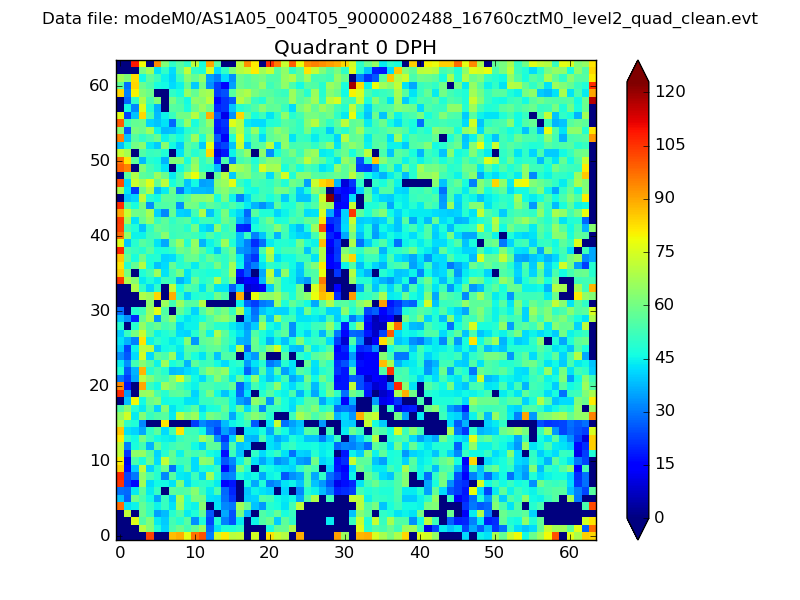 |
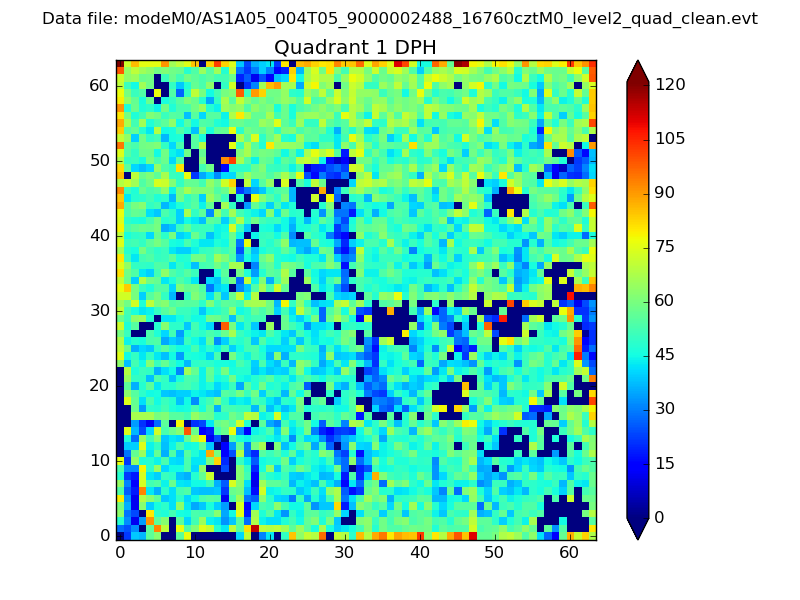 |
Quadrant B |
|---|---|---|---|
| Quadrant D | 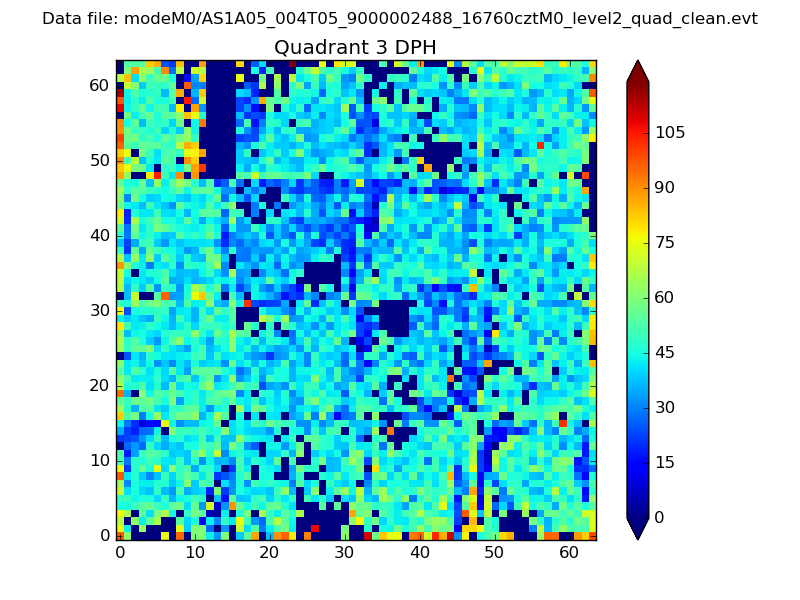 |
 |
Quadrant C |
| Plot type | Count rate plots | Images |
|---|---|---|
| Comparison with Poisson distribution Blue bars denote a histogram of data divided into 1 sec bins. Red curve is a Poisson curve with rate = median count rate of data. |
 |
 |
| Quadrant-wise count rates Data is divided into 100 sec bins |
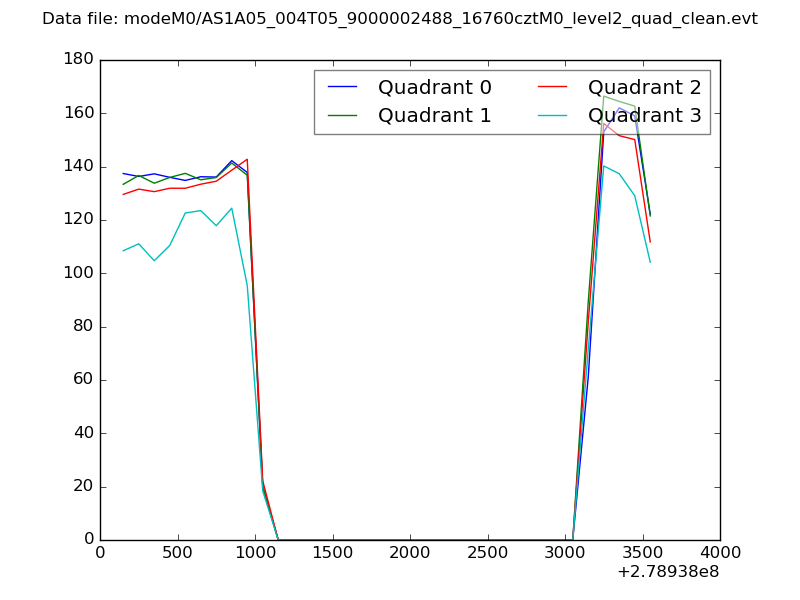 |
|
| Module-wise count rates for Quadrant A Data is divided into 100 sec bins |
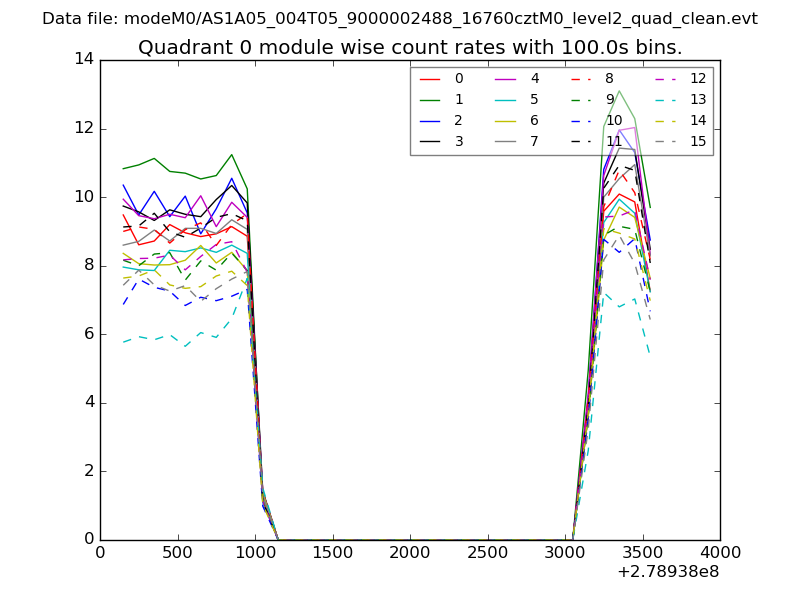 |
 |
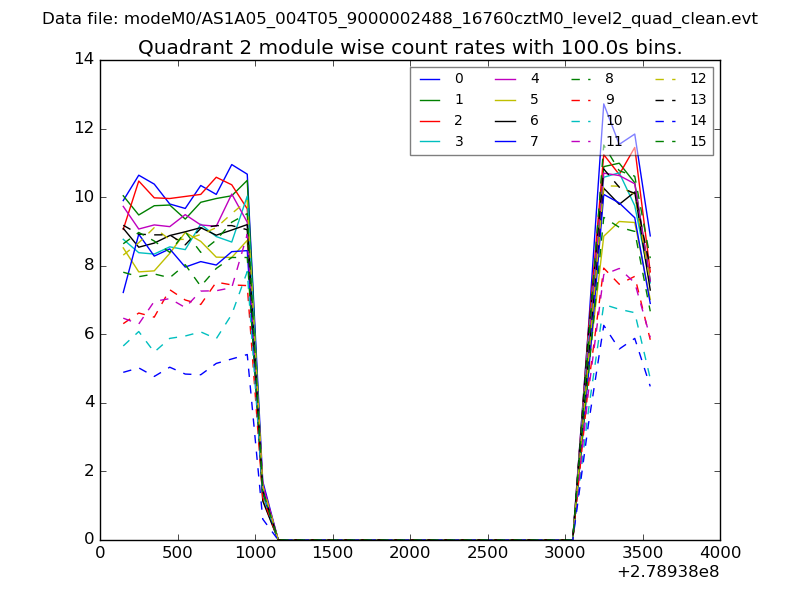
| Module-wise count rates for Quadrant B Data is divided into 100 sec bins |
 |
 |
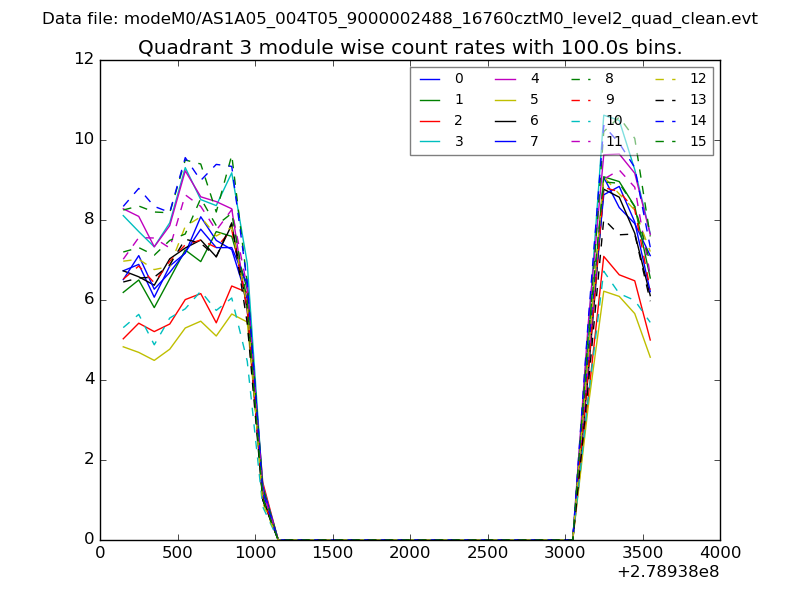
| Module-wise count rates for Quadrant C Data is divided into 100 sec bins |
 |
 |
| Module-wise count rates for Quadrant D Data is divided into 100 sec bins |
 |
 |
| Parameter | Plot |
|---|---|
| CZT HV Monitor | 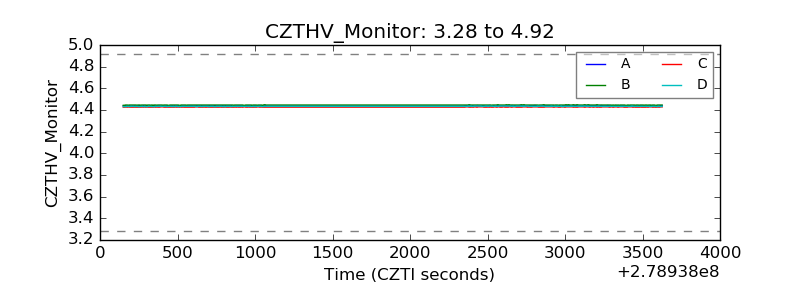 |
| D_VDD | 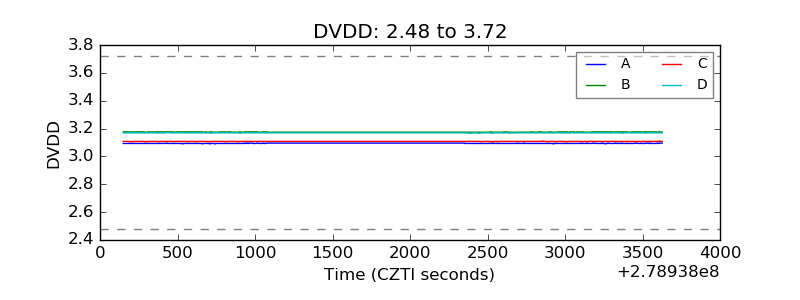 |
| Temperature 1 | 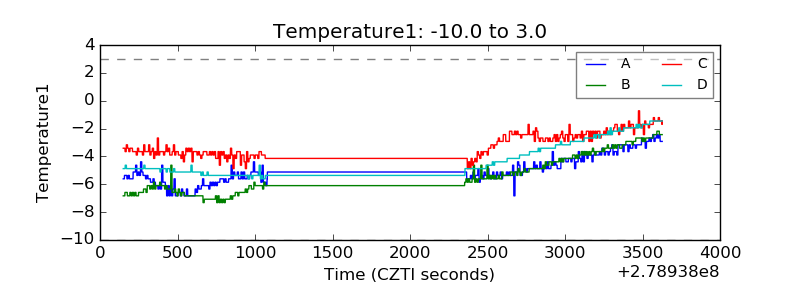 |
| Veto HV Monitor | 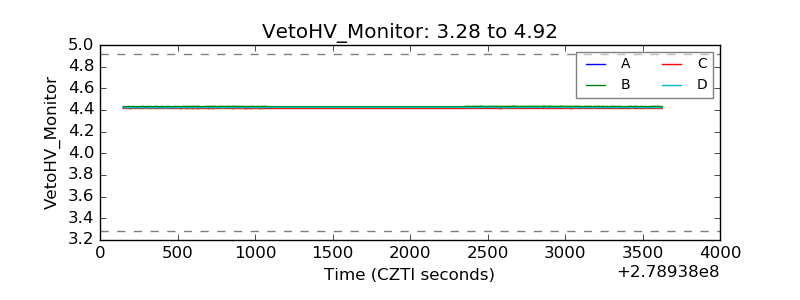 |
| Veto LLD | 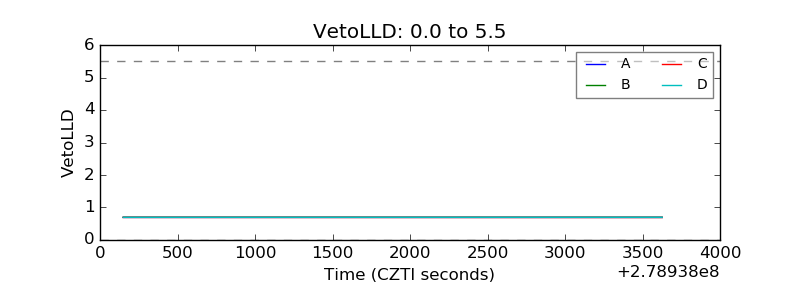 |
| Alpha Counter |  |
| _CPM_Rate | 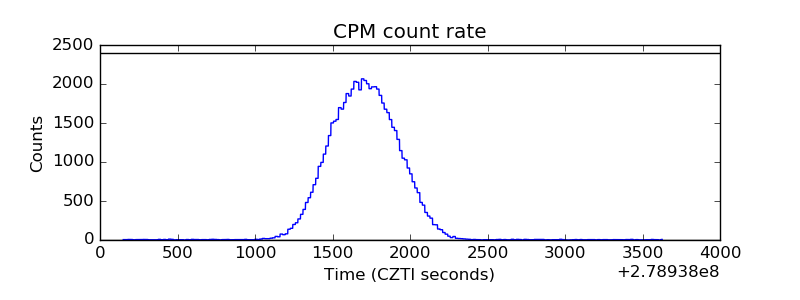 |
| CZT Counter | 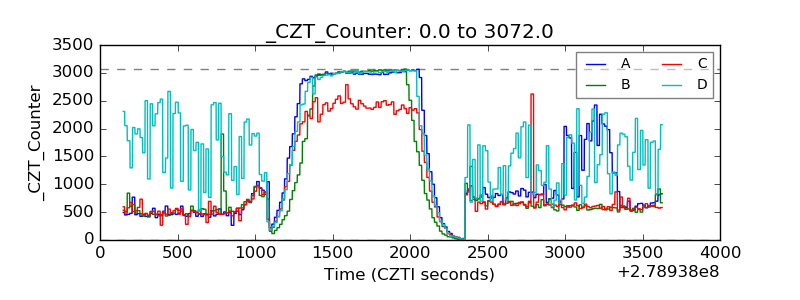 |
| +2.5 Volts monitor |  |
| +5 Volts monitor |  |
| _ROLL_ROT | 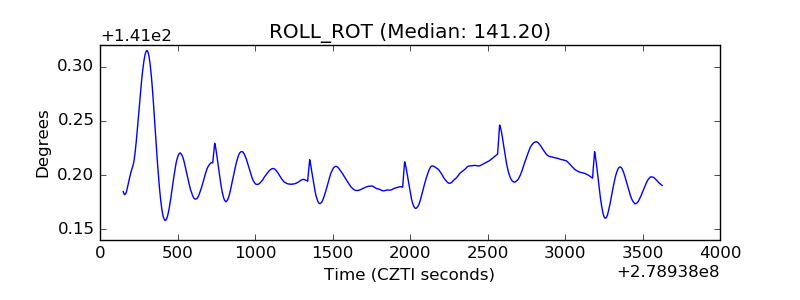 |
| _Roll_DEC | 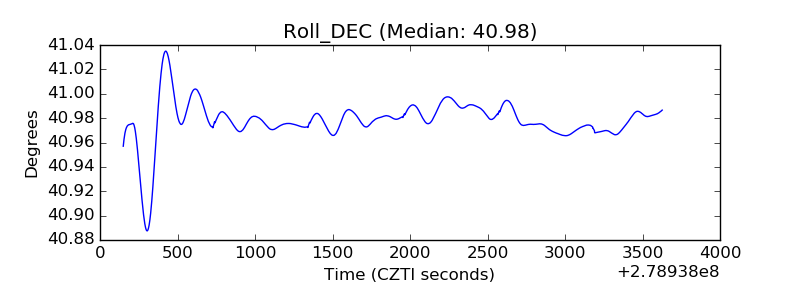 |
| _Roll_RA | 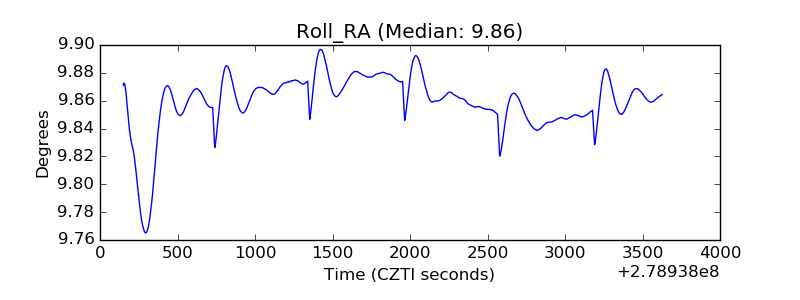 |
| Veto Counter | 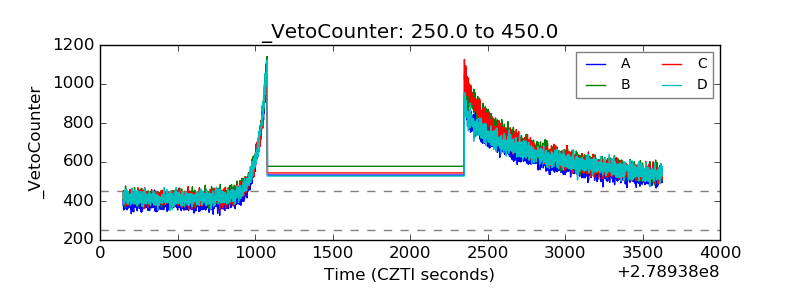 |