| Param | Original file | Final file |
|---|---|---|
| Filename | modeM0/AS1A05_004T05_9000002488_16761cztM0_level2.evt | modeM0/AS1A05_004T05_9000002488_16761cztM0_level2_quad_clean.evt |
| Size (bytes) | 802,670,400 | 100,647,360 |
| Size | 765.5 MB | 96.0 MB |
| Events in quadrant A | 4,075,976 | 716,107 |
| Events in quadrant B | 3,974,797 | 716,339 |
| Events in quadrant C | 3,920,847 | 678,008 |
| Events in quadrant D | 11,902,776 | 487,267 |
| Mode SS | |||
|---|---|---|---|
| Quadrant | BADHDUFLAG | Total packets | Discarded packets |
| A | 0 | 132 | 0 |
| B | 0 | 132 | 0 |
| C | 0 | 132 | 0 |
| D | 0 | 132 | 0 |
| Mode M9 | |||
|---|---|---|---|
| Quadrant | BADHDUFLAG | Total packets | Discarded packets |
| A | 0 | 15 | 0 |
| B | 0 | 15 | 0 |
| C | 0 | 15 | 0 |
| D | 0 | 16 | 0 |
| Mode M0 | |||
|---|---|---|---|
| Quadrant | BADHDUFLAG | Total packets | Discarded packets |
| A | 0 | 16188 | 3 |
| B | 0 | 16153 | 2 |
| C | 0 | 15967 | 2 |
| D | 0 | 39830 | 2 |
| Quadrant | Total seconds | Saturated seconds | Saturation percentage |
|---|---|---|---|
| A | 6435 | 247 | 3.838384% |
| B | 6435 | 134 | 2.082362% |
| C | 6435 | 146 | 2.268842% |
| D | 6435 | 3351 | 52.074592% |
Noise dominated data is calculated using 1-second bins in cleaned event files. If a bin has >2000 counts, and if more than 50% of those come from <1% of pixels, then it is considered to be noise-dominated and hence unusable.
| Quadrant | # 1 sec bins | Bins with >0 counts | Bins with >2000 counts | High rate bins dominated by noise | Noise dominated (total time) | Noise dominated (detector-on time) | Marked lightcurve |
|---|---|---|---|---|---|---|---|
| A | 7766 | 6437 | 104 | 104 | 1.34% | 1.62% | 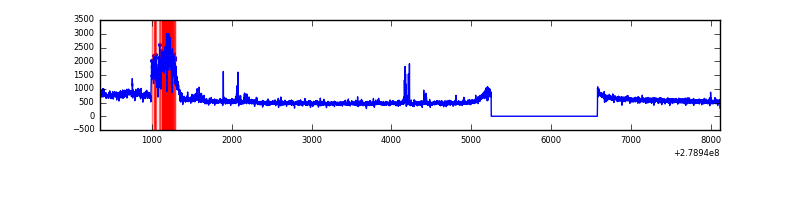 |
| B | 7766 | 6437 | 21 | 21 | 0.27% | 0.33% | 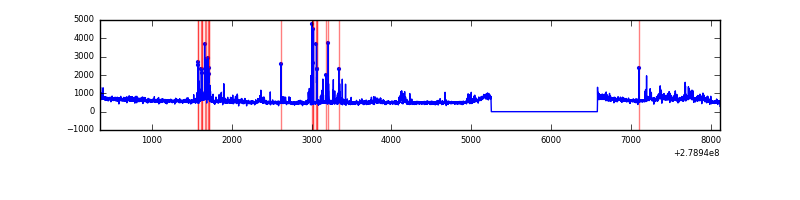 |
| C | 7766 | 6437 | 11 | 11 | 0.14% | 0.17% | 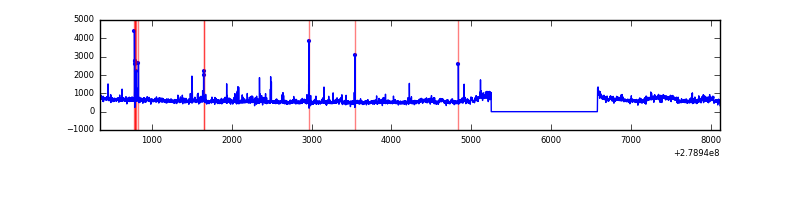 |
| D | 7766 | 6437 | 2925 | 2925 | 37.66% | 45.44% | 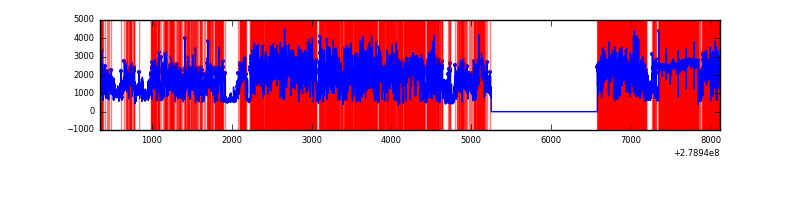 |
Top three noisy pixels from each quadrant. If the there are fewer than three noisy pixels in the level2.evt file, extra rows are filled as -1
| Pixel properties | Quadrant properties | ||||||
|---|---|---|---|---|---|---|---|
| Quadrant | DetID | PixID | Counts | Sigma | Mean | Median | Sigma |
| A | 15 | 174 | 541478 | 3017.18 | 898 | 881 | 179.2 |
| A | 14 | 4 | 80957 | 446.92 | 898 | 881 | 179.2 |
| A | 0 | 226 | 8151 | 40.58 | 898 | 881 | 179.2 |
| B | 0 | 219 | 164015 | 992.57 | 882 | 863 | 164.4 |
| B | 15 | 35 | 138941 | 840.02 | 882 | 863 | 164.4 |
| B | 10 | 16 | 67164 | 403.35 | 882 | 863 | 164.4 |
| C | 3 | 233 | 315193 | 1627.36 | 842 | 848 | 193.2 |
| C | 0 | 207 | 177481 | 914.42 | 842 | 848 | 193.2 |
| C | 14 | 238 | 132261 | 680.32 | 842 | 848 | 193.2 |
| D | 1 | 52 | 6557087 | 40334.39 | 680 | 662 | 162.6 |
| D | 15 | 0 | 1754185 | 10787.48 | 680 | 662 | 162.6 |
| D | 13 | 232 | 547752 | 3365.64 | 680 | 662 | 162.6 |
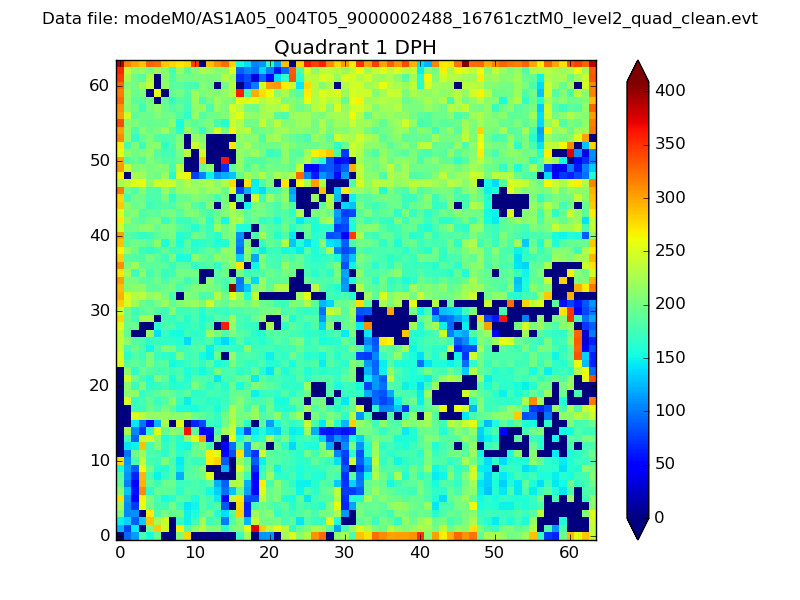
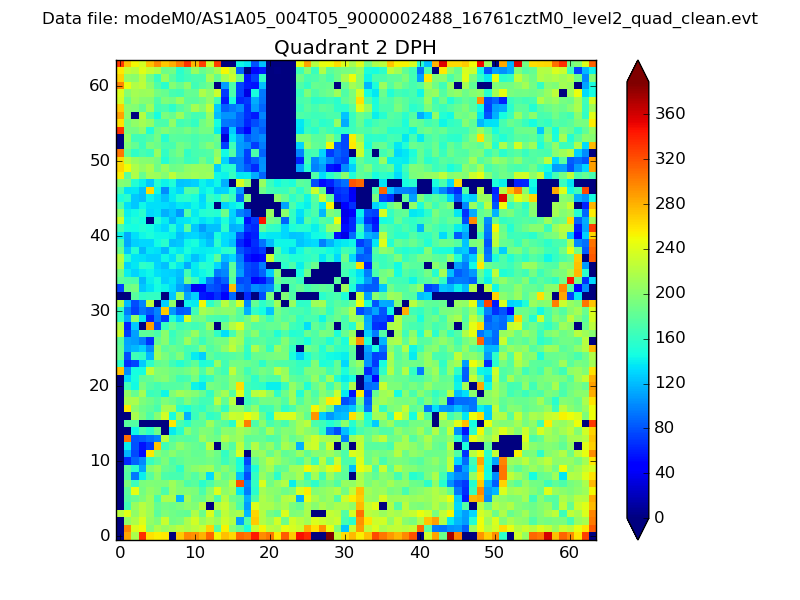
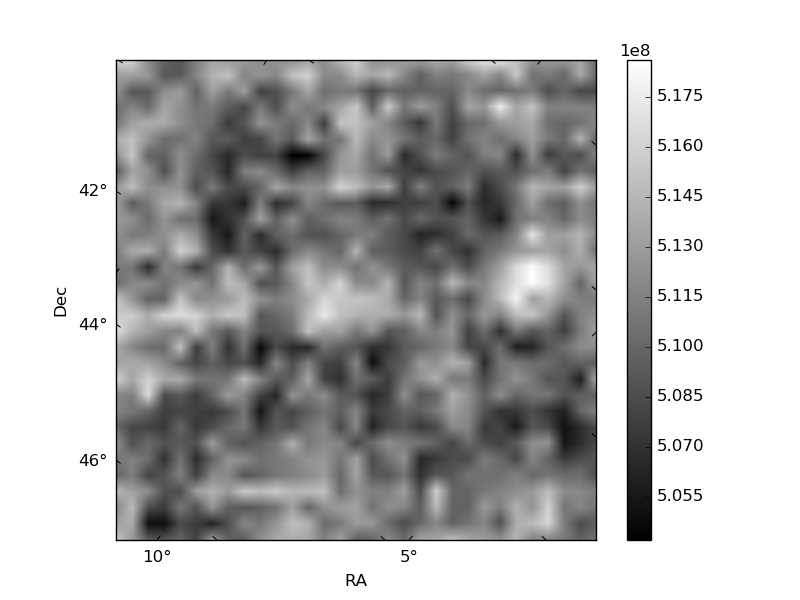
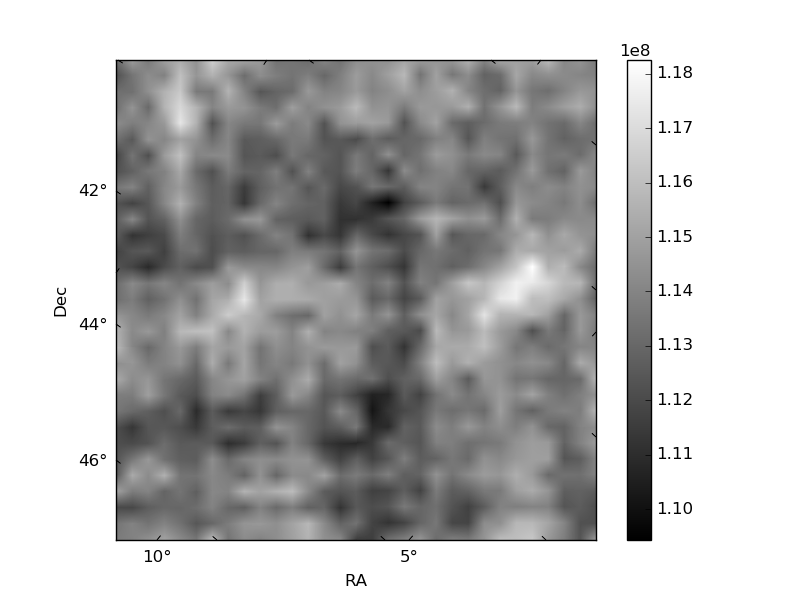
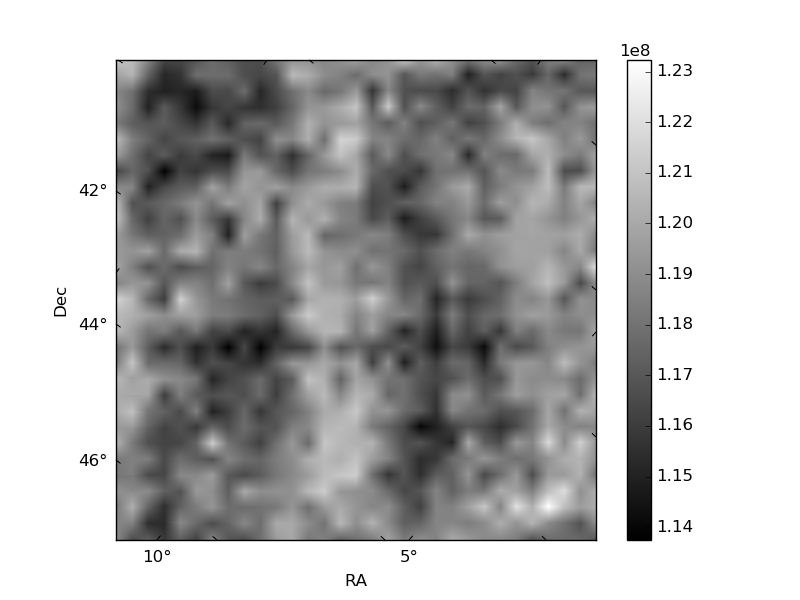
Histogram calculated using DETX and DETY for each event in the final _common_clean file
| Quadrant A |  |
 |
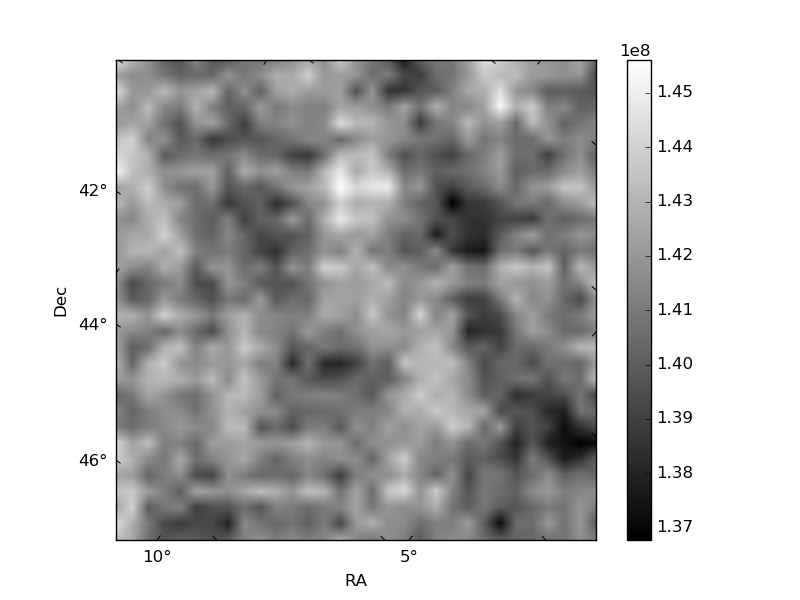
Quadrant B |
|---|---|---|---|
| Quadrant D | 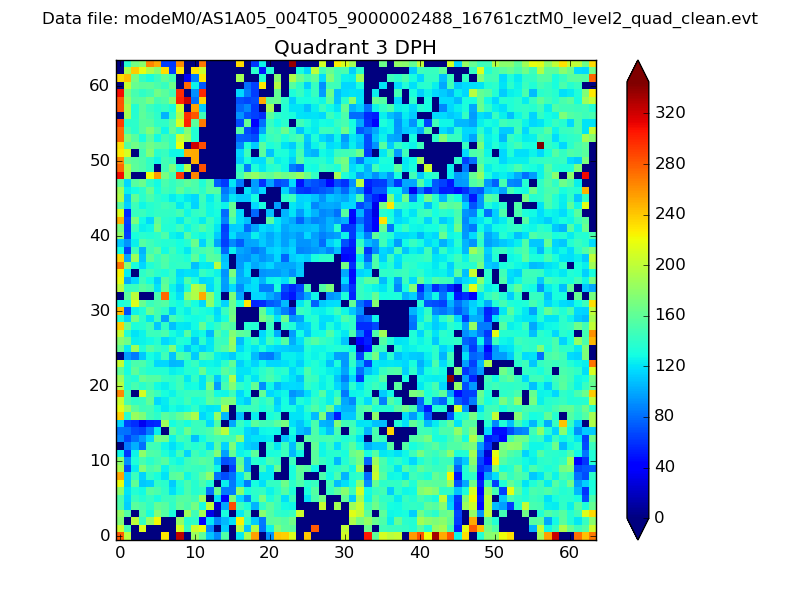 |
 |
Quadrant C |
| Plot type | Count rate plots | Images |
|---|---|---|
| Comparison with Poisson distribution Blue bars denote a histogram of data divided into 1 sec bins. Red curve is a Poisson curve with rate = median count rate of data. |
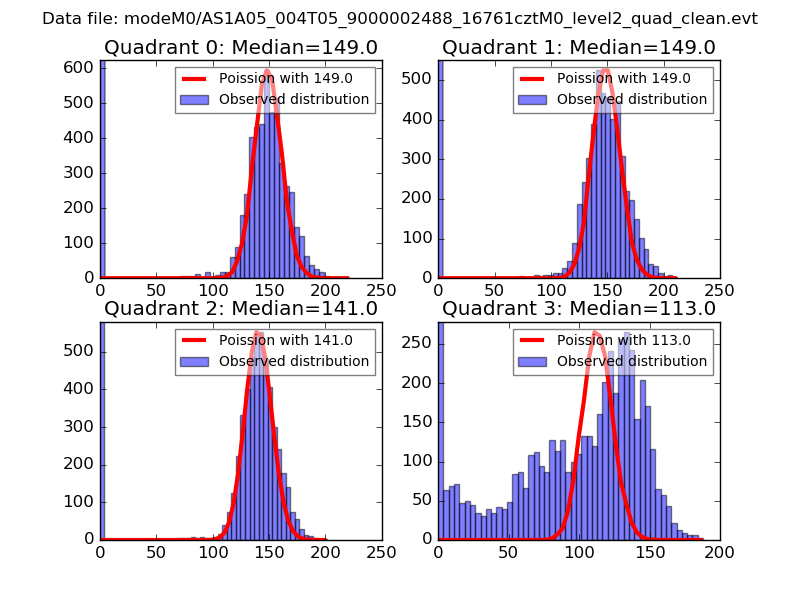 |
 |
| Quadrant-wise count rates Data is divided into 100 sec bins |
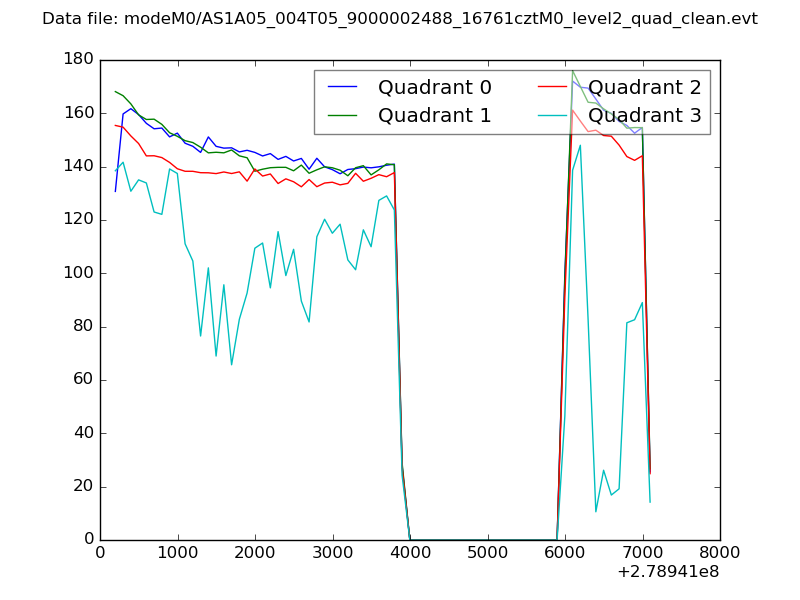 |
|
| Module-wise count rates for Quadrant A Data is divided into 100 sec bins |
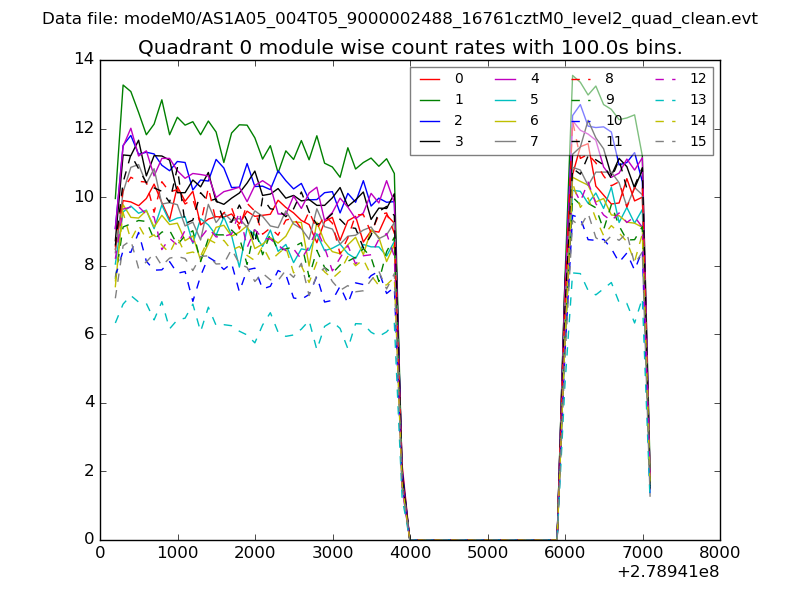 |
 |
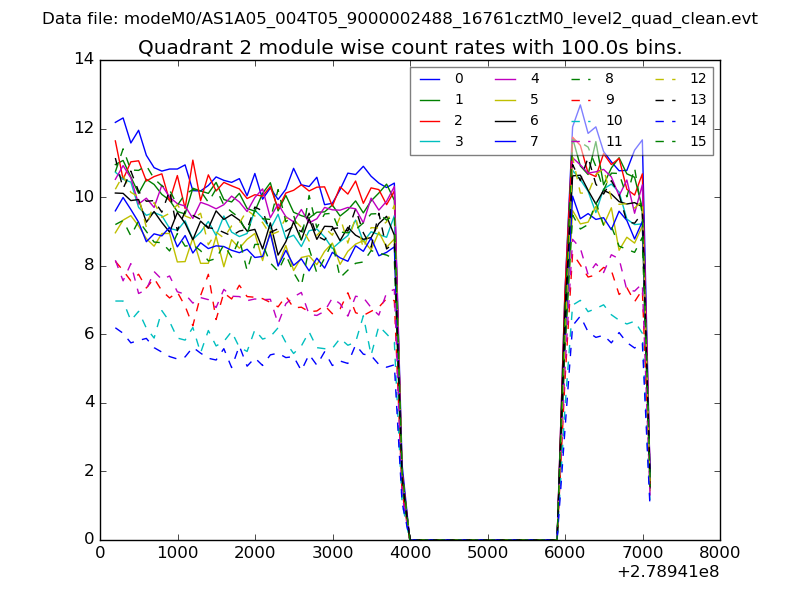
| Module-wise count rates for Quadrant B Data is divided into 100 sec bins |
 |
 |
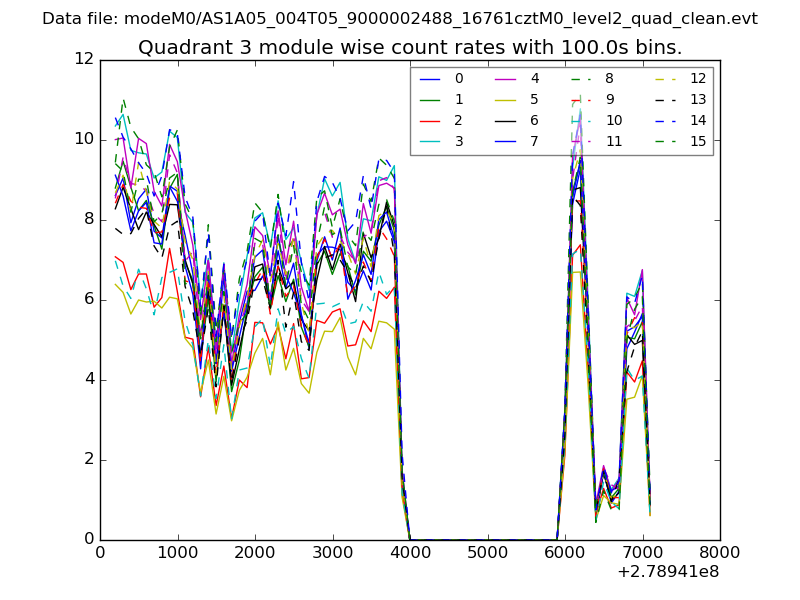
| Module-wise count rates for Quadrant C Data is divided into 100 sec bins |
 |
 |
| Module-wise count rates for Quadrant D Data is divided into 100 sec bins |
 |
 |
| Parameter | Plot |
|---|---|
| CZT HV Monitor | 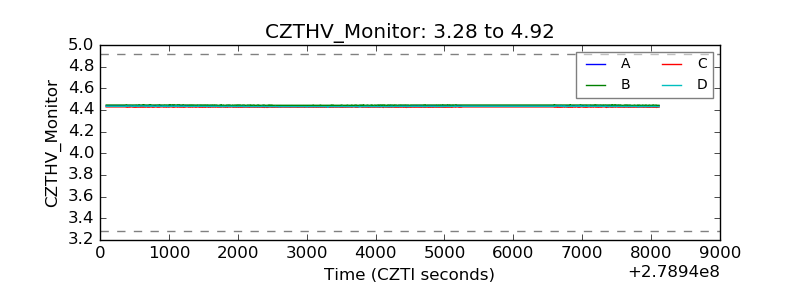 |
| D_VDD | 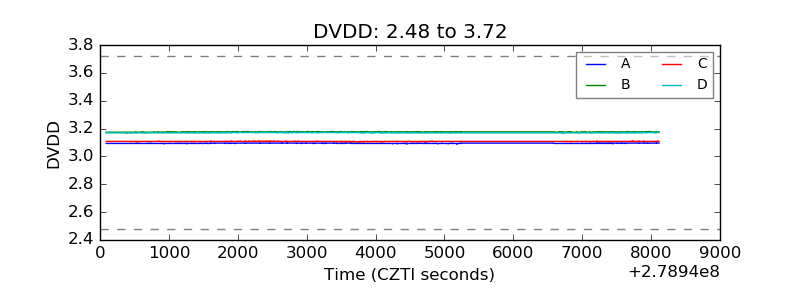 |
| Temperature 1 | 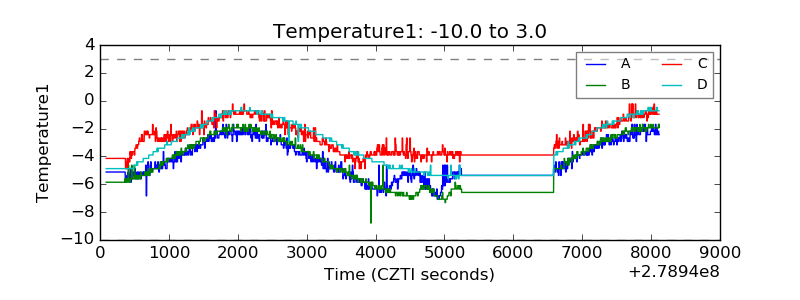 |
| Veto HV Monitor | 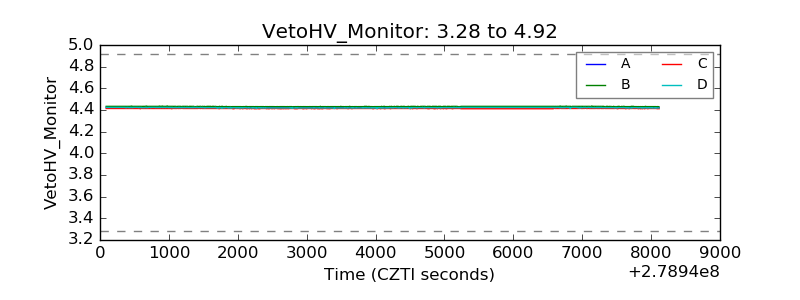 |
| Veto LLD | 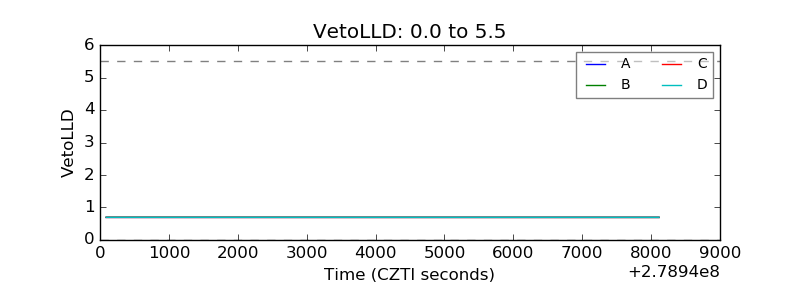 |
| Alpha Counter | 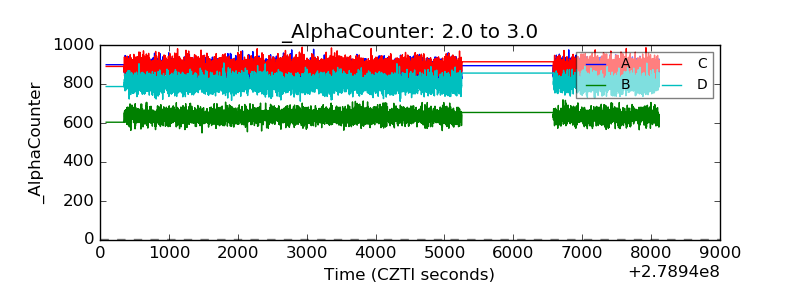 |
| _CPM_Rate | 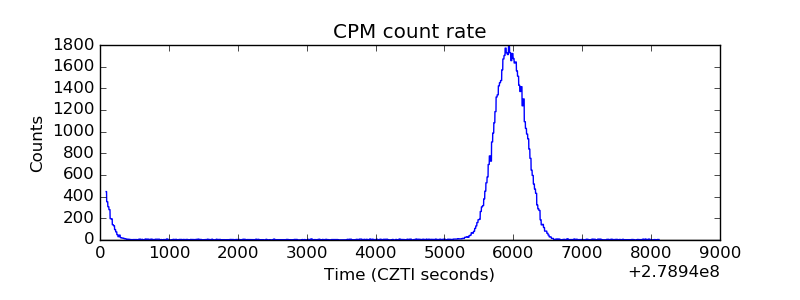 |
| CZT Counter | 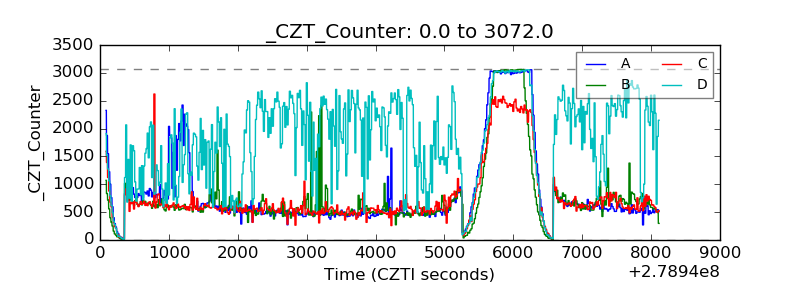 |
| +2.5 Volts monitor |  |
| +5 Volts monitor |  |
| _ROLL_ROT | 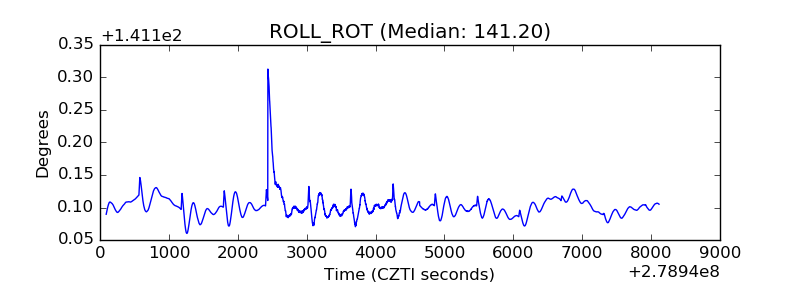 |
| _Roll_DEC | 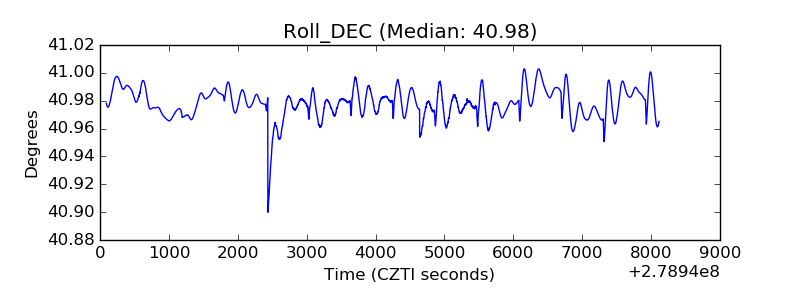 |
| _Roll_RA | 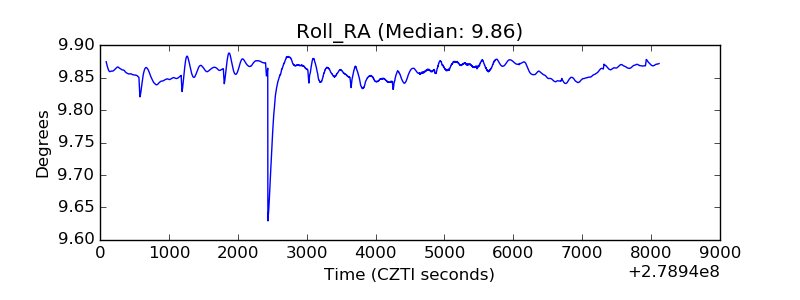 |
| Veto Counter | 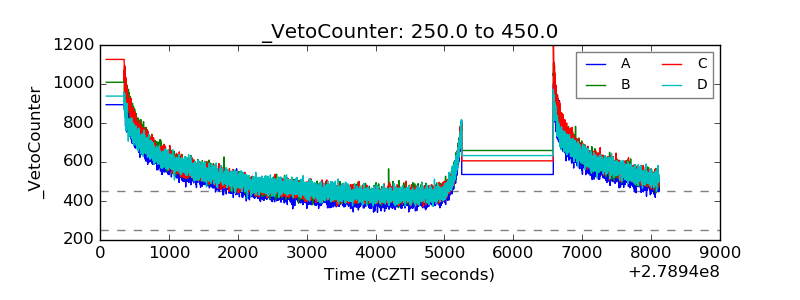 |