| Param | Original file | Final file |
|---|---|---|
| Filename | modeM0/AS1A05_004T05_9000002488_16763cztM0_level2.evt | modeM0/AS1A05_004T05_9000002488_16763cztM0_level2_quad_clean.evt |
| Size (bytes) | 645,952,320 | 106,096,320 |
| Size | 616.0 MB | 101.2 MB |
| Events in quadrant A | 3,252,697 | 726,423 |
| Events in quadrant B | 3,527,614 | 722,544 |
| Events in quadrant C | 4,128,158 | 692,539 |
| Events in quadrant D | 8,216,909 | 620,143 |
| Mode SS | |||
|---|---|---|---|
| Quadrant | BADHDUFLAG | Total packets | Discarded packets |
| A | 0 | 132 | 0 |
| B | 0 | 132 | 0 |
| C | 0 | 132 | 0 |
| D | 0 | 132 | 0 |
| Mode M9 | |||
|---|---|---|---|
| Quadrant | BADHDUFLAG | Total packets | Discarded packets |
| A | 0 | 11 | 0 |
| B | 0 | 11 | 0 |
| C | 0 | 11 | 0 |
| D | 0 | 11 | 0 |
| Mode M0 | |||
|---|---|---|---|
| Quadrant | BADHDUFLAG | Total packets | Discarded packets |
| A | 0 | 13711 | 2 |
| B | 0 | 14547 | 1 |
| C | 0 | 16639 | 1 |
| D | 0 | 28935 | 1 |
| Quadrant | Total seconds | Saturated seconds | Saturation percentage |
|---|---|---|---|
| A | 6465 | 102 | 1.577726% |
| B | 6465 | 105 | 1.624130% |
| C | 6465 | 165 | 2.552204% |
| D | 6465 | 1425 | 22.041763% |
Noise dominated data is calculated using 1-second bins in cleaned event files. If a bin has >2000 counts, and if more than 50% of those come from <1% of pixels, then it is considered to be noise-dominated and hence unusable.
| Quadrant | # 1 sec bins | Bins with >0 counts | Bins with >2000 counts | High rate bins dominated by noise | Noise dominated (total time) | Noise dominated (detector-on time) | Marked lightcurve |
|---|---|---|---|---|---|---|---|
| A | 7581 | 6467 | 6 | 6 | 0.08% | 0.09% | 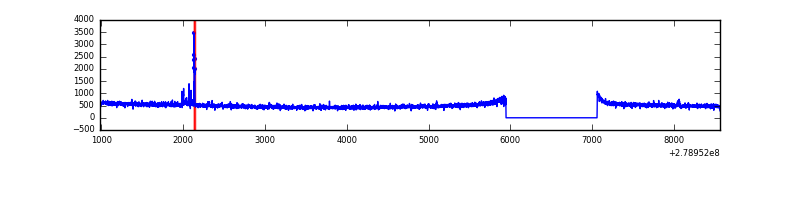 |
| B | 7581 | 6467 | 9 | 9 | 0.12% | 0.14% | 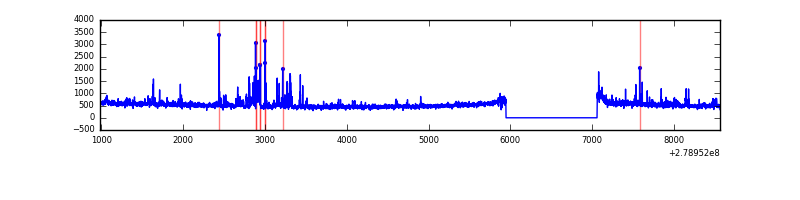 |
| C | 7581 | 6467 | 3 | 3 | 0.04% | 0.05% | 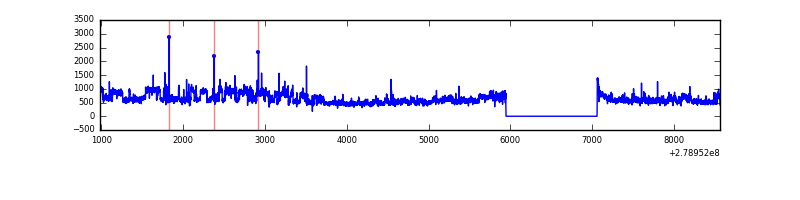 |
| D | 7581 | 6467 | 1047 | 1047 | 13.81% | 16.19% | 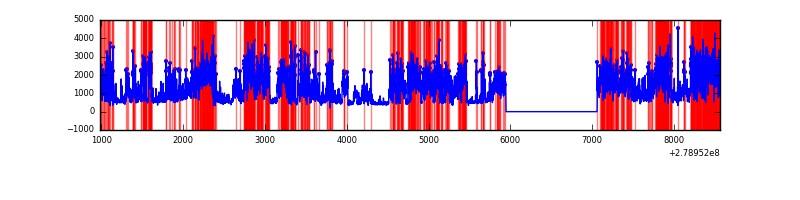 |
Top three noisy pixels from each quadrant. If the there are fewer than three noisy pixels in the level2.evt file, extra rows are filled as -1
| Pixel properties | Quadrant properties | ||||||
|---|---|---|---|---|---|---|---|
| Quadrant | DetID | PixID | Counts | Sigma | Mean | Median | Sigma |
| A | 15 | 174 | 53115 | 314.32 | 829 | 812 | 166.4 |
| A | 3 | 1 | 11833 | 66.23 | 829 | 812 | 166.4 |
| A | 0 | 226 | 7329 | 39.16 | 829 | 812 | 166.4 |
| B | 3 | 209 | 115301 | 739.08 | 818 | 801 | 154.9 |
| B | 15 | 35 | 98554 | 630.98 | 818 | 801 | 154.9 |
| B | 5 | 236 | 29974 | 188.31 | 818 | 801 | 154.9 |
| C | 3 | 233 | 787967 | 4283.73 | 792 | 798 | 183.8 |
| C | 14 | 238 | 125049 | 676.17 | 792 | 798 | 183.8 |
| C | 0 | 207 | 122997 | 665.0 | 792 | 798 | 183.8 |
| D | 1 | 52 | 4093210 | 22365.63 | 755 | 734 | 183.0 |
| D | 13 | 232 | 1000365 | 5463.04 | 755 | 734 | 183.0 |
| D | 11 | 176 | 83670 | 453.25 | 755 | 734 | 183.0 |
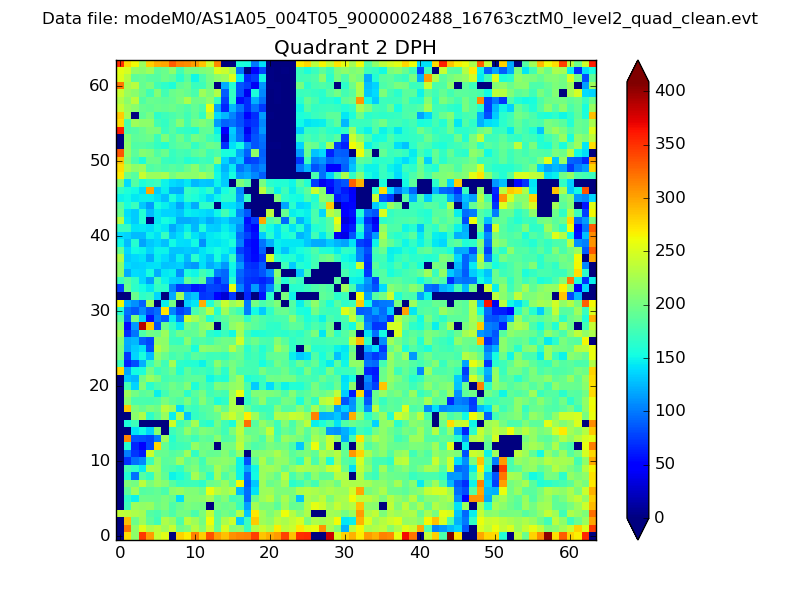
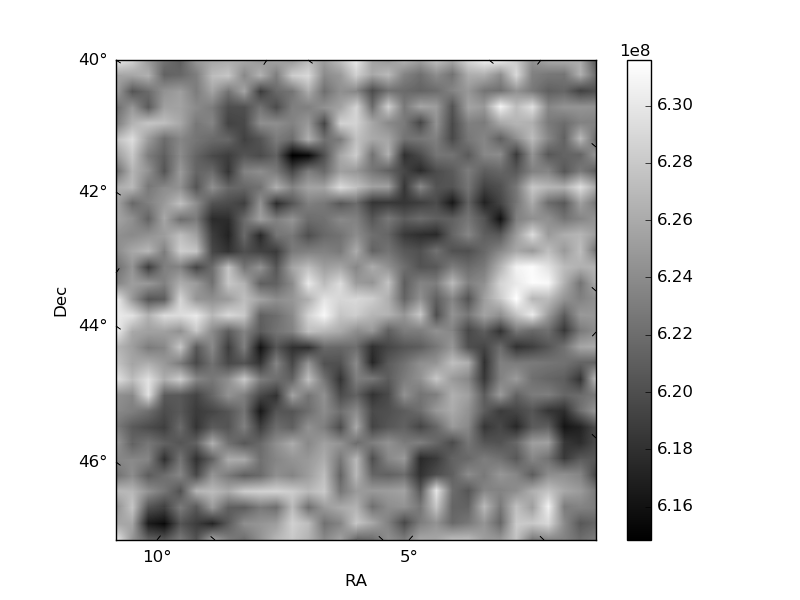
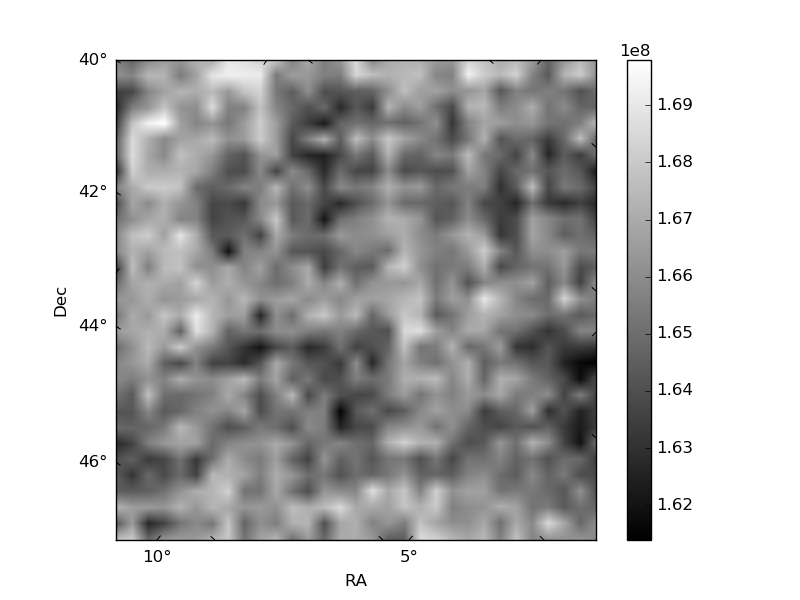
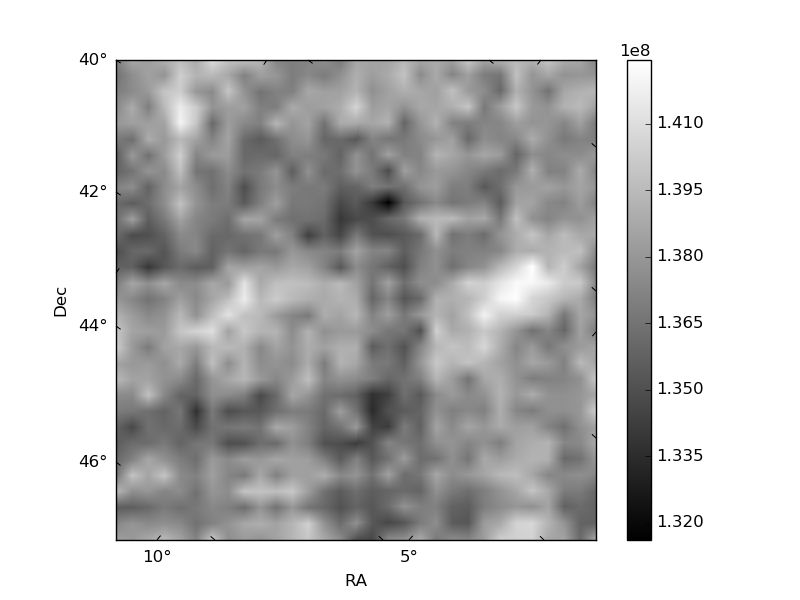
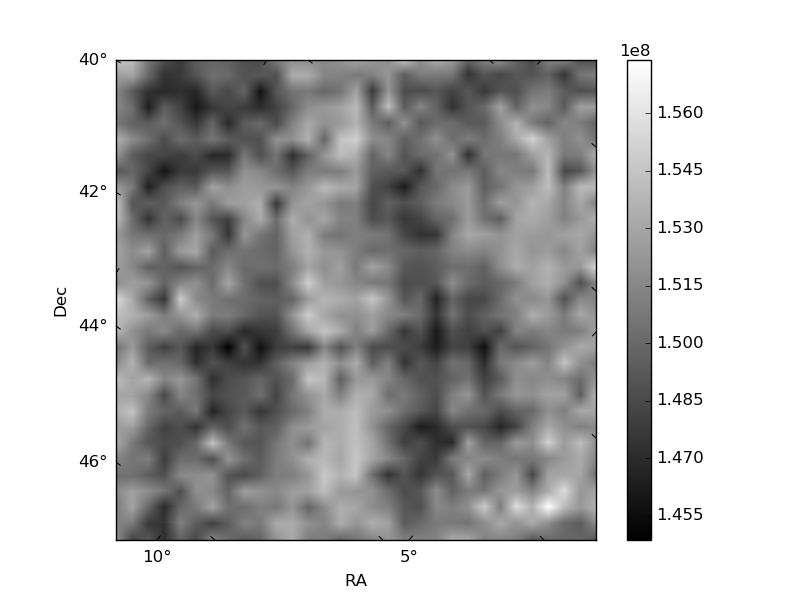
Histogram calculated using DETX and DETY for each event in the final _common_clean file
| Quadrant A | 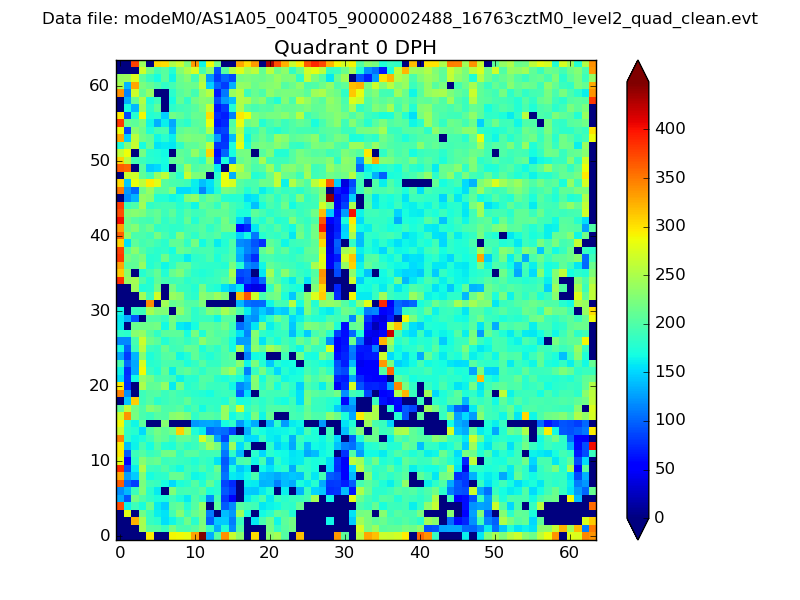 |
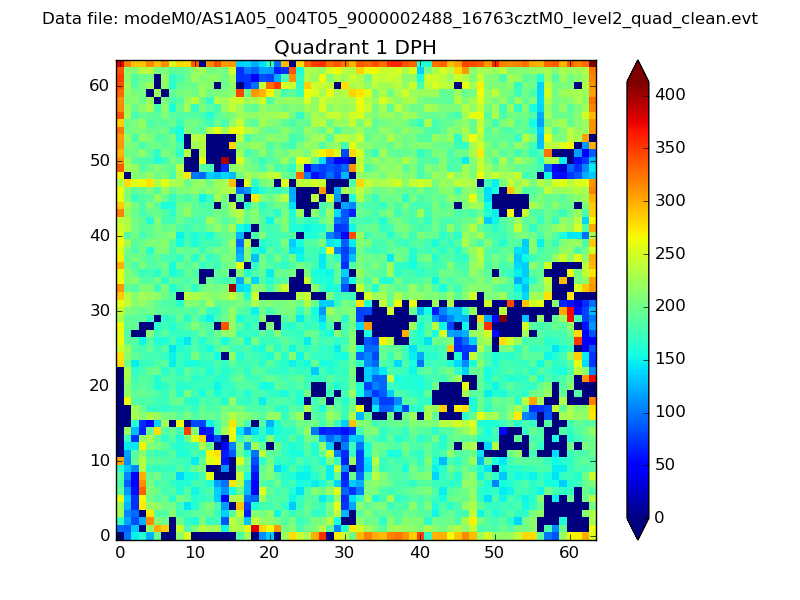 |
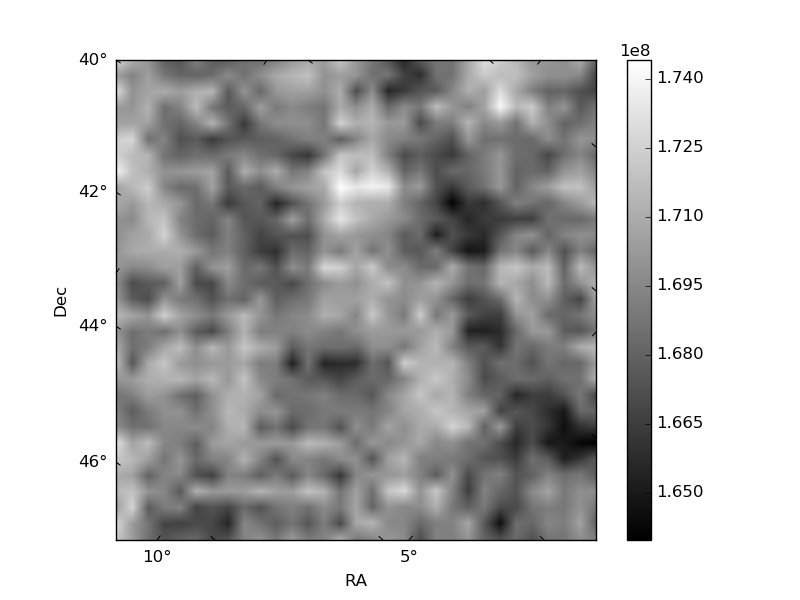
Quadrant B |
|---|---|---|---|
| Quadrant D | 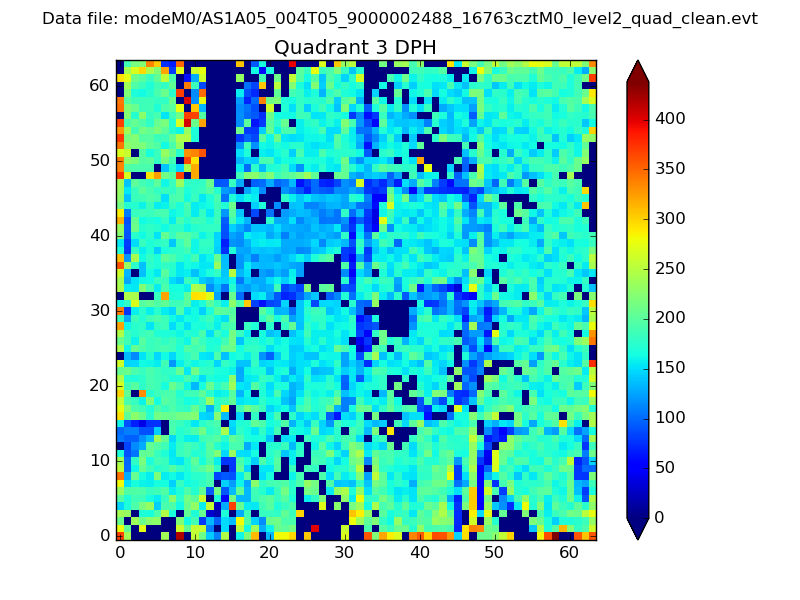 |
 |
Quadrant C |
| Plot type | Count rate plots | Images |
|---|---|---|
| Comparison with Poisson distribution Blue bars denote a histogram of data divided into 1 sec bins. Red curve is a Poisson curve with rate = median count rate of data. |
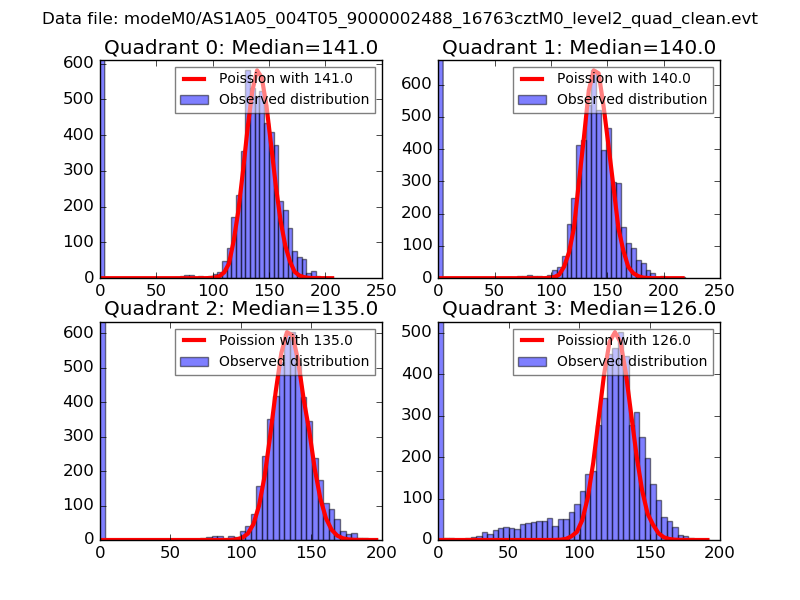 |
 |
| Quadrant-wise count rates Data is divided into 100 sec bins |
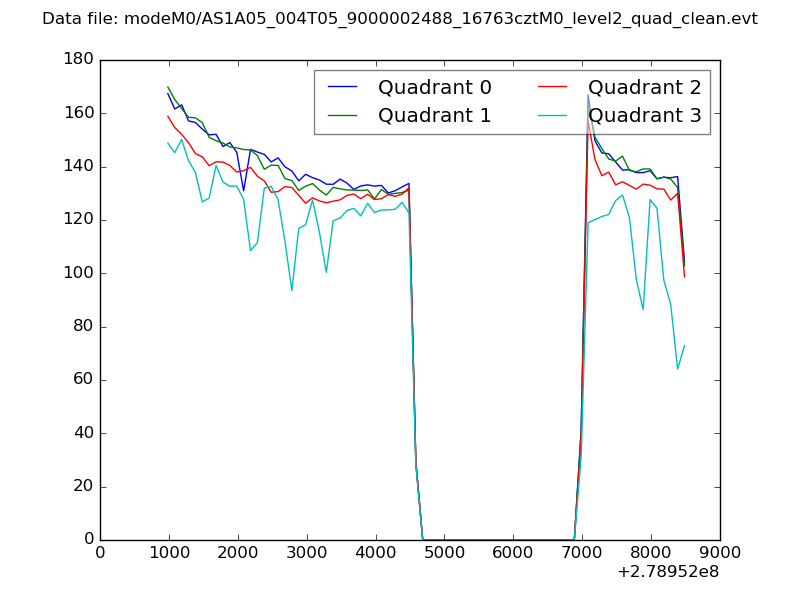 |
|
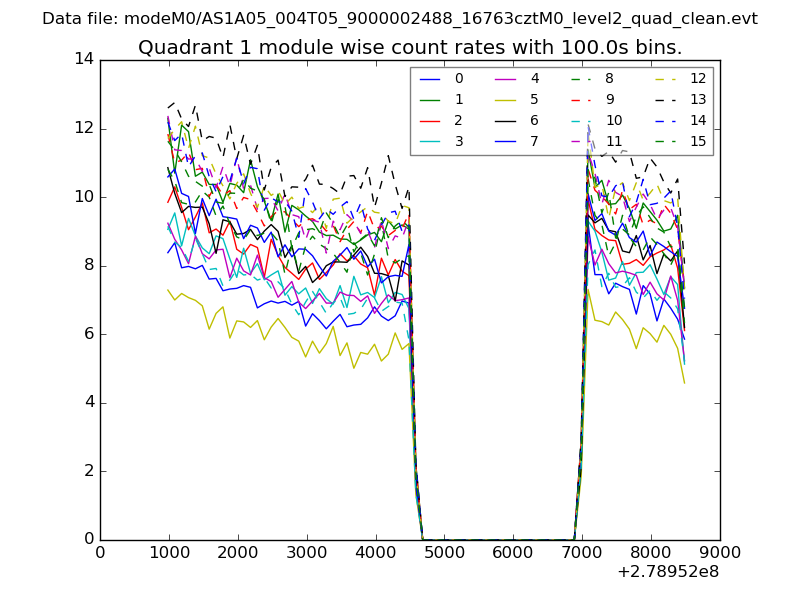
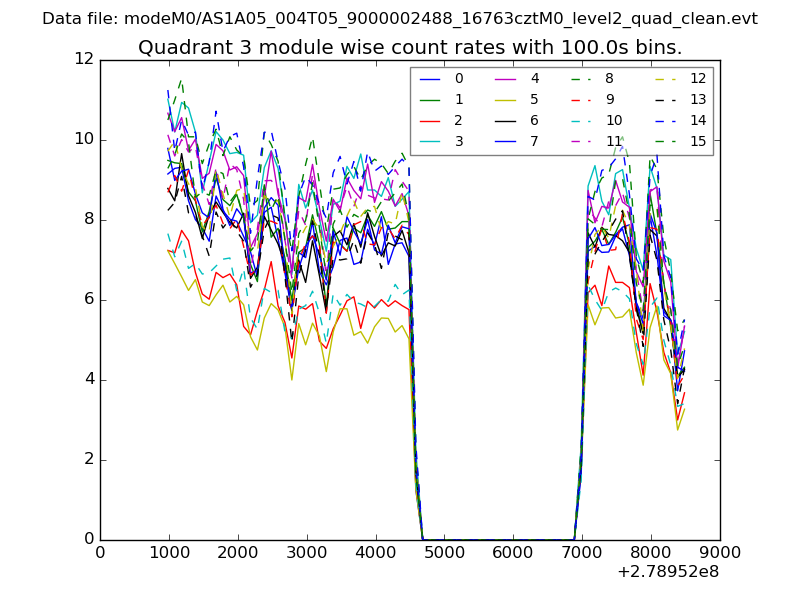
| Module-wise count rates for Quadrant A Data is divided into 100 sec bins |
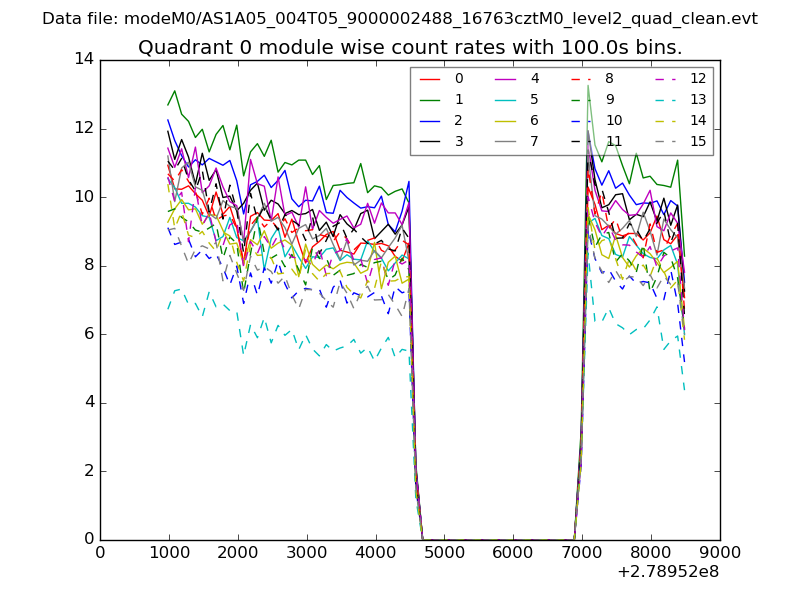 |
 |
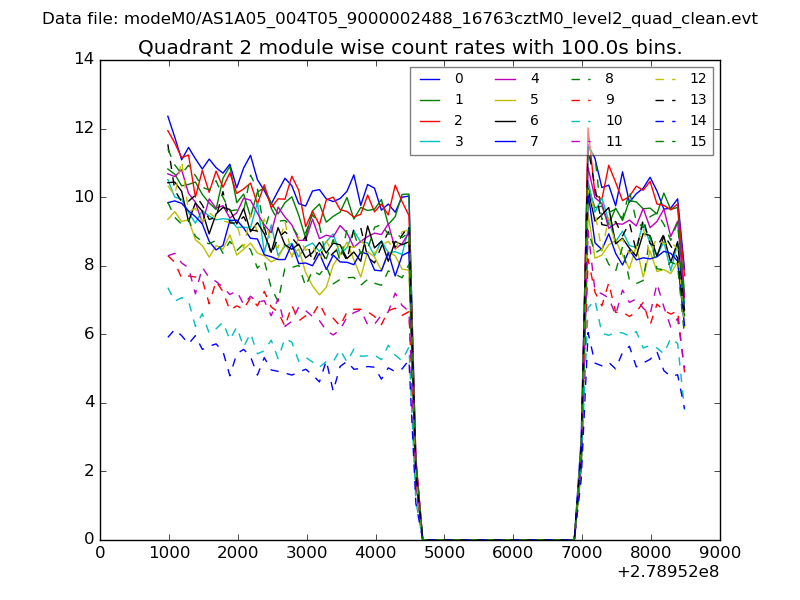
| Module-wise count rates for Quadrant B Data is divided into 100 sec bins |
 |
 |
| Module-wise count rates for Quadrant C Data is divided into 100 sec bins |
 |
 |
| Module-wise count rates for Quadrant D Data is divided into 100 sec bins |
 |
 |
| Parameter | Plot |
|---|---|
| CZT HV Monitor | 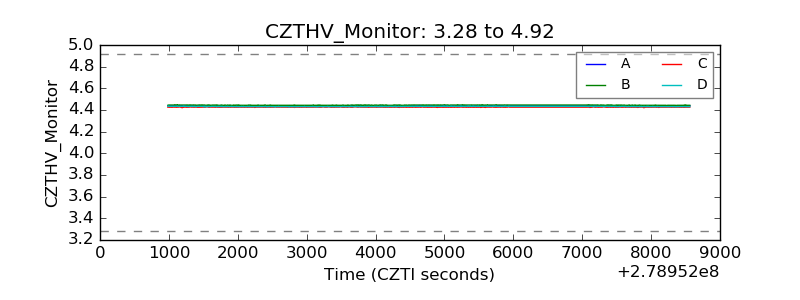 |
| D_VDD | 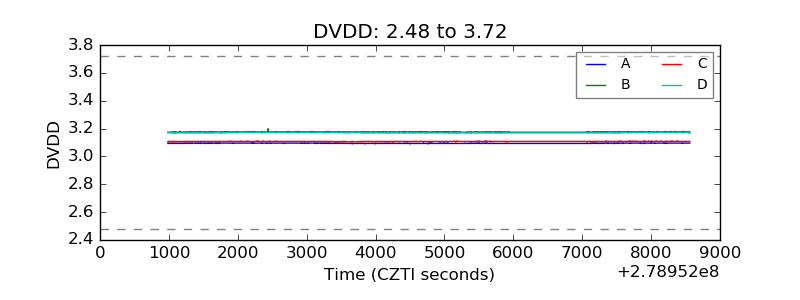 |
| Temperature 1 | 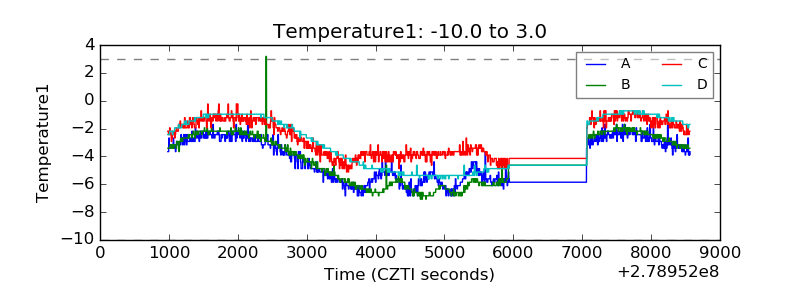 |
| Veto HV Monitor | 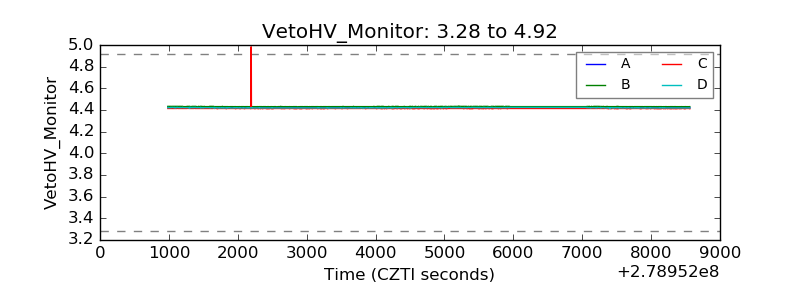 |
| Veto LLD | 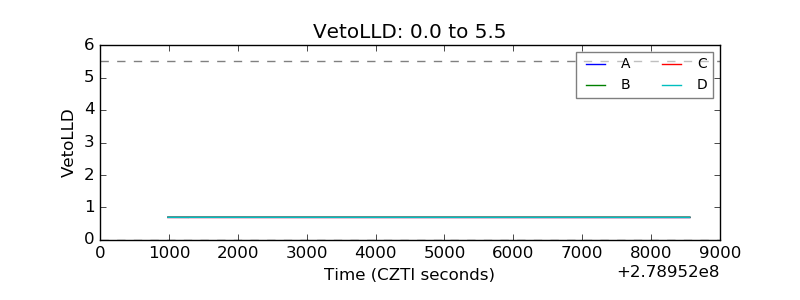 |
| Alpha Counter | 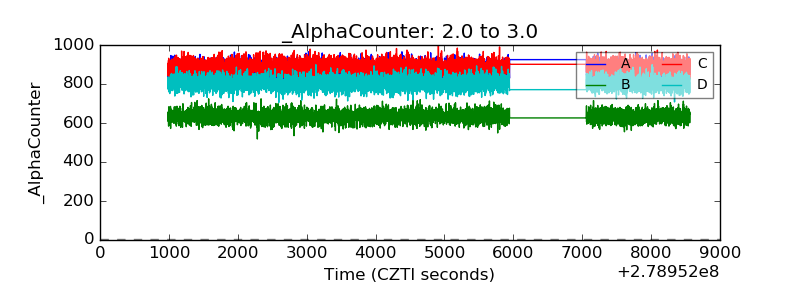 |
| _CPM_Rate | 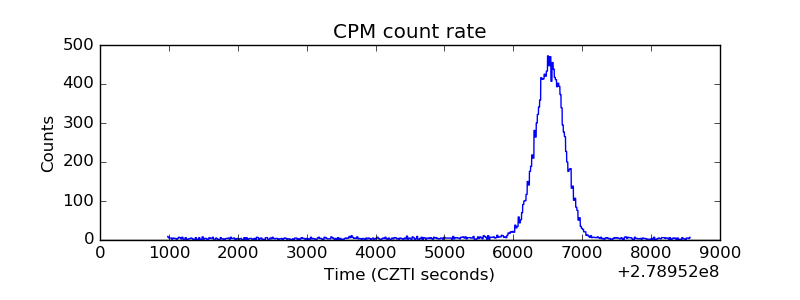 |
| CZT Counter | 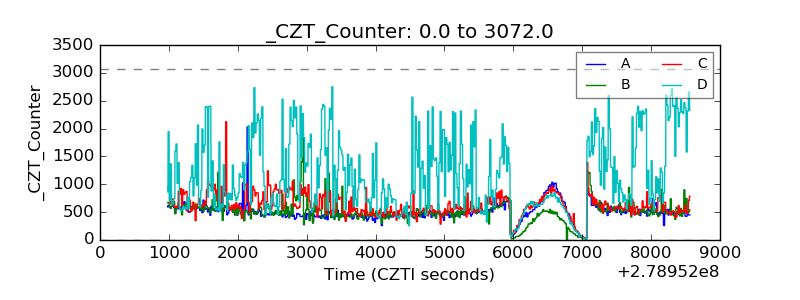 |
| +2.5 Volts monitor |  |
| +5 Volts monitor | 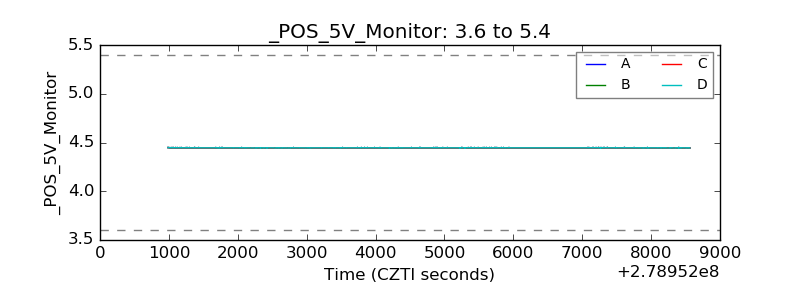 |
| _ROLL_ROT | 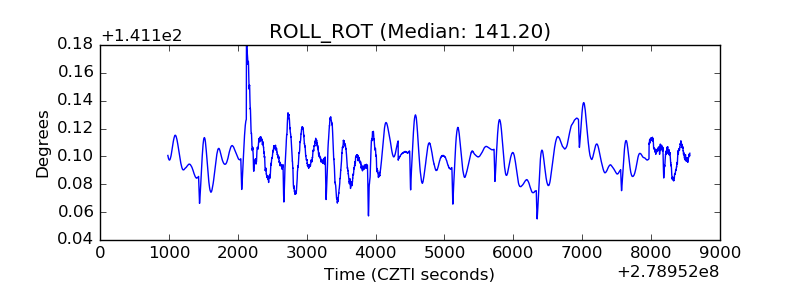 |
| _Roll_DEC | 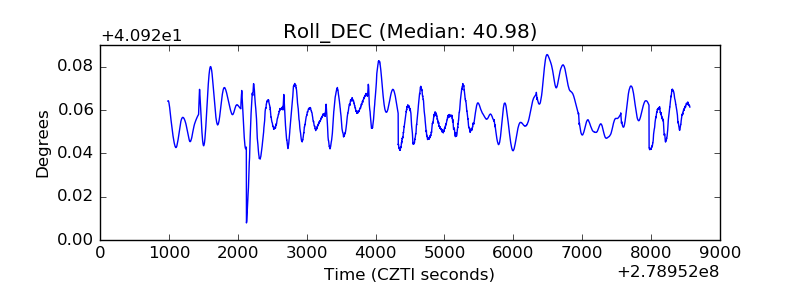 |
| _Roll_RA | 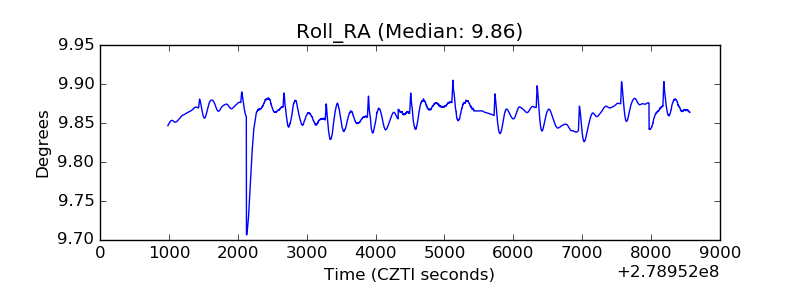 |
| Veto Counter | 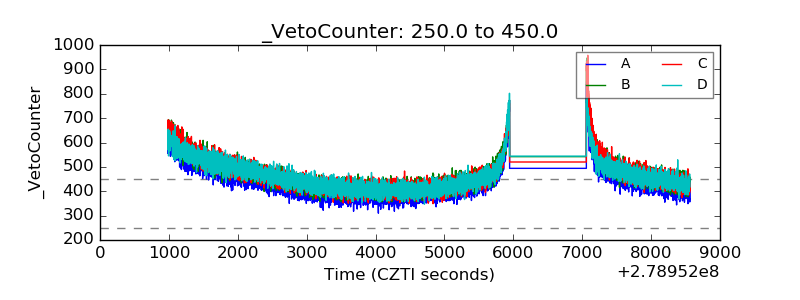 |