| Param | Original file | Final file |
|---|---|---|
| Filename | modeM0/AS1A05_004T05_9000002488_16766cztM0_level2.evt | modeM0/AS1A05_004T05_9000002488_16766cztM0_level2_quad_clean.evt |
| Size (bytes) | 630,034,560 | 104,981,760 |
| Size | 600.8 MB | 100.1 MB |
| Events in quadrant A | 3,489,911 | 682,802 |
| Events in quadrant B | 3,873,834 | 681,985 |
| Events in quadrant C | 6,352,867 | 645,662 |
| Events in quadrant D | 4,857,640 | 648,028 |
| Mode SS | |||
|---|---|---|---|
| Quadrant | BADHDUFLAG | Total packets | Discarded packets |
| A | 0 | 154 | 0 |
| B | 0 | 154 | 0 |
| C | 0 | 154 | 0 |
| D | 0 | 154 | 0 |
| Mode M9 | |||
|---|---|---|---|
| Quadrant | BADHDUFLAG | Total packets | Discarded packets |
| A | 0 | 7 | 0 |
| B | 0 | 7 | 0 |
| C | 0 | 7 | 0 |
| D | 0 | 7 | 0 |
| Mode M0 | |||
|---|---|---|---|
| Quadrant | BADHDUFLAG | Total packets | Discarded packets |
| A | 0 | 15505 | 3 |
| B | 0 | 16435 | 2 |
| C | 0 | 24186 | 2 |
| D | 0 | 19506 | 2 |
| Quadrant | Total seconds | Saturated seconds | Saturation percentage |
|---|---|---|---|
| A | 7481 | 52 | 0.695094% |
| B | 7481 | 95 | 1.269884% |
| C | 7481 | 447 | 5.975137% |
| D | 7481 | 233 | 3.114557% |
Noise dominated data is calculated using 1-second bins in cleaned event files. If a bin has >2000 counts, and if more than 50% of those come from <1% of pixels, then it is considered to be noise-dominated and hence unusable.
| Quadrant | # 1 sec bins | Bins with >0 counts | Bins with >2000 counts | High rate bins dominated by noise | Noise dominated (total time) | Noise dominated (detector-on time) | Marked lightcurve |
|---|---|---|---|---|---|---|---|
| A | 8182 | 7484 | 0 | 0 | 0.00% | 0.00% | 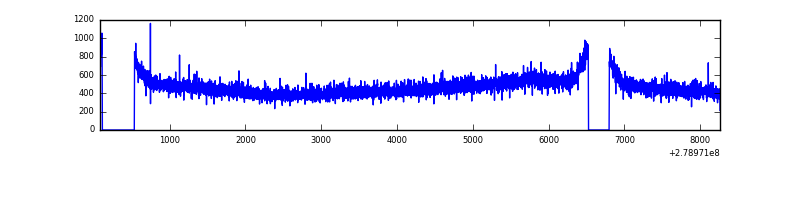 |
| B | 8182 | 7484 | 15 | 15 | 0.18% | 0.20% | 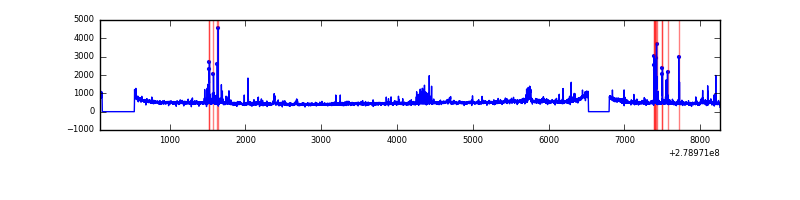 |
| C | 8182 | 7484 | 6 | 6 | 0.07% | 0.08% | 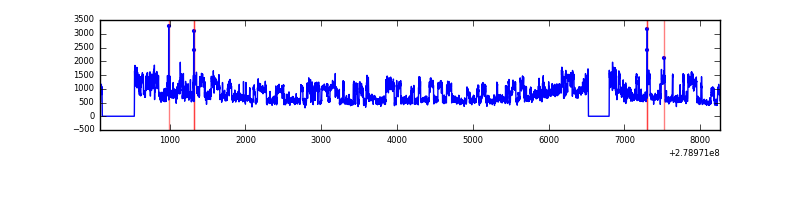 |
| D | 8182 | 7484 | 186 | 186 | 2.27% | 2.49% | 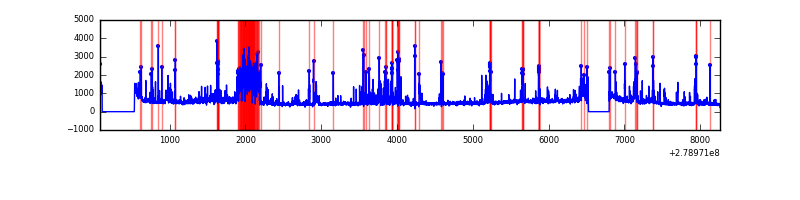 |
Top three noisy pixels from each quadrant. If the there are fewer than three noisy pixels in the level2.evt file, extra rows are filled as -1
| Pixel properties | Quadrant properties | ||||||
|---|---|---|---|---|---|---|---|
| Quadrant | DetID | PixID | Counts | Sigma | Mean | Median | Sigma |
| A | 0 | 226 | 8158 | 39.44 | 906 | 887 | 184.4 |
| A | 3 | 1 | 7095 | 33.67 | 906 | 887 | 184.4 |
| A | 12 | 194 | 6623 | 31.11 | 906 | 887 | 184.4 |
| B | 15 | 35 | 220173 | 1251.72 | 903 | 880 | 175.2 |
| B | 3 | 209 | 20438 | 111.64 | 903 | 880 | 175.2 |
| B | 12 | 111 | 20355 | 111.16 | 903 | 880 | 175.2 |
| C | 3 | 233 | 2711867 | 13454.27 | 861 | 868 | 201.5 |
| C | 0 | 207 | 143942 | 710.05 | 861 | 868 | 201.5 |
| C | 14 | 238 | 130924 | 645.45 | 861 | 868 | 201.5 |
| D | 1 | 52 | 964781 | 4468.27 | 879 | 851 | 215.7 |
| D | 13 | 232 | 321841 | 1487.94 | 879 | 851 | 215.7 |
| D | 11 | 176 | 120463 | 554.46 | 879 | 851 | 215.7 |
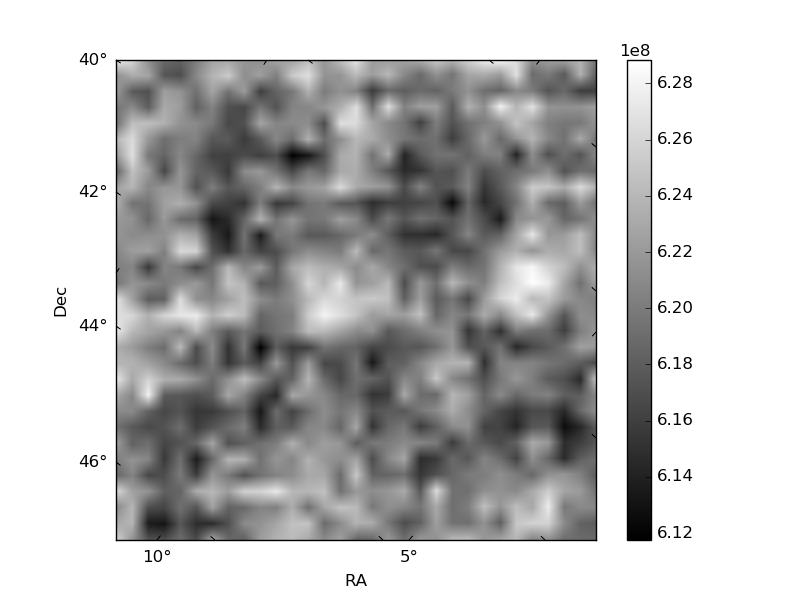
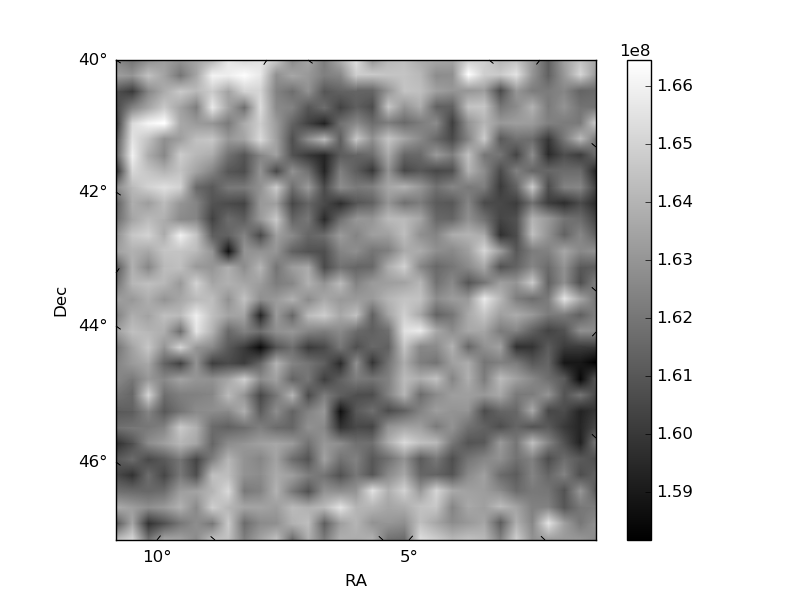
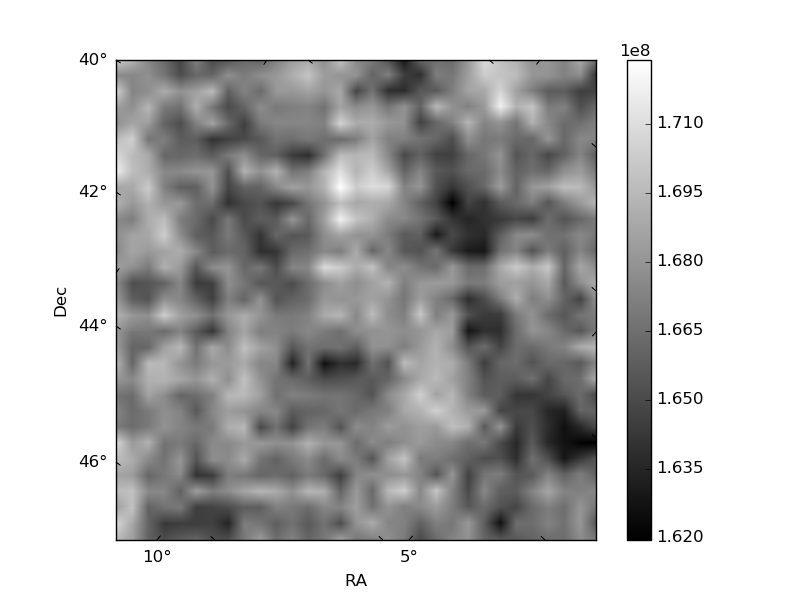
Histogram calculated using DETX and DETY for each event in the final _common_clean file
| Quadrant A | 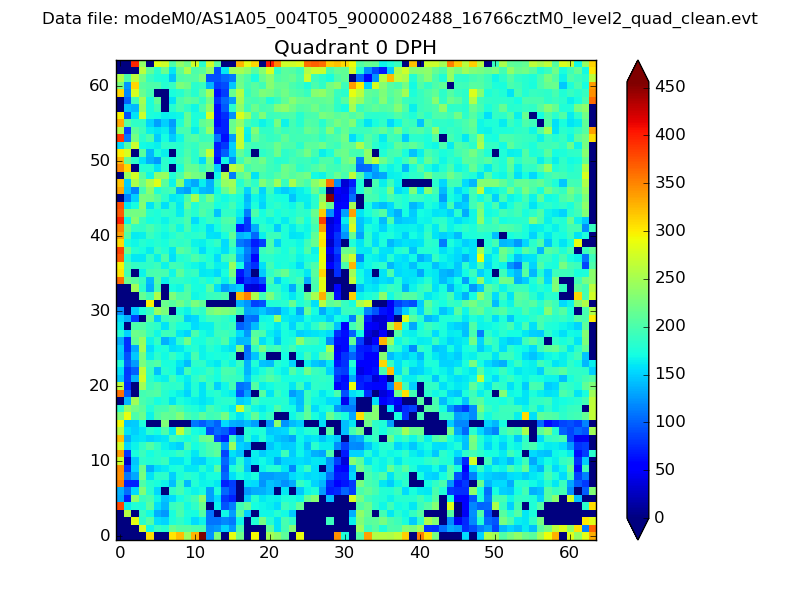 |
 |
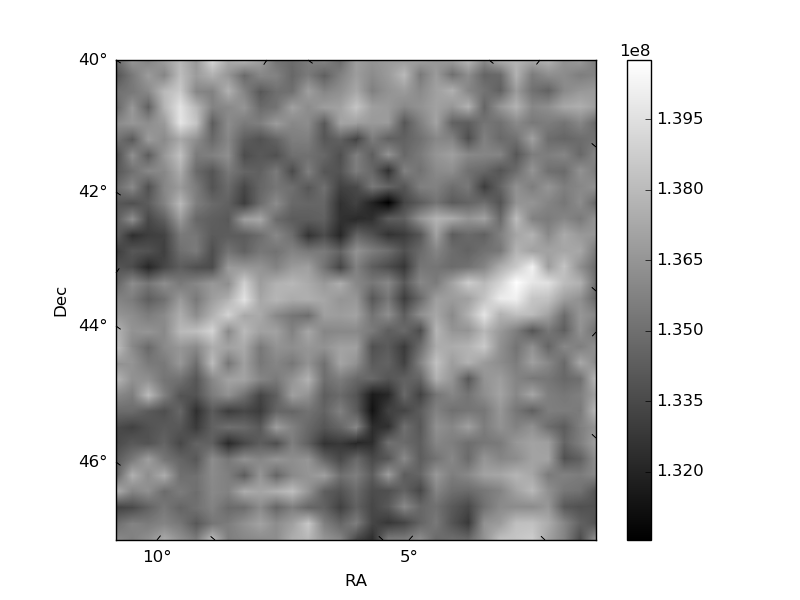
Quadrant B |
|---|---|---|---|
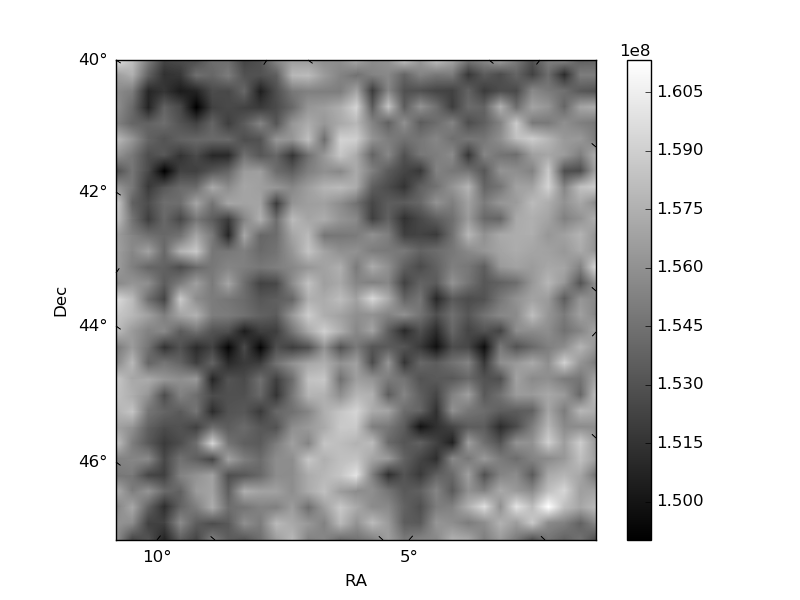
| Quadrant D | 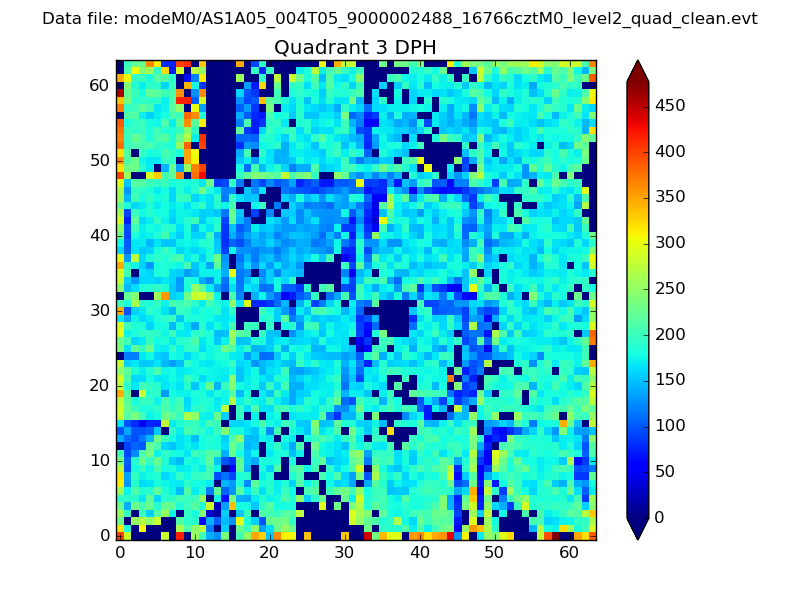 |
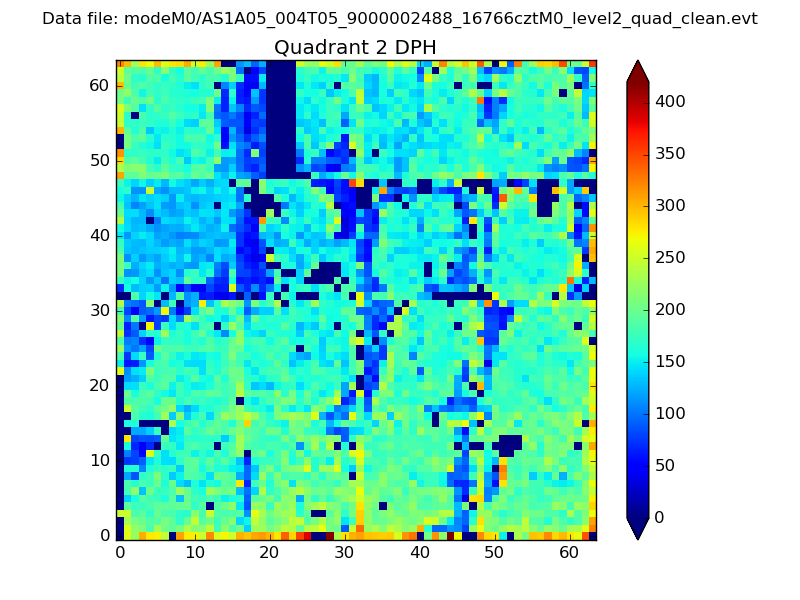 |
Quadrant C |
| Plot type | Count rate plots | Images |
|---|---|---|
| Comparison with Poisson distribution Blue bars denote a histogram of data divided into 1 sec bins. Red curve is a Poisson curve with rate = median count rate of data. |
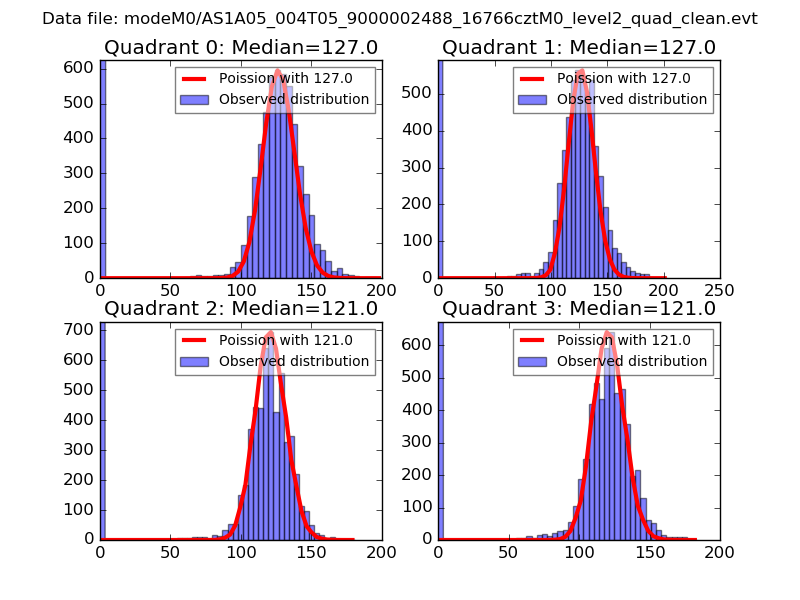 |
 |
| Quadrant-wise count rates Data is divided into 100 sec bins |
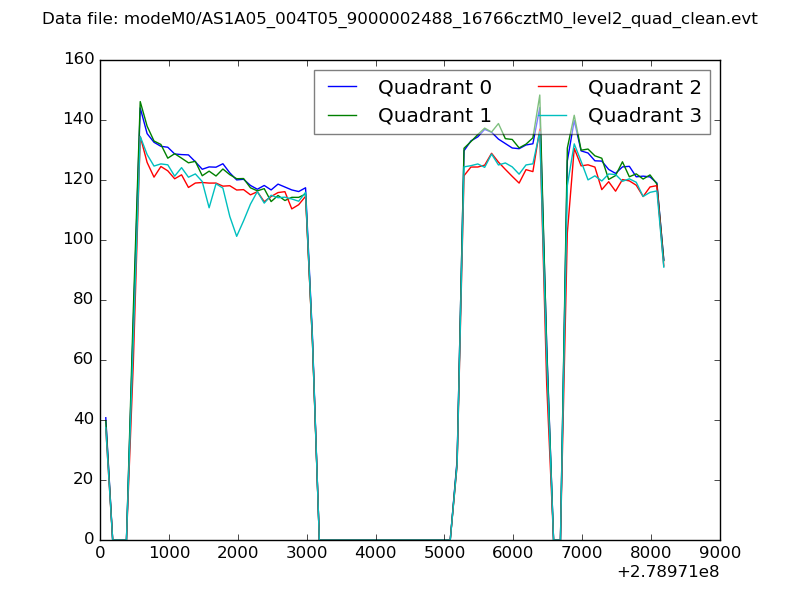 |
|
| Module-wise count rates for Quadrant A Data is divided into 100 sec bins |
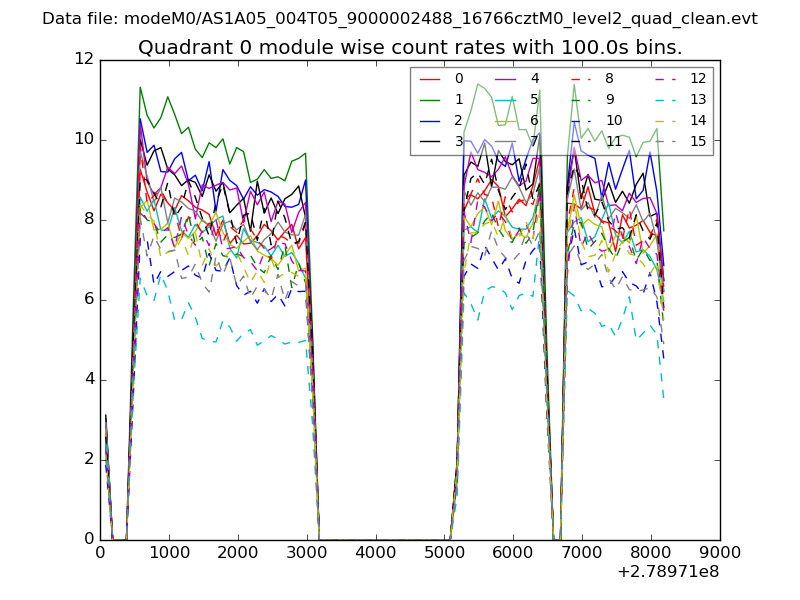 |
 |
| Module-wise count rates for Quadrant B Data is divided into 100 sec bins |
 |
 |
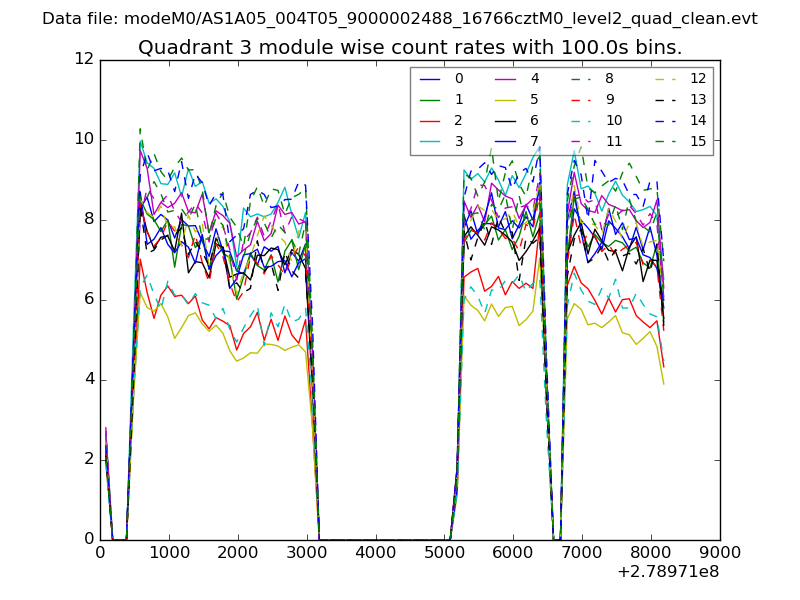
| Module-wise count rates for Quadrant C Data is divided into 100 sec bins |
 |
 |
| Module-wise count rates for Quadrant D Data is divided into 100 sec bins |
 |
 |
| Parameter | Plot |
|---|---|
| CZT HV Monitor |  |
| D_VDD | 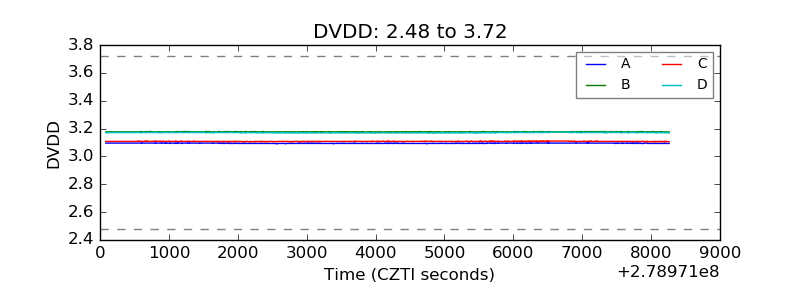 |
| Temperature 1 | 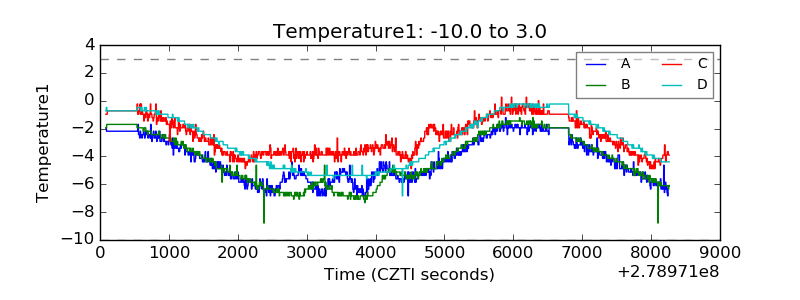 |
| Veto HV Monitor | 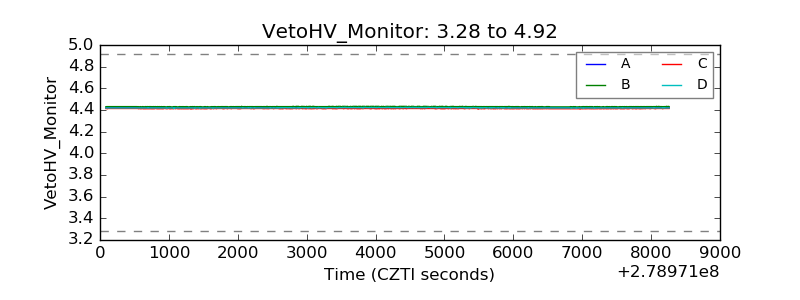 |
| Veto LLD | 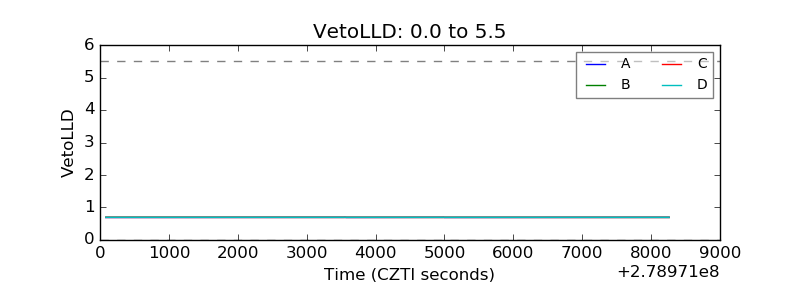 |
| Alpha Counter | 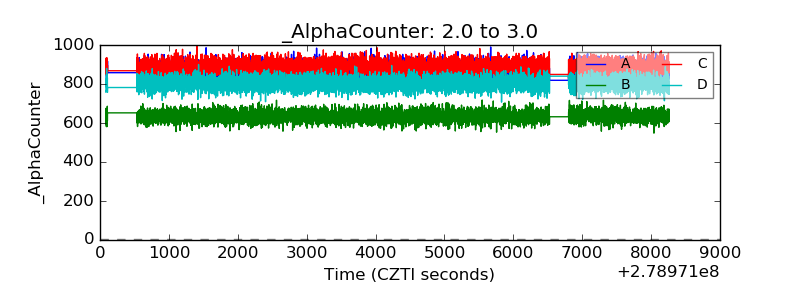 |
| _CPM_Rate | 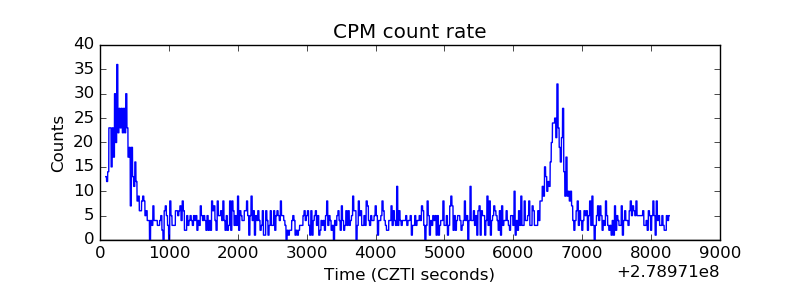 |
| CZT Counter | 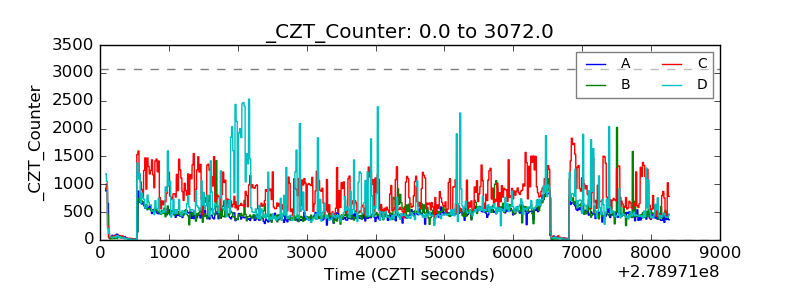 |
| +2.5 Volts monitor |  |
| +5 Volts monitor | 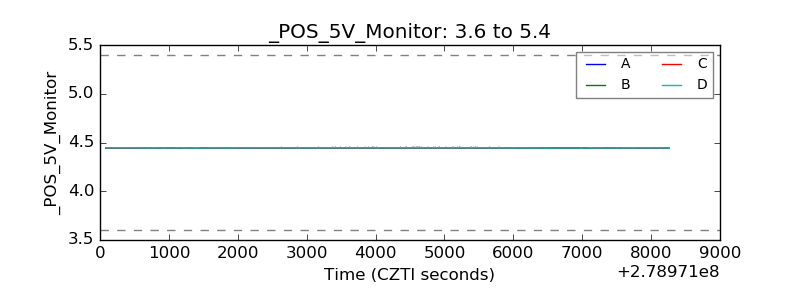 |
| _ROLL_ROT | 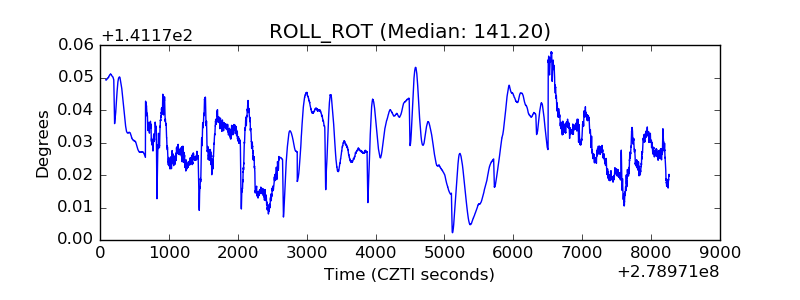 |
| _Roll_DEC | 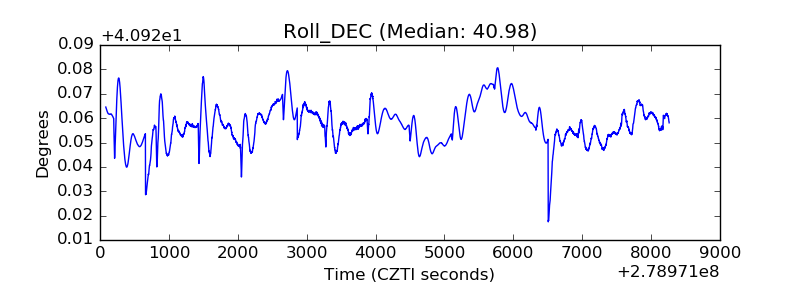 |
| _Roll_RA | 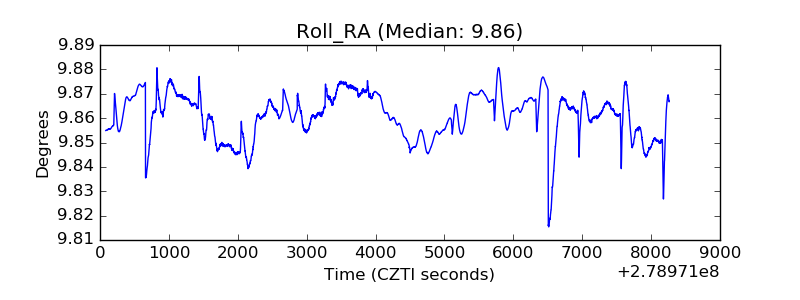 |
| Veto Counter | 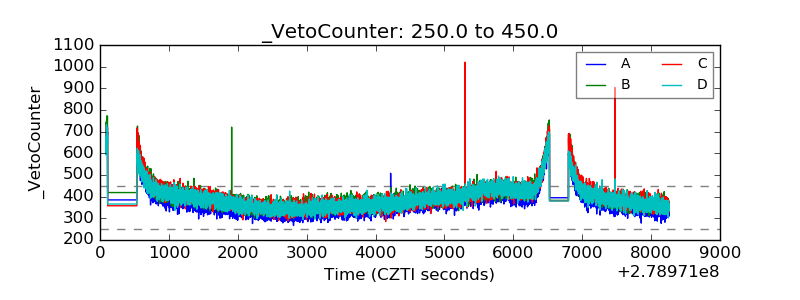 |