| Param | Original file | Final file |
|---|---|---|
| Filename | modeM0/AS1A05_004T05_9000002488_16767cztM0_level2.evt | modeM0/AS1A05_004T05_9000002488_16767cztM0_level2_quad_clean.evt |
| Size (bytes) | 612,089,280 | 102,896,640 |
| Size | 583.7 MB | 98.1 MB |
| Events in quadrant A | 3,381,831 | 665,417 |
| Events in quadrant B | 3,722,978 | 666,114 |
| Events in quadrant C | 5,817,825 | 640,255 |
| Events in quadrant D | 5,112,836 | 628,719 |
| Mode SS | |||
|---|---|---|---|
| Quadrant | BADHDUFLAG | Total packets | Discarded packets |
| A | 0 | 150 | 0 |
| B | 0 | 150 | 0 |
| C | 0 | 150 | 0 |
| D | 0 | 150 | 0 |
| Mode M9 | |||
|---|---|---|---|
| Quadrant | BADHDUFLAG | Total packets | Discarded packets |
| A | 0 | 5 | 0 |
| B | 0 | 5 | 0 |
| C | 0 | 5 | 0 |
| D | 0 | 6 | 0 |
| Mode M0 | |||
|---|---|---|---|
| Quadrant | BADHDUFLAG | Total packets | Discarded packets |
| A | 0 | 15186 | 3 |
| B | 0 | 15980 | 2 |
| C | 0 | 22248 | 2 |
| D | 0 | 20213 | 2 |
| Quadrant | Total seconds | Saturated seconds | Saturation percentage |
|---|---|---|---|
| A | 7408 | 19 | 0.256479% |
| B | 7408 | 56 | 0.755940% |
| C | 7408 | 424 | 5.723542% |
| D | 7408 | 333 | 4.495140% |
Noise dominated data is calculated using 1-second bins in cleaned event files. If a bin has >2000 counts, and if more than 50% of those come from <1% of pixels, then it is considered to be noise-dominated and hence unusable.
| Quadrant | # 1 sec bins | Bins with >0 counts | Bins with >2000 counts | High rate bins dominated by noise | Noise dominated (total time) | Noise dominated (detector-on time) | Marked lightcurve |
|---|---|---|---|---|---|---|---|
| A | 7820 | 7411 | 0 | 0 | 0.00% | 0.00% | 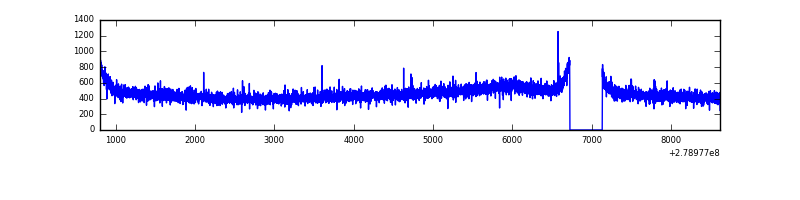 |
| B | 7820 | 7411 | 11 | 11 | 0.14% | 0.15% | 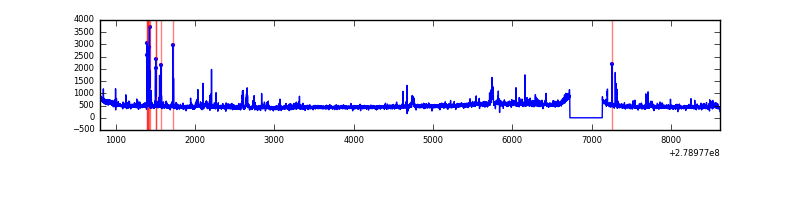 |
| C | 7820 | 7411 | 69 | 69 | 0.88% | 0.93% | 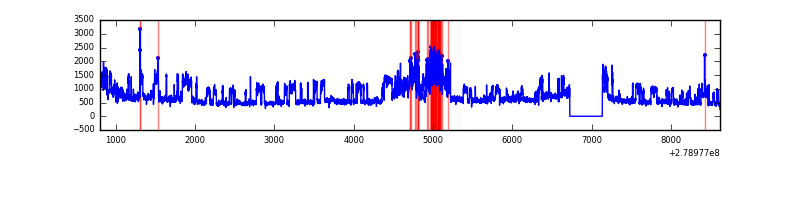 |
| D | 7820 | 7411 | 238 | 238 | 3.04% | 3.21% | 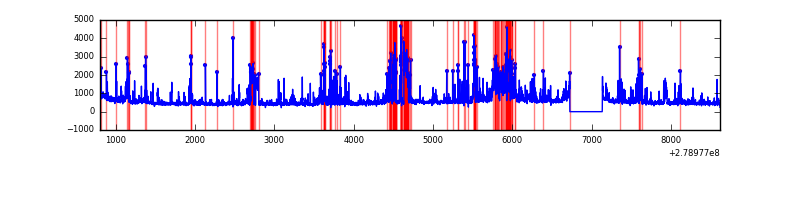 |
Top three noisy pixels from each quadrant. If the there are fewer than three noisy pixels in the level2.evt file, extra rows are filled as -1
| Pixel properties | Quadrant properties | ||||||
|---|---|---|---|---|---|---|---|
| Quadrant | DetID | PixID | Counts | Sigma | Mean | Median | Sigma |
| A | 3 | 1 | 10859 | 56.24 | 874 | 855 | 177.9 |
| A | 0 | 226 | 7715 | 38.56 | 874 | 855 | 177.9 |
| A | 12 | 194 | 6573 | 32.14 | 874 | 855 | 177.9 |
| B | 15 | 35 | 163221 | 969.27 | 875 | 850 | 167.5 |
| B | 3 | 209 | 32729 | 190.3 | 875 | 850 | 167.5 |
| B | 5 | 236 | 30736 | 178.4 | 875 | 850 | 167.5 |
| C | 3 | 233 | 2328834 | 11867.74 | 837 | 843 | 196.2 |
| C | 14 | 238 | 129237 | 654.53 | 837 | 843 | 196.2 |
| C | 0 | 207 | 87182 | 440.14 | 837 | 843 | 196.2 |
| D | 11 | 176 | 702252 | 3420.69 | 840 | 815 | 205.1 |
| D | 1 | 52 | 602465 | 2934.06 | 840 | 815 | 205.1 |
| D | 13 | 232 | 217172 | 1055.11 | 840 | 815 | 205.1 |
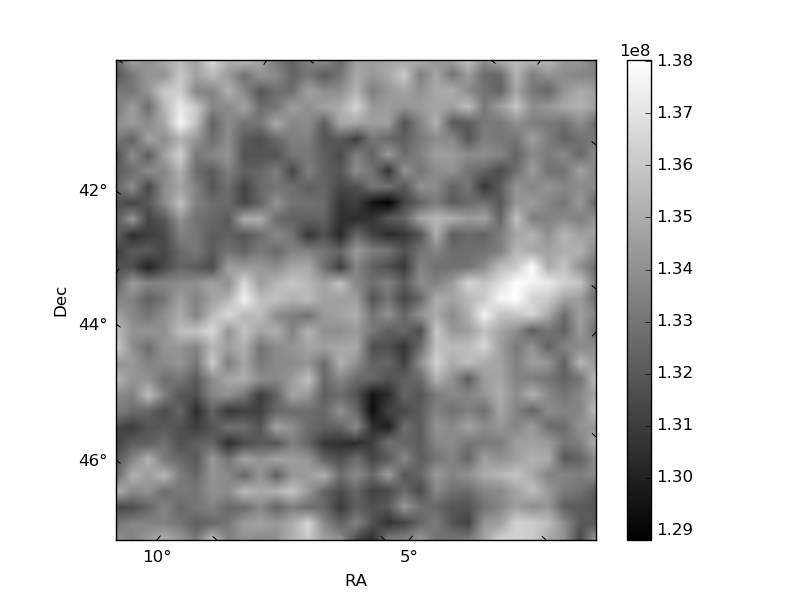
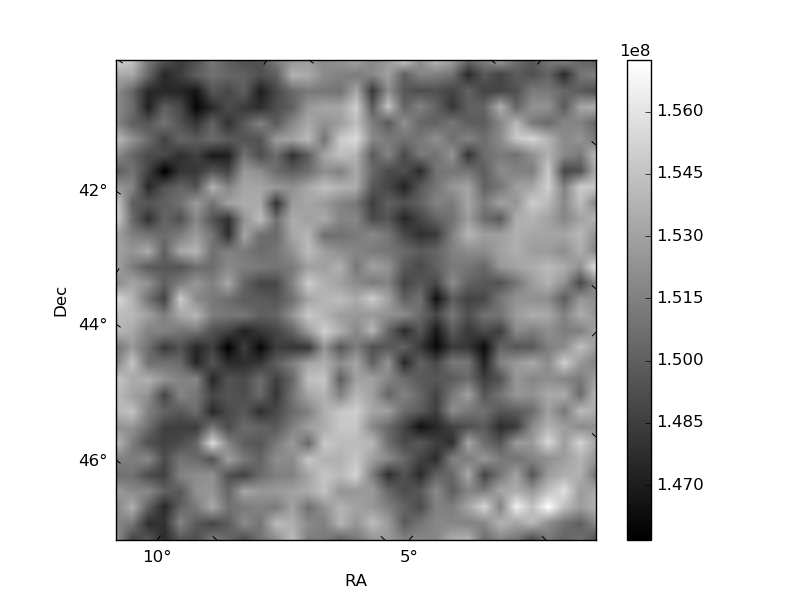
Histogram calculated using DETX and DETY for each event in the final _common_clean file
| Quadrant A | 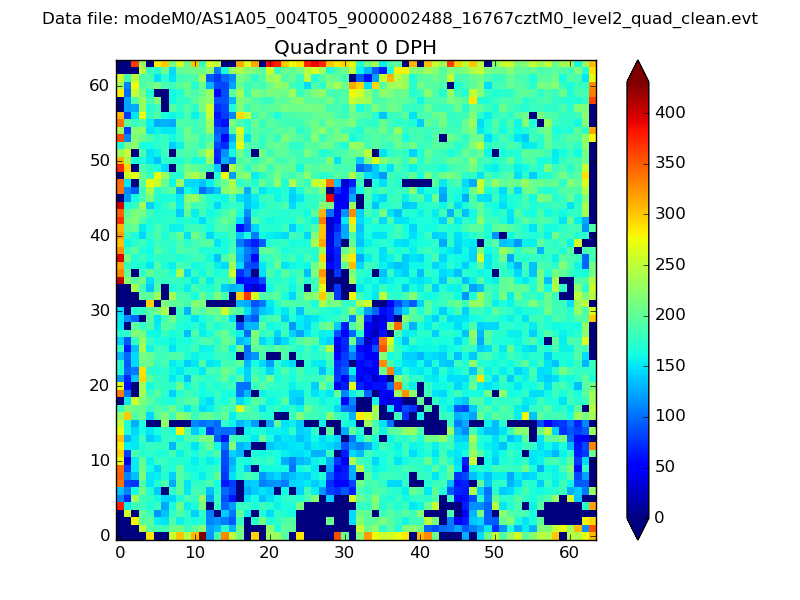 |
 |
Quadrant B |
|---|---|---|---|
| Quadrant D | 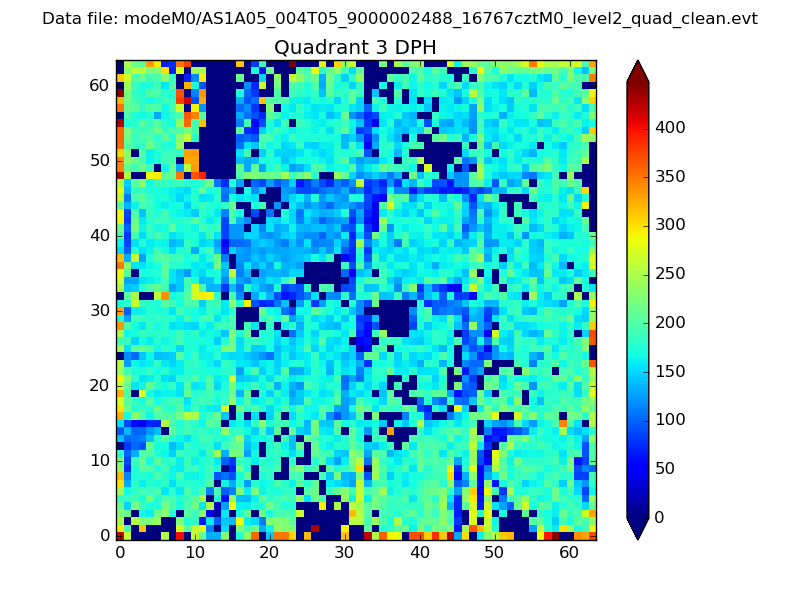 |
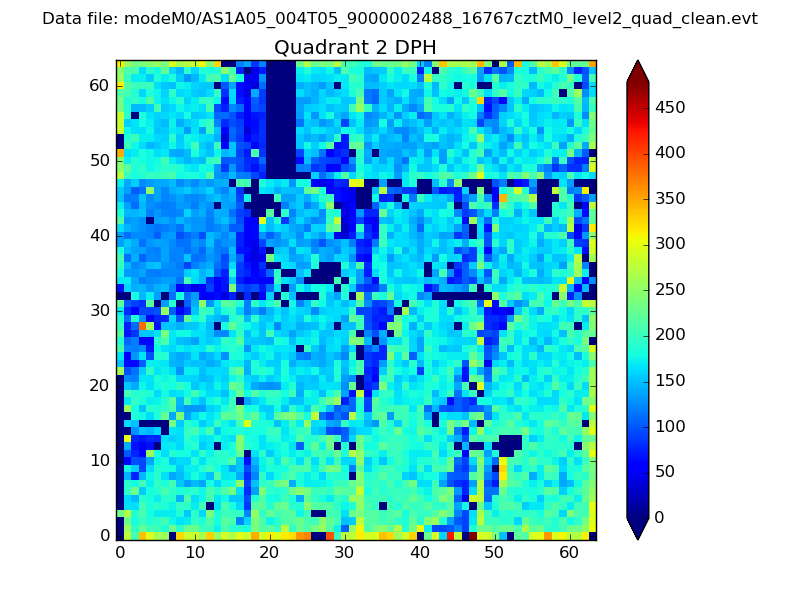 |
Quadrant C |
| Plot type | Count rate plots | Images |
|---|---|---|
| Comparison with Poisson distribution Blue bars denote a histogram of data divided into 1 sec bins. Red curve is a Poisson curve with rate = median count rate of data. |
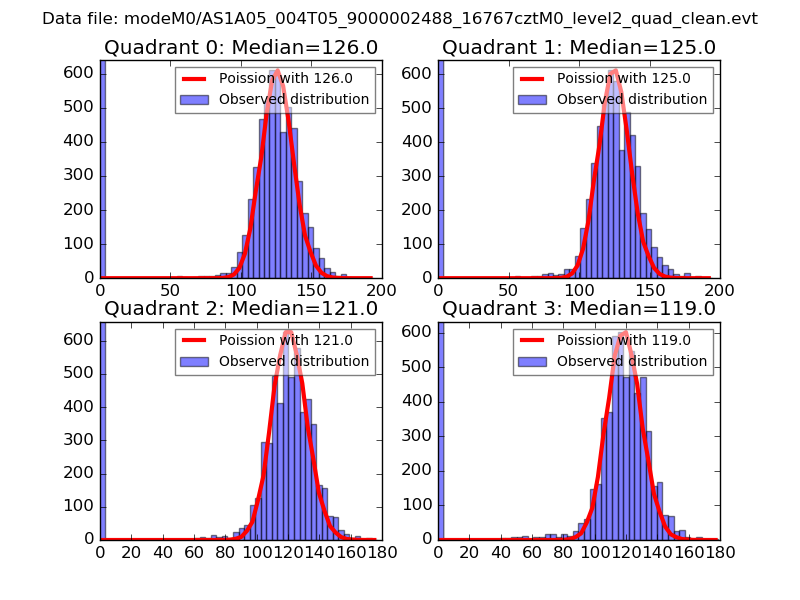 |
 |
| Quadrant-wise count rates Data is divided into 100 sec bins |
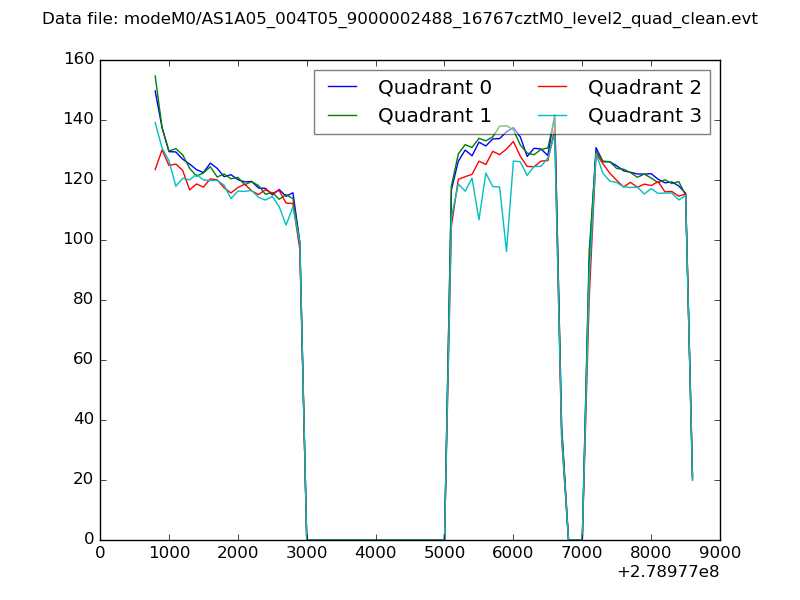 |
|
| Module-wise count rates for Quadrant A Data is divided into 100 sec bins |
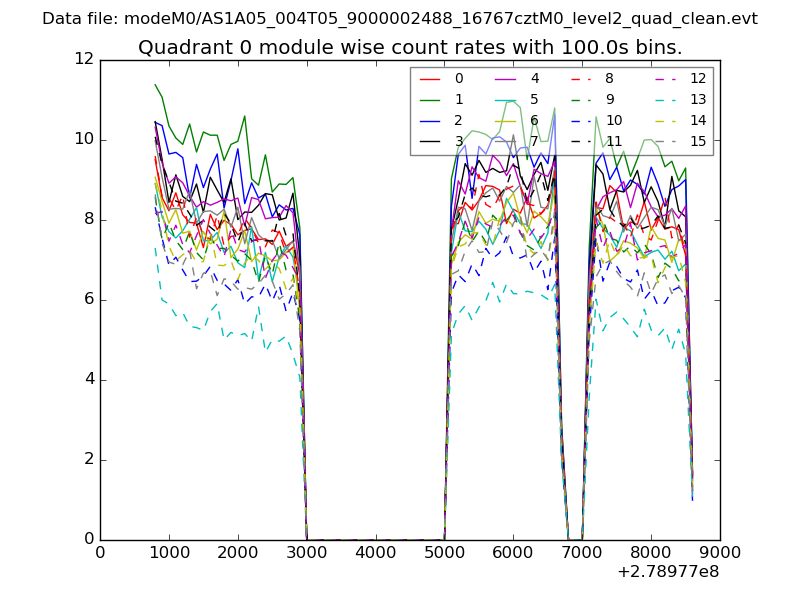 |
 |
| Module-wise count rates for Quadrant B Data is divided into 100 sec bins |
 |
 |
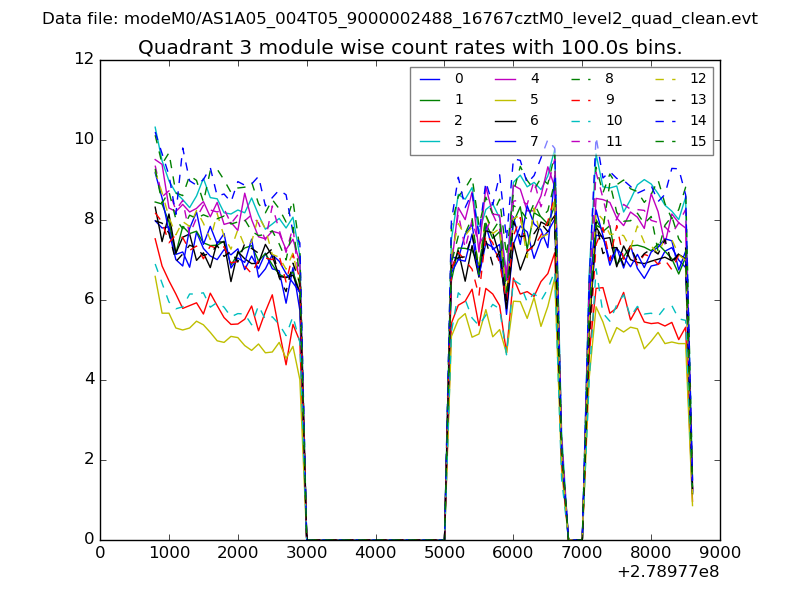
| Module-wise count rates for Quadrant C Data is divided into 100 sec bins |
 |
 |
| Module-wise count rates for Quadrant D Data is divided into 100 sec bins |
 |
 |
| Parameter | Plot |
|---|---|
| CZT HV Monitor | 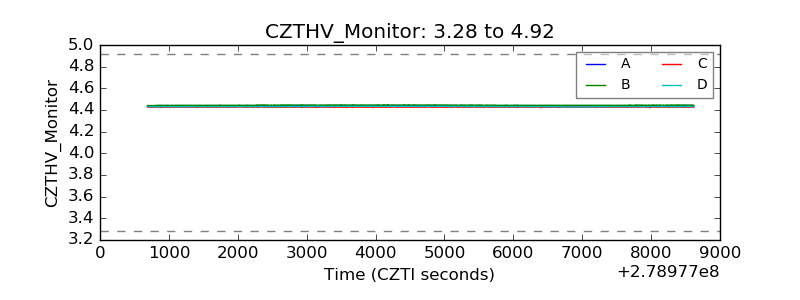 |
| D_VDD | 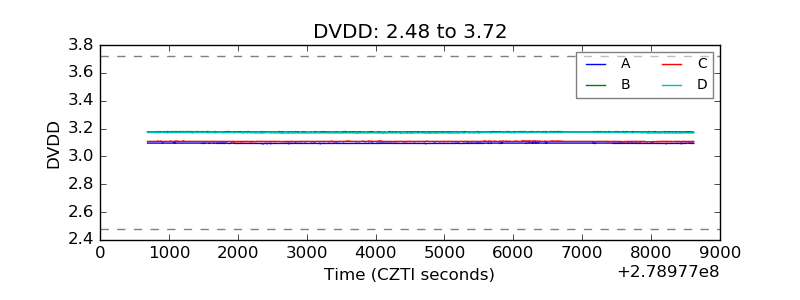 |
| Temperature 1 | 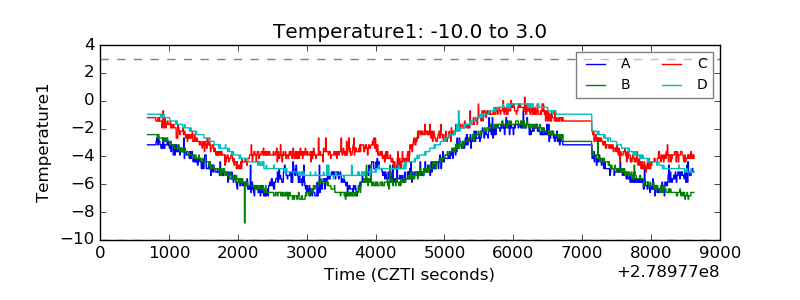 |
| Veto HV Monitor | 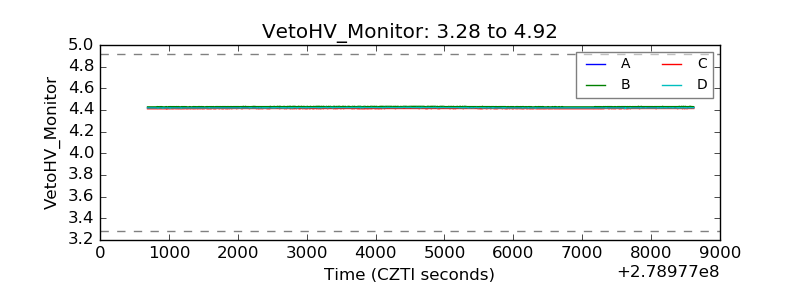 |
| Veto LLD | 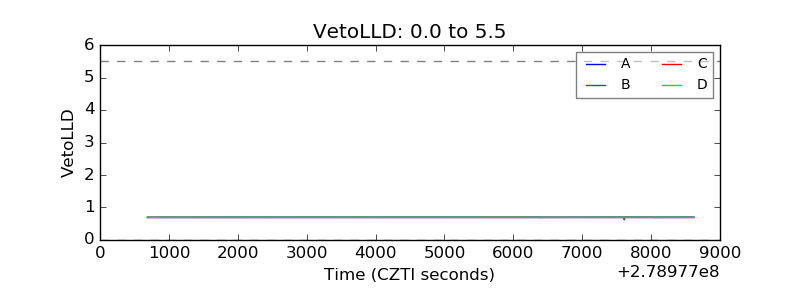 |
| Alpha Counter | 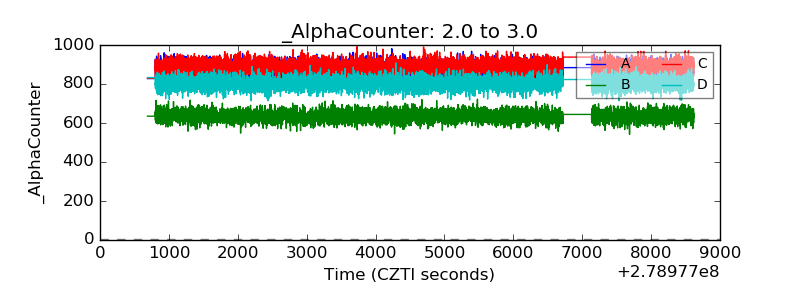 |
| _CPM_Rate | 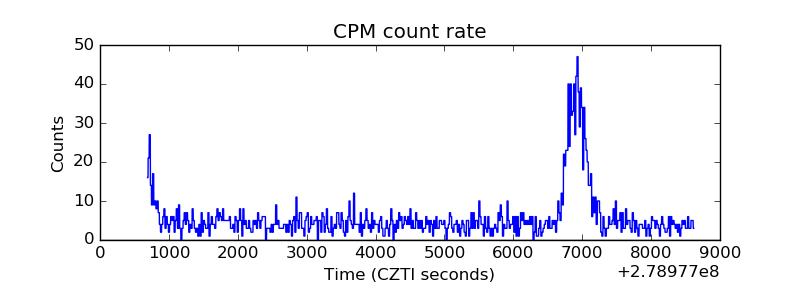 |
| CZT Counter | 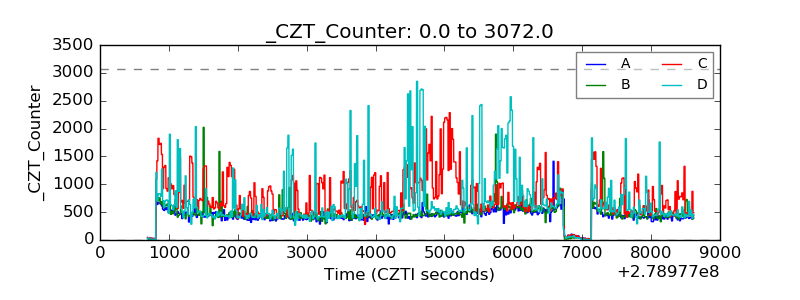 |
| +2.5 Volts monitor |  |
| +5 Volts monitor | 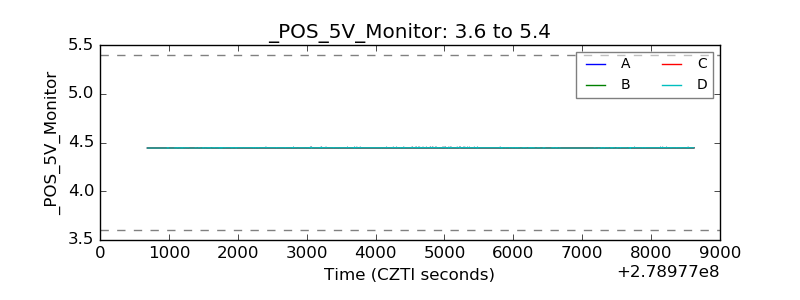 |
| _ROLL_ROT | 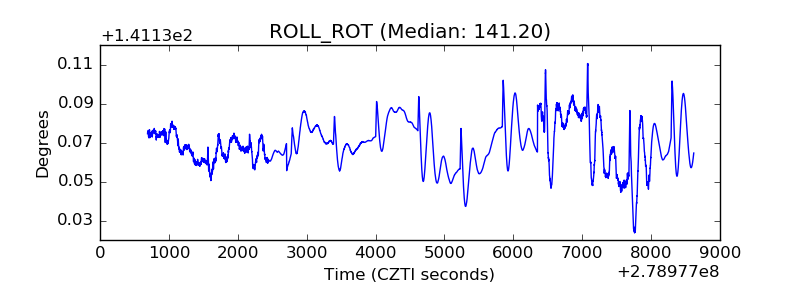 |
| _Roll_DEC | 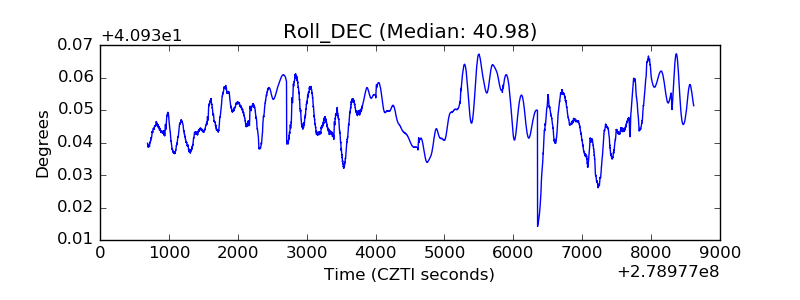 |
| _Roll_RA | 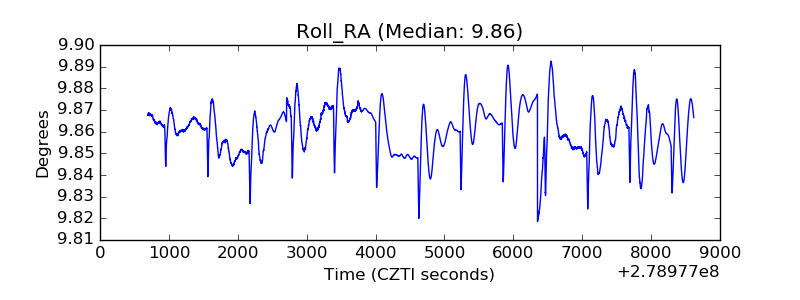 |
| Veto Counter | 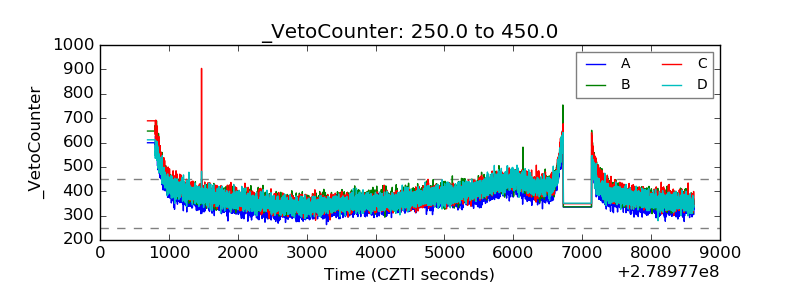 |