| Param | Original file | Final file |
|---|---|---|
| Filename | modeM0/AS1A05_004T05_9000002488_16770cztM0_level2.evt | modeM0/AS1A05_004T05_9000002488_16770cztM0_level2_quad_clean.evt |
| Size (bytes) | 642,358,080 | 74,787,840 |
| Size | 612.6 MB | 71.3 MB |
| Events in quadrant A | 5,377,881 | 438,232 |
| Events in quadrant B | 3,613,748 | 468,021 |
| Events in quadrant C | 5,334,670 | 448,180 |
| Events in quadrant D | 4,666,115 | 434,198 |
| Mode SS | |||
|---|---|---|---|
| Quadrant | BADHDUFLAG | Total packets | Discarded packets |
| A | 0 | 138 | 0 |
| B | 0 | 138 | 0 |
| C | 0 | 138 | 0 |
| D | 0 | 138 | 0 |
| Mode M9 | |||
|---|---|---|---|
| Quadrant | BADHDUFLAG | Total packets | Discarded packets |
| A | 0 | 14 | 0 |
| B | 0 | 14 | 0 |
| C | 0 | 14 | 0 |
| D | 0 | 15 | 0 |
| Mode M0 | |||
|---|---|---|---|
| Quadrant | BADHDUFLAG | Total packets | Discarded packets |
| A | 0 | 20397 | 3 |
| B | 0 | 14949 | 2 |
| C | 0 | 20765 | 2 |
| D | 0 | 18575 | 2 |
| Quadrant | Total seconds | Saturated seconds | Saturation percentage |
|---|---|---|---|
| A | 6827 | 792 | 11.600996% |
| B | 6827 | 79 | 1.157170% |
| C | 6827 | 154 | 2.255749% |
| D | 6827 | 261 | 3.823056% |
Noise dominated data is calculated using 1-second bins in cleaned event files. If a bin has >2000 counts, and if more than 50% of those come from <1% of pixels, then it is considered to be noise-dominated and hence unusable.
| Quadrant | # 1 sec bins | Bins with >0 counts | Bins with >2000 counts | High rate bins dominated by noise | Noise dominated (total time) | Noise dominated (detector-on time) | Marked lightcurve |
|---|---|---|---|---|---|---|---|
| A | 7718 | 6829 | 629 | 629 | 8.15% | 9.21% | 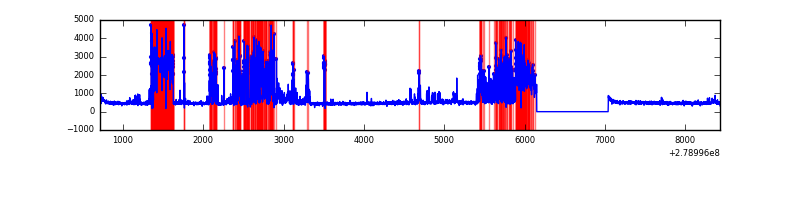 |
| B | 7718 | 6829 | 6 | 6 | 0.08% | 0.09% | 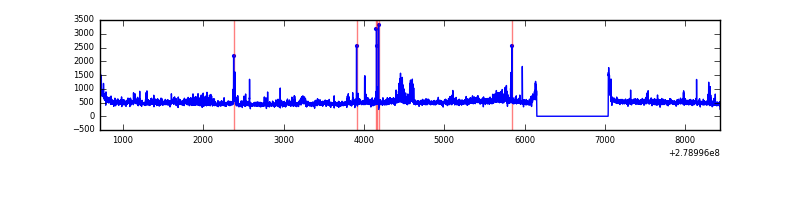 |
| C | 7718 | 6829 | 7 | 7 | 0.09% | 0.10% | 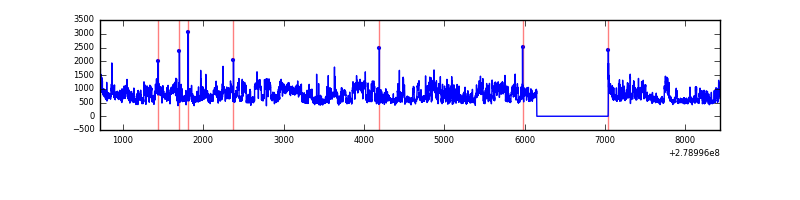 |
| D | 7718 | 6829 | 185 | 185 | 2.40% | 2.71% | 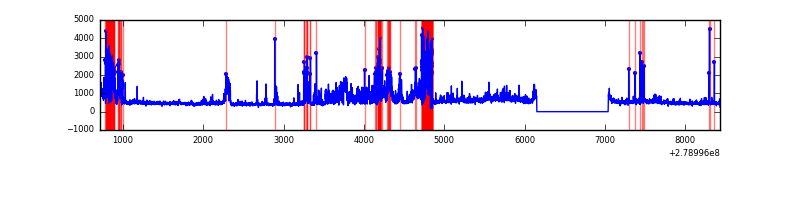 |
Top three noisy pixels from each quadrant. If the there are fewer than three noisy pixels in the level2.evt file, extra rows are filled as -1
| Pixel properties | Quadrant properties | ||||||
|---|---|---|---|---|---|---|---|
| Quadrant | DetID | PixID | Counts | Sigma | Mean | Median | Sigma |
| A | 15 | 174 | 2389283 | 15119.1 | 777 | 762 | 158.0 |
| A | 0 | 226 | 6853 | 38.56 | 777 | 762 | 158.0 |
| A | 12 | 194 | 5729 | 31.44 | 777 | 762 | 158.0 |
| B | 5 | 65 | 103057 | 645.12 | 815 | 795 | 158.5 |
| B | 5 | 236 | 71456 | 445.76 | 815 | 795 | 158.5 |
| B | 15 | 35 | 68555 | 427.46 | 815 | 795 | 158.5 |
| C | 3 | 233 | 1914438 | 10381.29 | 781 | 786 | 184.3 |
| C | 0 | 207 | 250103 | 1352.51 | 781 | 786 | 184.3 |
| C | 14 | 238 | 119661 | 644.88 | 781 | 786 | 184.3 |
| D | 12 | 110 | 996060 | 5209.96 | 782 | 761 | 191.0 |
| D | 1 | 52 | 317294 | 1656.91 | 782 | 761 | 191.0 |
| D | 11 | 176 | 297531 | 1553.46 | 782 | 761 | 191.0 |
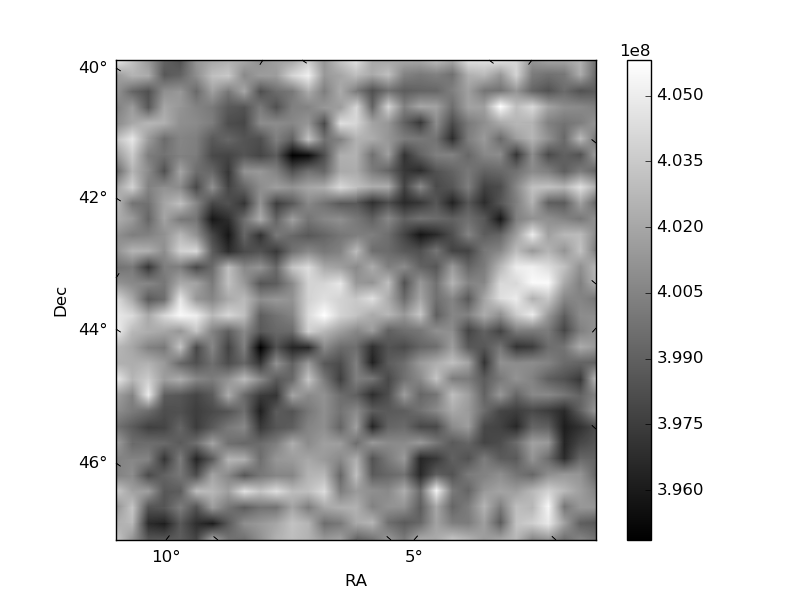
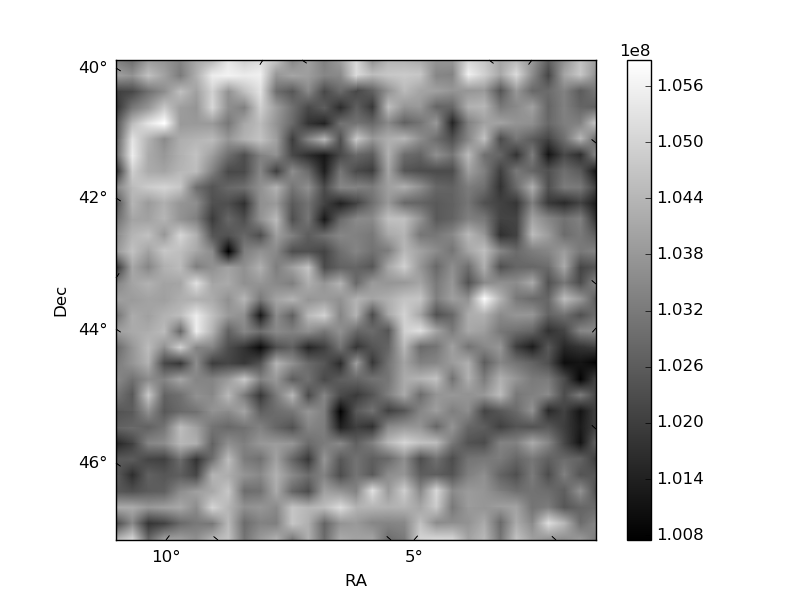
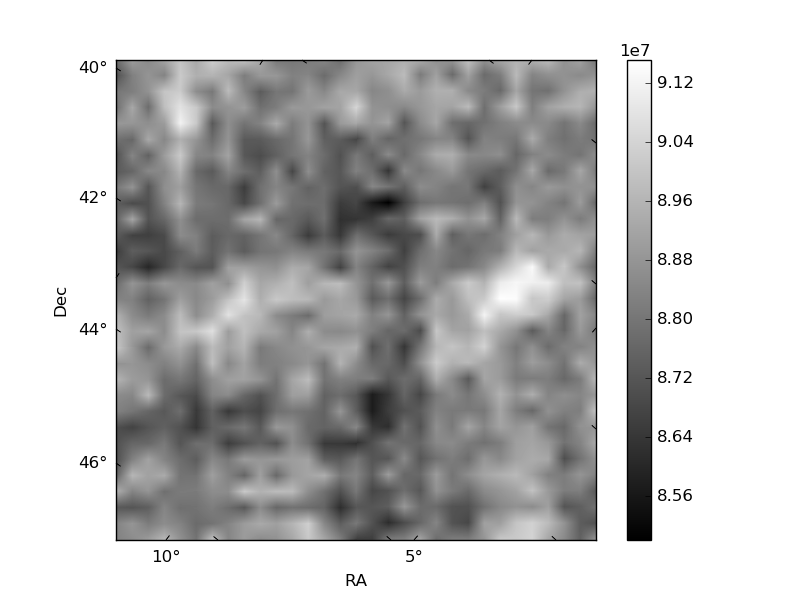
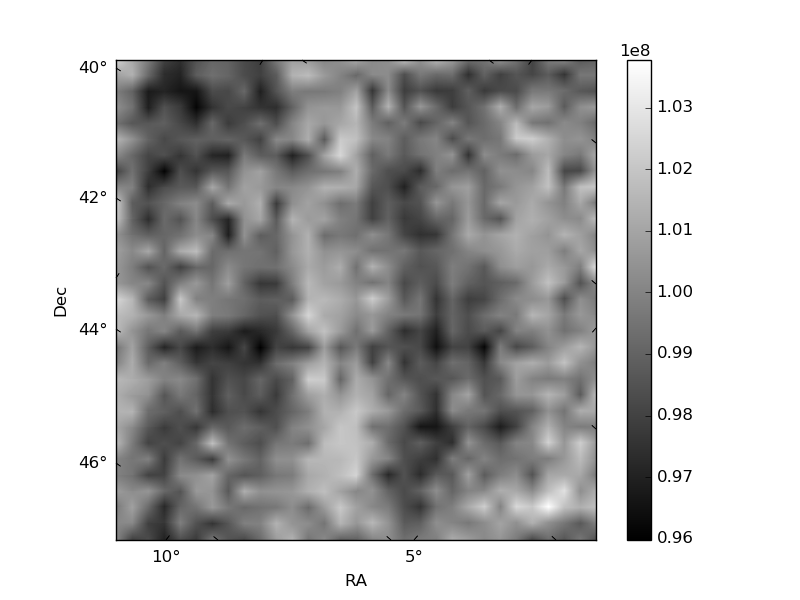
Histogram calculated using DETX and DETY for each event in the final _common_clean file
| Quadrant A | 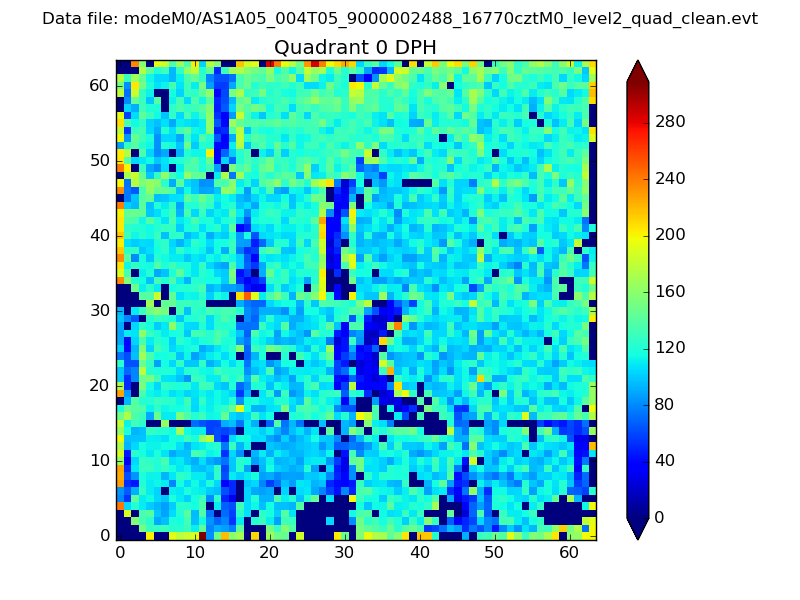 |
 |
Quadrant B |
|---|---|---|---|
| Quadrant D | 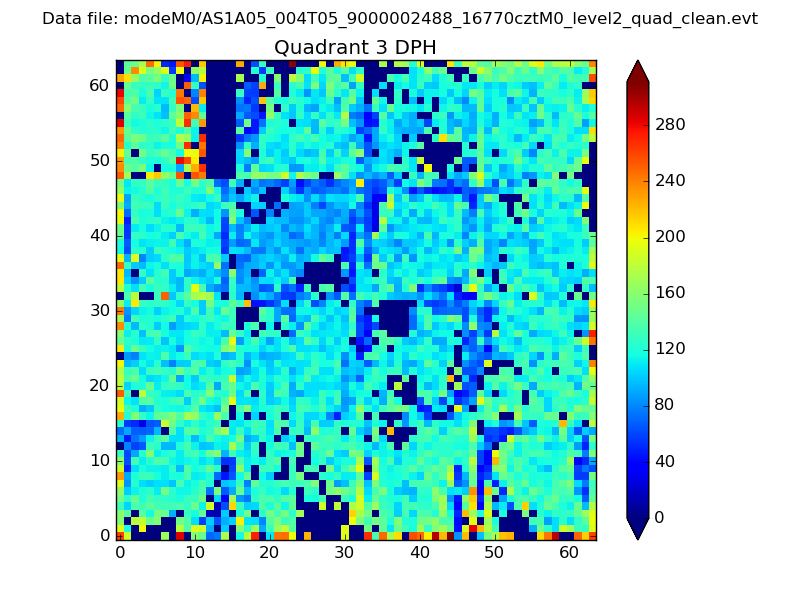 |
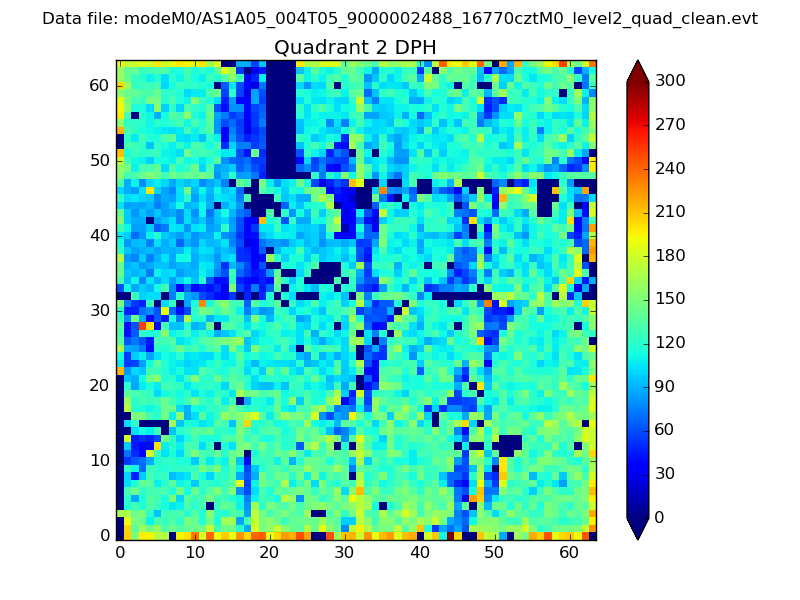 |
Quadrant C |
| Plot type | Count rate plots | Images |
|---|---|---|
| Comparison with Poisson distribution Blue bars denote a histogram of data divided into 1 sec bins. Red curve is a Poisson curve with rate = median count rate of data. |
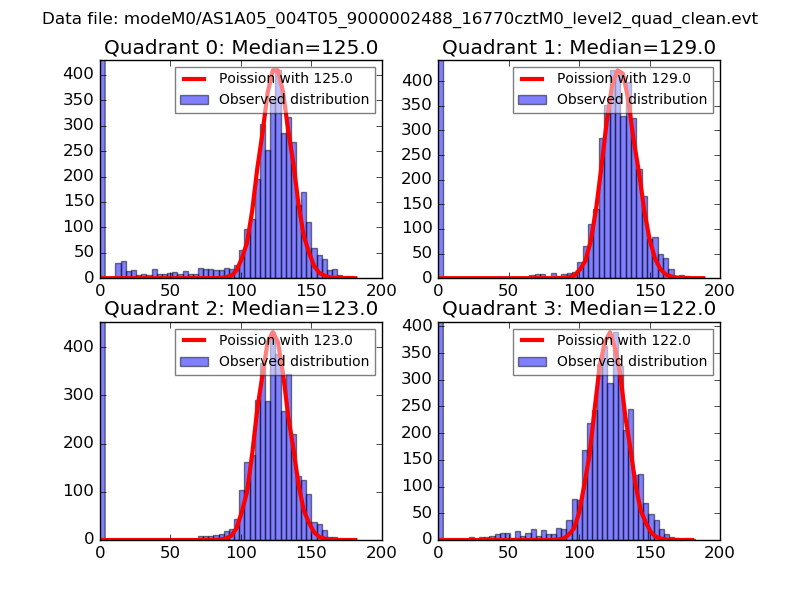 |
 |
| Quadrant-wise count rates Data is divided into 100 sec bins |
 |
|
| Module-wise count rates for Quadrant A Data is divided into 100 sec bins |
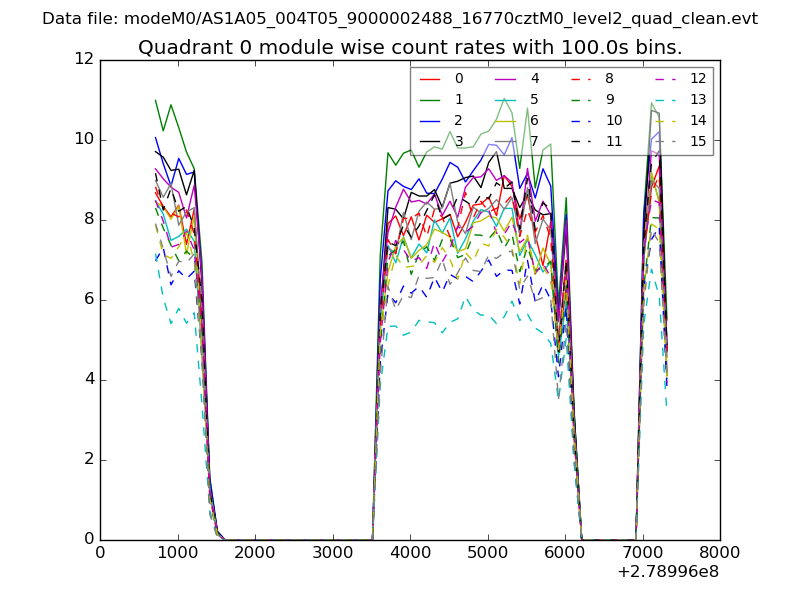 |
 |
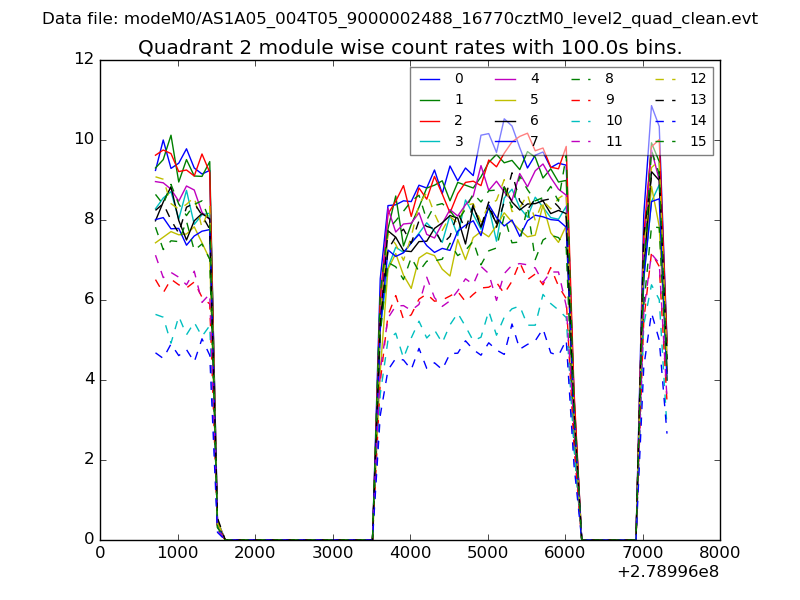
| Module-wise count rates for Quadrant B Data is divided into 100 sec bins |
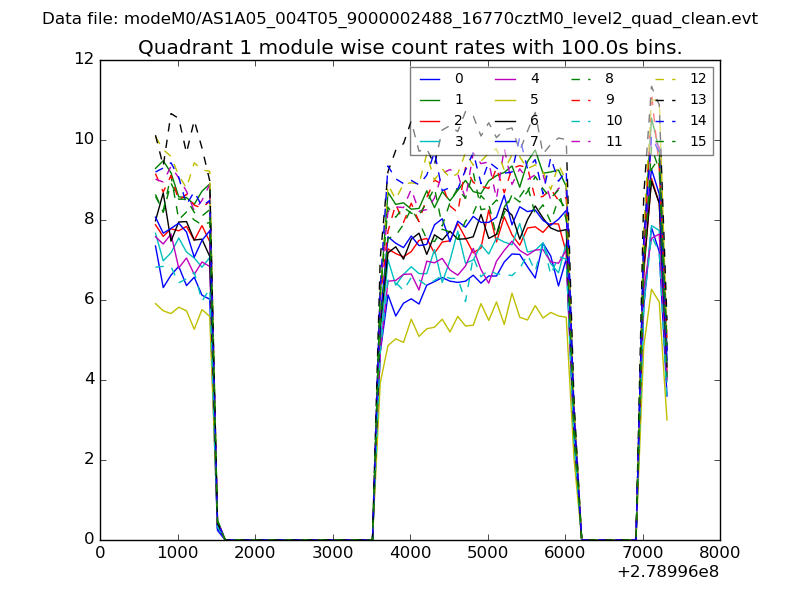 |
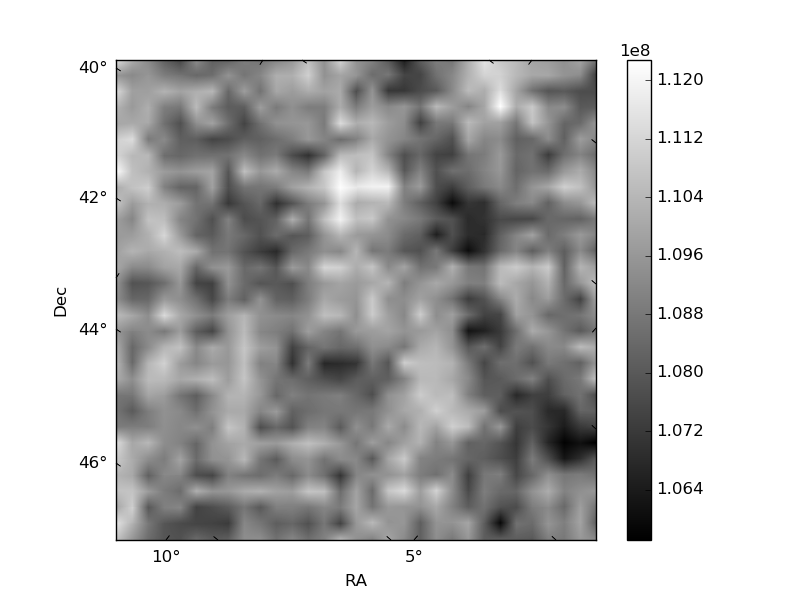 |
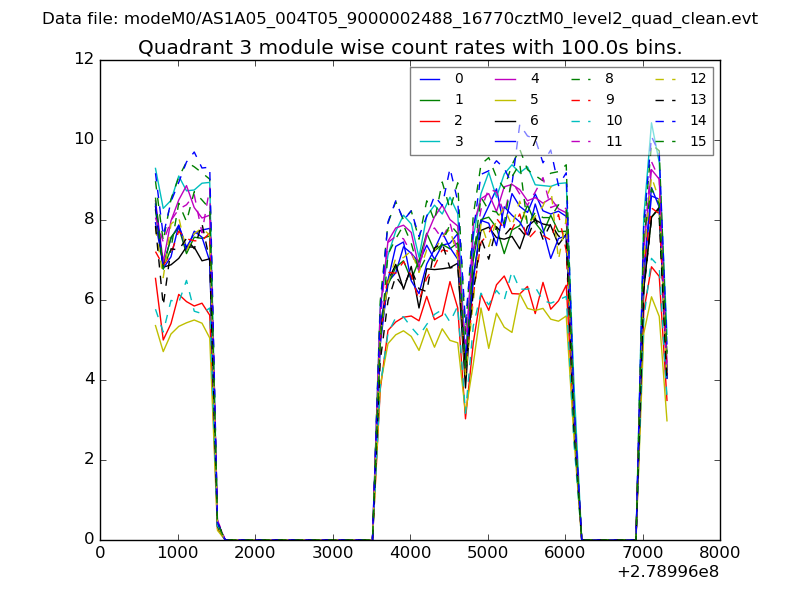
| Module-wise count rates for Quadrant C Data is divided into 100 sec bins |
 |
 |
| Module-wise count rates for Quadrant D Data is divided into 100 sec bins |
 |
 |
| Parameter | Plot |
|---|---|
| CZT HV Monitor | 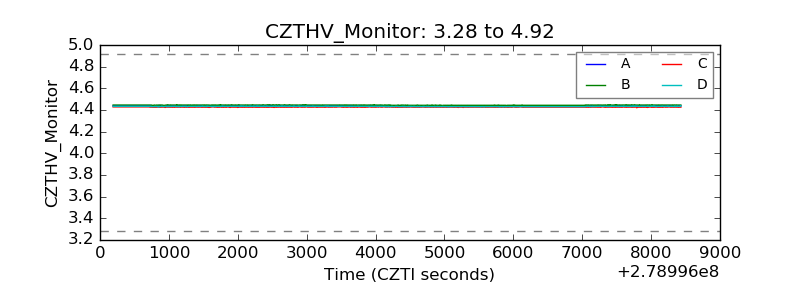 |
| D_VDD | 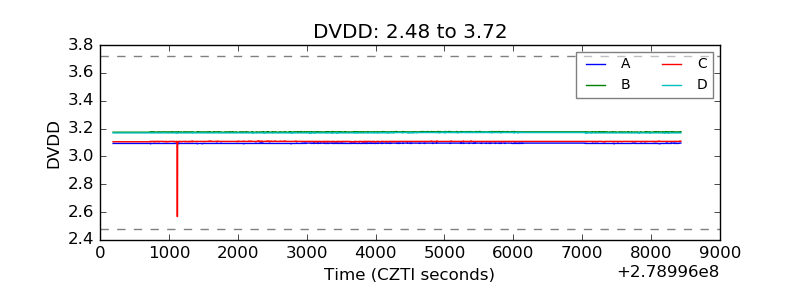 |
| Temperature 1 |  |
| Veto HV Monitor | 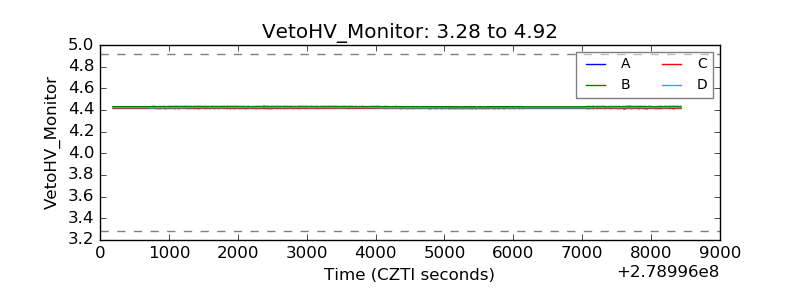 |
| Veto LLD | 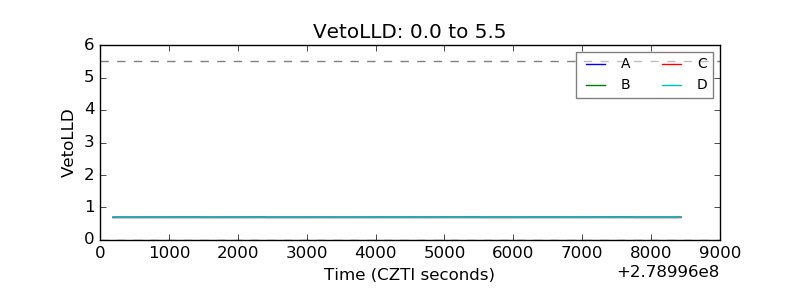 |
| Alpha Counter | 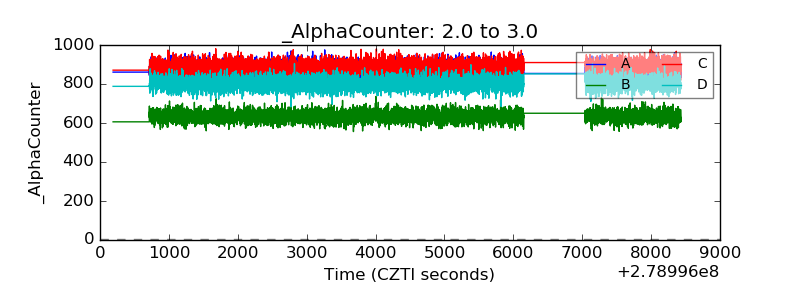 |
| _CPM_Rate | 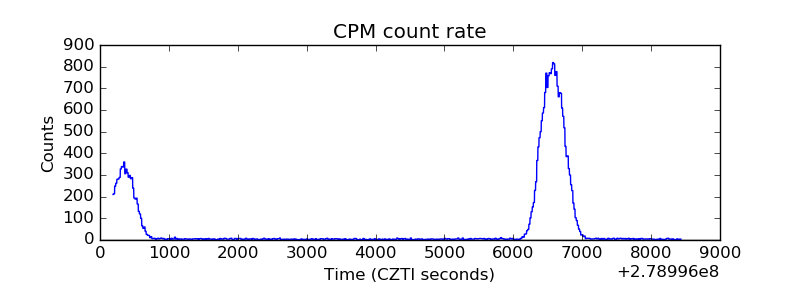 |
| CZT Counter | 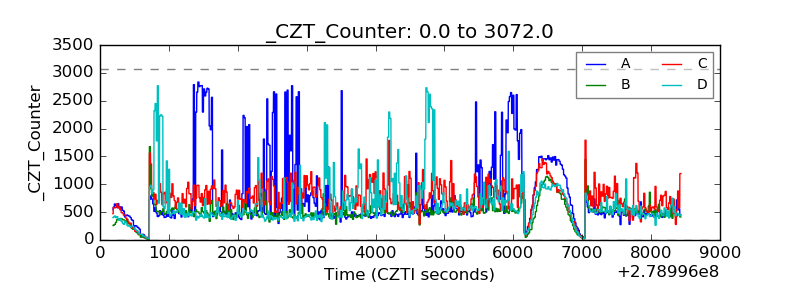 |
| +2.5 Volts monitor |  |
| +5 Volts monitor |  |
| _ROLL_ROT | 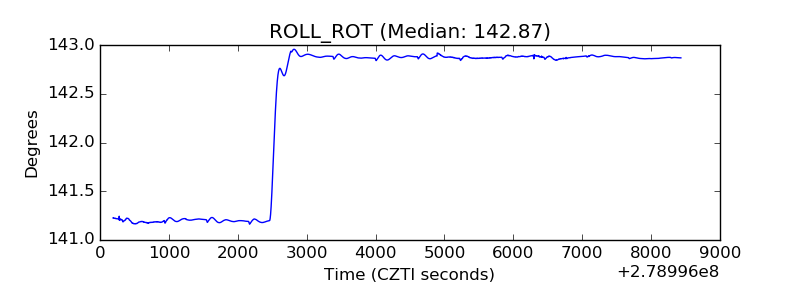 |
| _Roll_DEC | 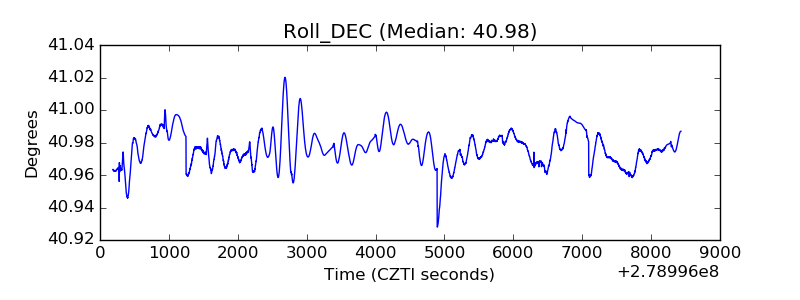 |
| _Roll_RA | 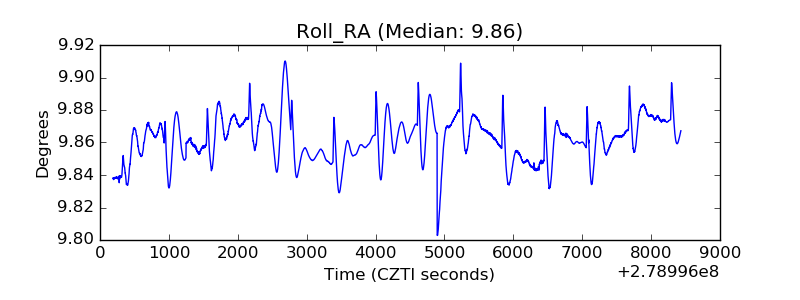 |
| Veto Counter | 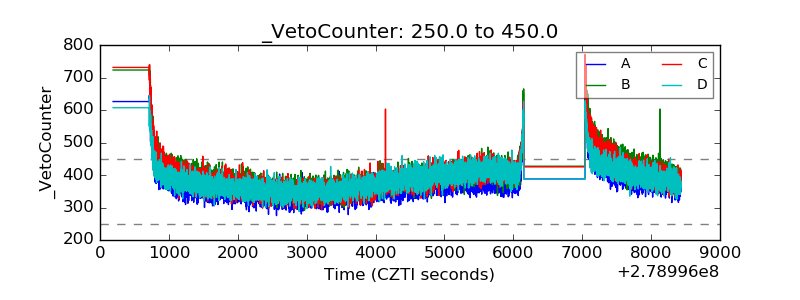 |