| Param | Original file | Final file |
|---|---|---|
| Filename | modeM0/AS1A05_004T05_9000002488_16771cztM0_level2.evt | modeM0/AS1A05_004T05_9000002488_16771cztM0_level2_quad_clean.evt |
| Size (bytes) | 642,392,640 | 66,640,320 |
| Size | 612.6 MB | 63.6 MB |
| Events in quadrant A | 4,733,331 | 370,661 |
| Events in quadrant B | 3,646,530 | 406,983 |
| Events in quadrant C | 6,508,339 | 377,716 |
| Events in quadrant D | 4,102,504 | 383,441 |
| Mode SS | |||
|---|---|---|---|
| Quadrant | BADHDUFLAG | Total packets | Discarded packets |
| A | 0 | 140 | 0 |
| B | 0 | 140 | 0 |
| C | 0 | 140 | 0 |
| D | 0 | 140 | 0 |
| Mode M9 | |||
|---|---|---|---|
| Quadrant | BADHDUFLAG | Total packets | Discarded packets |
| A | 0 | 14 | 0 |
| B | 0 | 14 | 0 |
| C | 0 | 14 | 0 |
| D | 0 | 15 | 0 |
| Mode M0 | |||
|---|---|---|---|
| Quadrant | BADHDUFLAG | Total packets | Discarded packets |
| A | 0 | 18318 | 3 |
| B | 0 | 15061 | 2 |
| C | 0 | 24175 | 2 |
| D | 0 | 16488 | 2 |
| Quadrant | Total seconds | Saturated seconds | Saturation percentage |
|---|---|---|---|
| A | 6865 | 529 | 7.705754% |
| B | 6865 | 71 | 1.034232% |
| C | 6865 | 333 | 4.850692% |
| D | 6865 | 105 | 1.529497% |
Noise dominated data is calculated using 1-second bins in cleaned event files. If a bin has >2000 counts, and if more than 50% of those come from <1% of pixels, then it is considered to be noise-dominated and hence unusable.
| Quadrant | # 1 sec bins | Bins with >0 counts | Bins with >2000 counts | High rate bins dominated by noise | Noise dominated (total time) | Noise dominated (detector-on time) | Marked lightcurve |
|---|---|---|---|---|---|---|---|
| A | 7906 | 6867 | 344 | 344 | 4.35% | 5.01% | 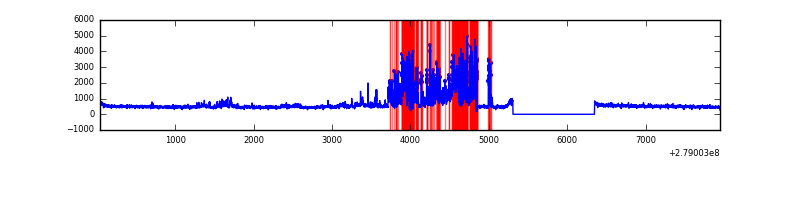 |
| B | 7906 | 6867 | 1 | 1 | 0.01% | 0.01% | 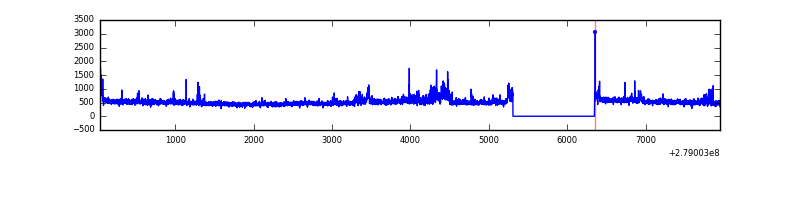 |
| C | 7906 | 6867 | 15 | 15 | 0.19% | 0.22% | 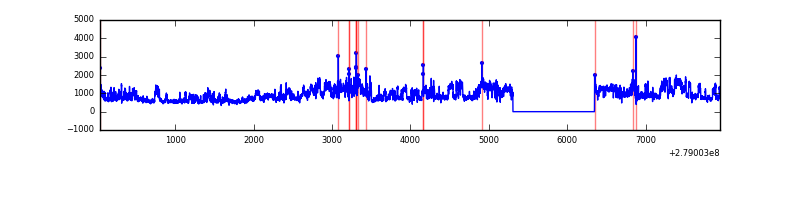 |
| D | 7906 | 6867 | 64 | 64 | 0.81% | 0.93% | 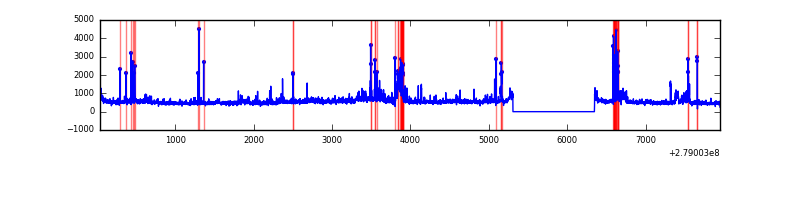 |
Top three noisy pixels from each quadrant. If the there are fewer than three noisy pixels in the level2.evt file, extra rows are filled as -1
| Pixel properties | Quadrant properties | ||||||
|---|---|---|---|---|---|---|---|
| Quadrant | DetID | PixID | Counts | Sigma | Mean | Median | Sigma |
| A | 15 | 174 | 1573253 | 9479.4 | 821 | 804 | 165.9 |
| A | 0 | 226 | 7286 | 39.08 | 821 | 804 | 165.9 |
| A | 12 | 194 | 5995 | 31.29 | 821 | 804 | 165.9 |
| B | 5 | 65 | 109684 | 678.21 | 843 | 821 | 160.5 |
| B | 15 | 35 | 103008 | 636.62 | 843 | 821 | 160.5 |
| B | 5 | 236 | 52204 | 320.12 | 843 | 821 | 160.5 |
| C | 3 | 233 | 3161181 | 17080.66 | 795 | 802 | 185.0 |
| C | 14 | 238 | 122901 | 659.9 | 795 | 802 | 185.0 |
| C | 0 | 207 | 119922 | 643.8 | 795 | 802 | 185.0 |
| D | 12 | 110 | 419458 | 2108.53 | 813 | 792 | 198.6 |
| D | 1 | 52 | 307359 | 1543.97 | 813 | 792 | 198.6 |
| D | 11 | 176 | 193210 | 969.08 | 813 | 792 | 198.6 |
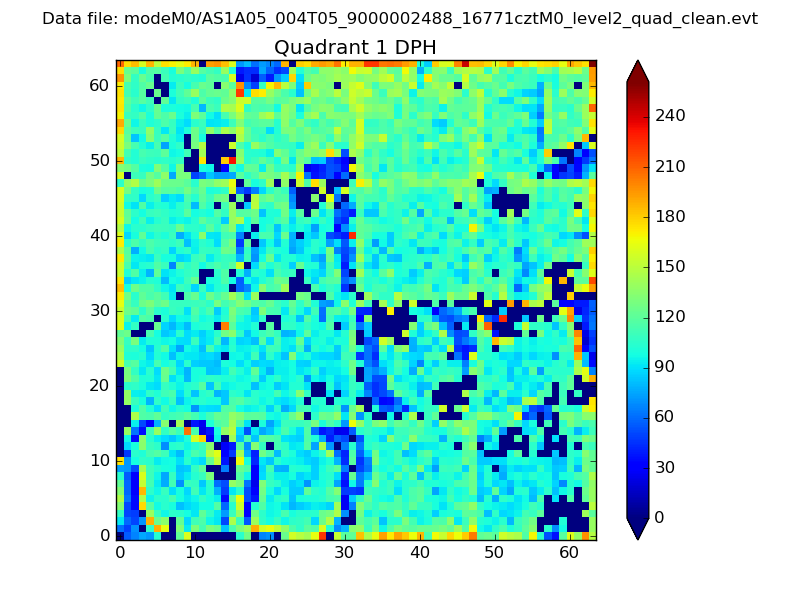
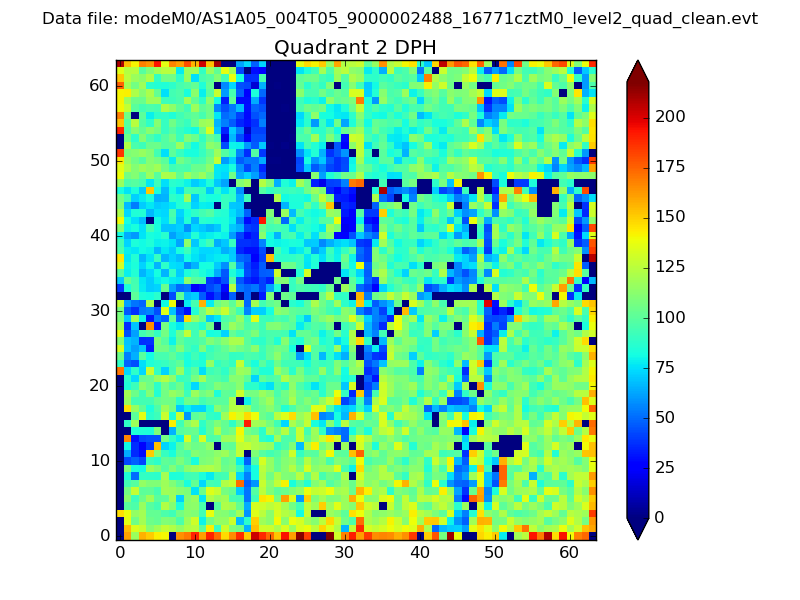
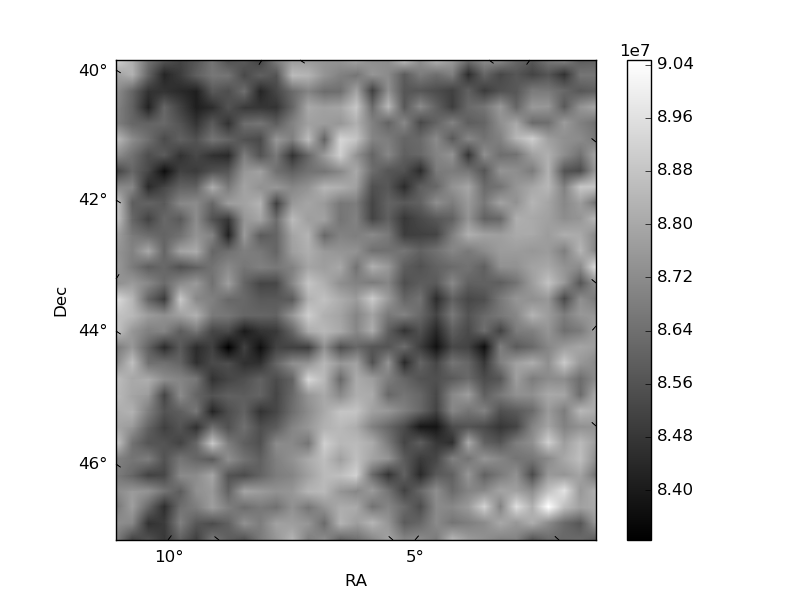
Histogram calculated using DETX and DETY for each event in the final _common_clean file
| Quadrant A |  |
 |
Quadrant B |
|---|---|---|---|
| Quadrant D |  |
 |
Quadrant C |
| Plot type | Count rate plots | Images |
|---|---|---|
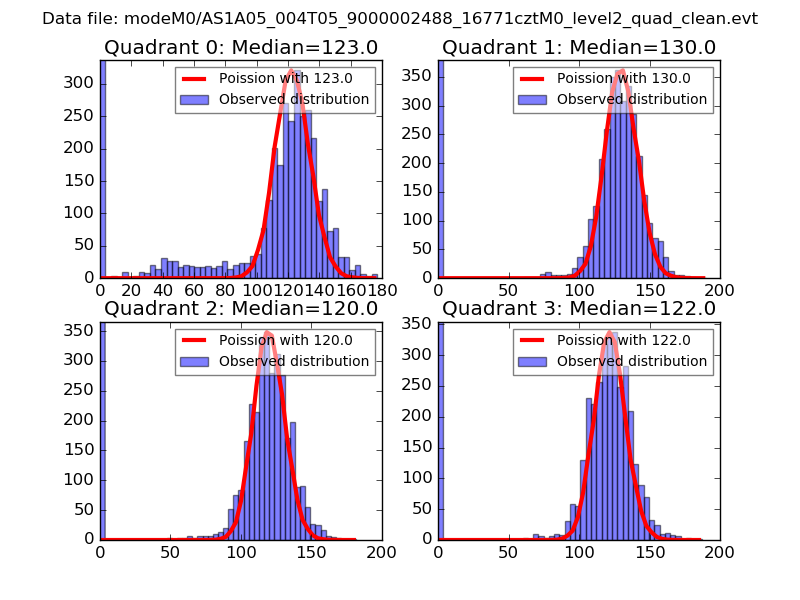
| Comparison with Poisson distribution Blue bars denote a histogram of data divided into 1 sec bins. Red curve is a Poisson curve with rate = median count rate of data. |
 |
 |
| Quadrant-wise count rates Data is divided into 100 sec bins |
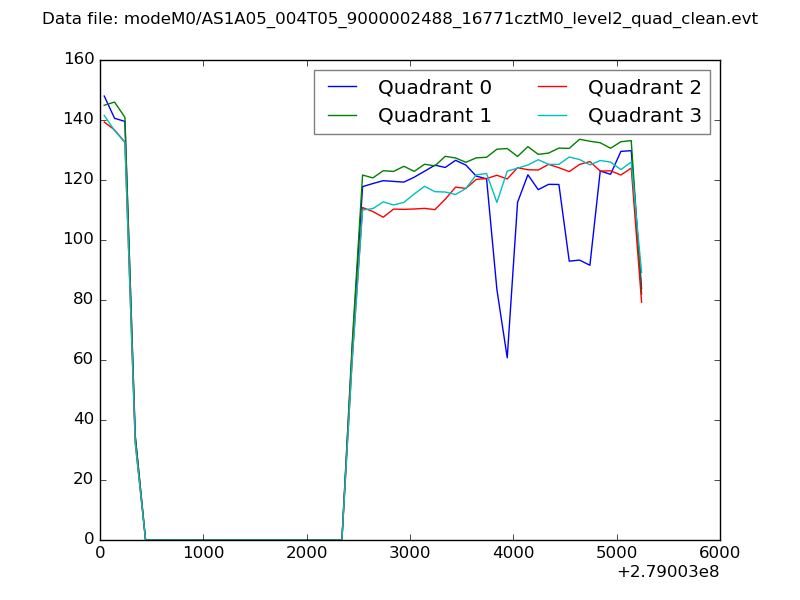 |
|
| Module-wise count rates for Quadrant A Data is divided into 100 sec bins |
 |
 |
| Module-wise count rates for Quadrant B Data is divided into 100 sec bins |
 |
 |
| Module-wise count rates for Quadrant C Data is divided into 100 sec bins |
 |
 |
| Module-wise count rates for Quadrant D Data is divided into 100 sec bins |
 |
 |
| Parameter | Plot |
|---|---|
| CZT HV Monitor |  |
| D_VDD | 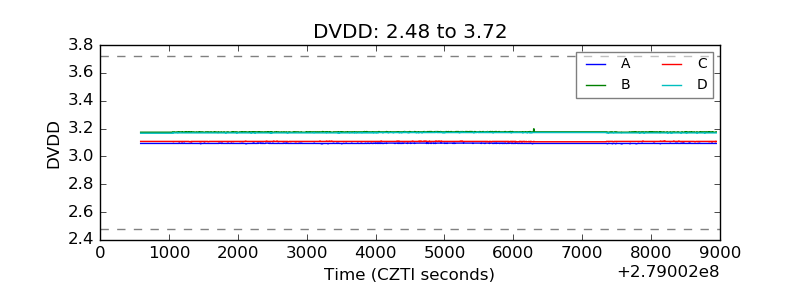 |
| Temperature 1 | 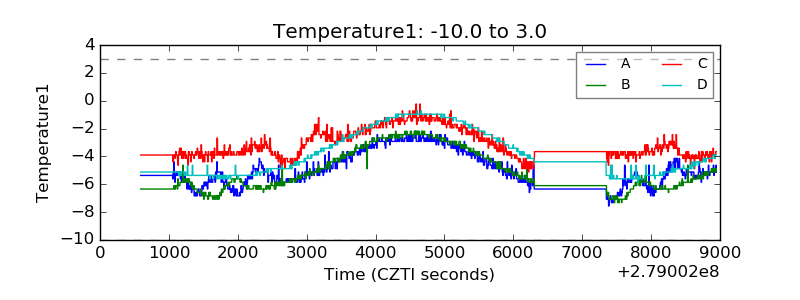 |
| Veto HV Monitor | 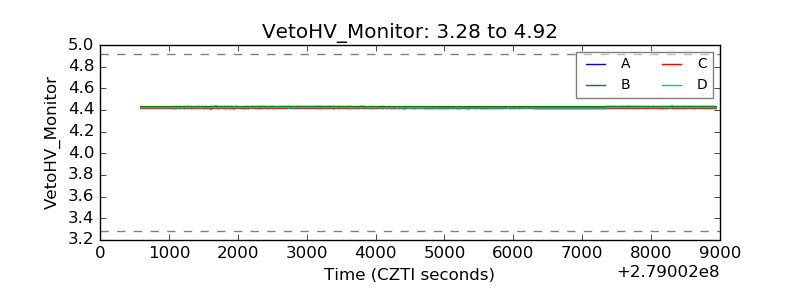 |
| Veto LLD | 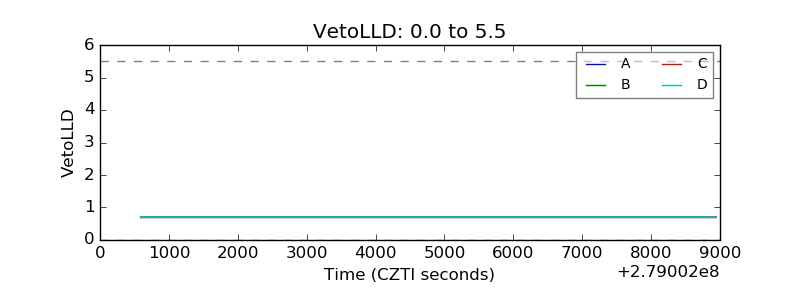 |
| Alpha Counter | 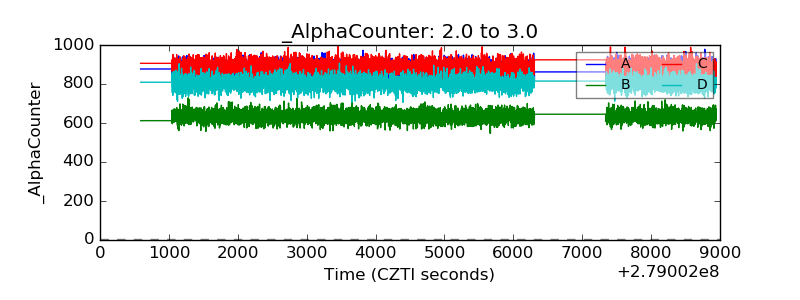 |
| _CPM_Rate | 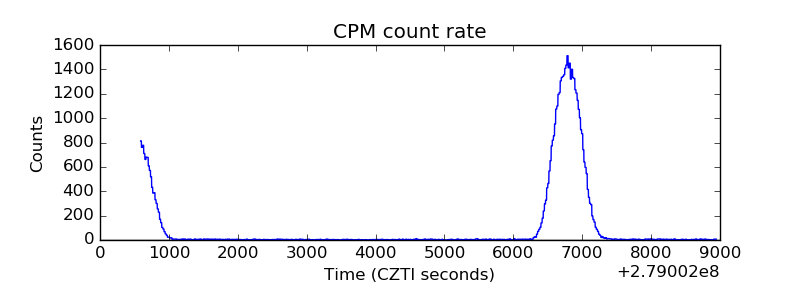 |
| CZT Counter | 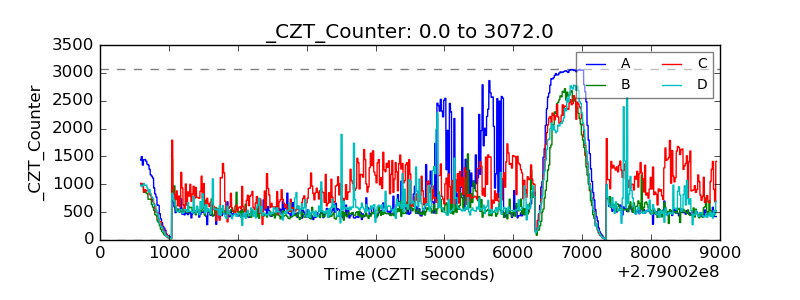 |
| +2.5 Volts monitor |  |
| +5 Volts monitor | 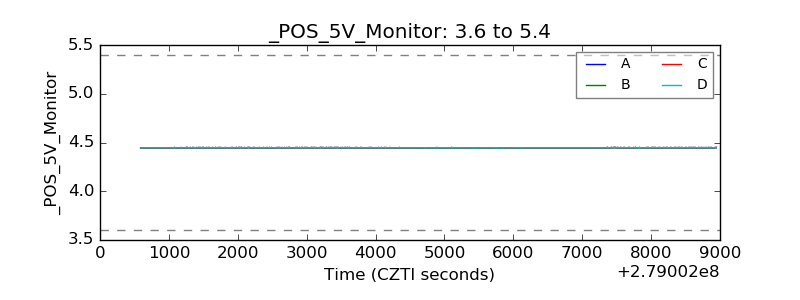 |
| _ROLL_ROT | 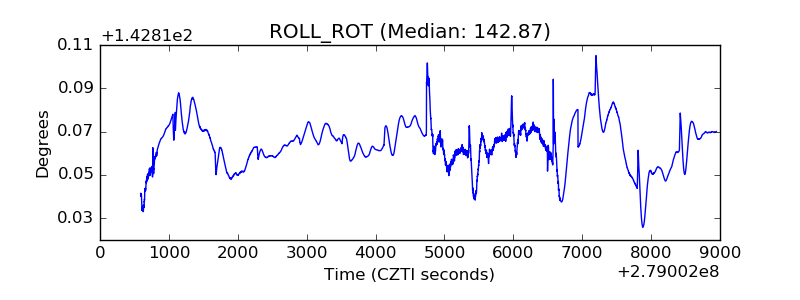 |
| _Roll_DEC | 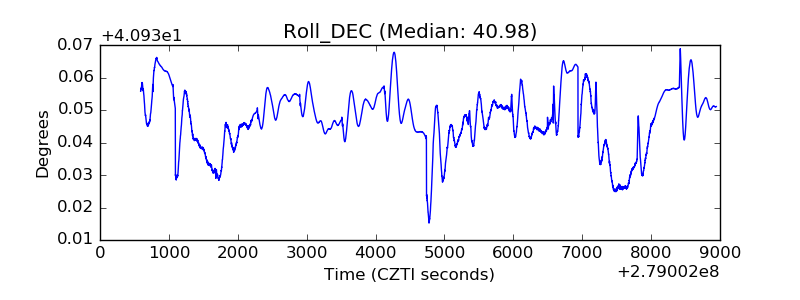 |
| _Roll_RA | 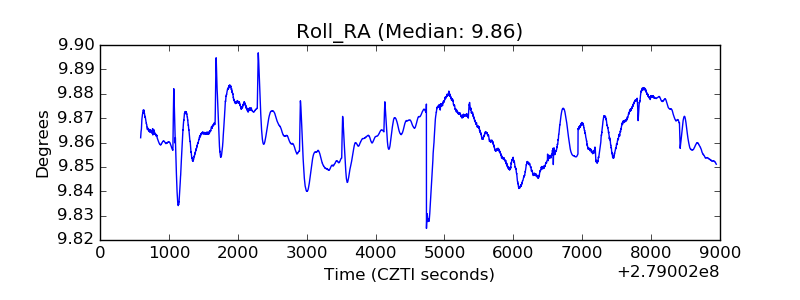 |
| Veto Counter | 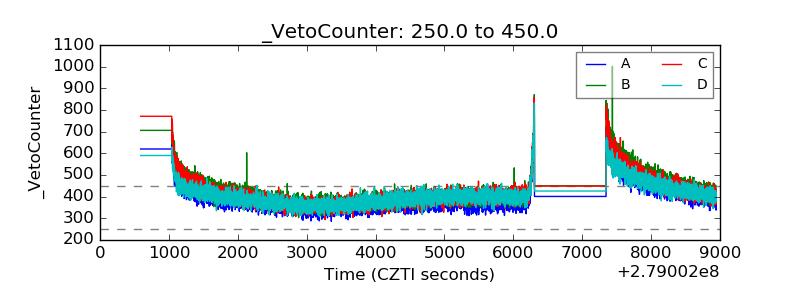 |