| Param | Original file | Final file |
|---|---|---|
| Filename | modeM0/AS1A05_004T05_9000002488_16773cztM0_level2.evt | modeM0/AS1A05_004T05_9000002488_16773cztM0_level2_quad_clean.evt |
| Size (bytes) | 344,756,160 | 40,711,680 |
| Size | 328.8 MB | 38.8 MB |
| Events in quadrant A | 2,006,588 | 242,940 |
| Events in quadrant B | 2,004,034 | 250,440 |
| Events in quadrant C | 3,671,449 | 231,945 |
| Events in quadrant D | 2,493,203 | 231,238 |
| Mode SS | |||
|---|---|---|---|
| Quadrant | BADHDUFLAG | Total packets | Discarded packets |
| A | 0 | 78 | 0 |
| B | 0 | 78 | 0 |
| C | 0 | 78 | 0 |
| D | 0 | 78 | 0 |
| Mode M9 | |||
|---|---|---|---|
| Quadrant | BADHDUFLAG | Total packets | Discarded packets |
| A | 0 | 4 | 0 |
| B | 0 | 4 | 0 |
| C | 0 | 4 | 0 |
| D | 0 | 5 | 0 |
| Mode M0 | |||
|---|---|---|---|
| Quadrant | BADHDUFLAG | Total packets | Discarded packets |
| A | 0 | 8359 | 1 |
| B | 0 | 8313 | 1 |
| C | 0 | 13717 | 1 |
| D | 0 | 9959 | 1 |
| Quadrant | Total seconds | Saturated seconds | Saturation percentage |
|---|---|---|---|
| A | 3905 | 60 | 1.536492% |
| B | 3905 | 9 | 0.230474% |
| C | 3905 | 144 | 3.687580% |
| D | 3905 | 59 | 1.510883% |
Noise dominated data is calculated using 1-second bins in cleaned event files. If a bin has >2000 counts, and if more than 50% of those come from <1% of pixels, then it is considered to be noise-dominated and hence unusable.
| Quadrant | # 1 sec bins | Bins with >0 counts | Bins with >2000 counts | High rate bins dominated by noise | Noise dominated (total time) | Noise dominated (detector-on time) | Marked lightcurve |
|---|---|---|---|---|---|---|---|
| A | 3906 | 3906 | 45 | 45 | 1.15% | 1.15% | 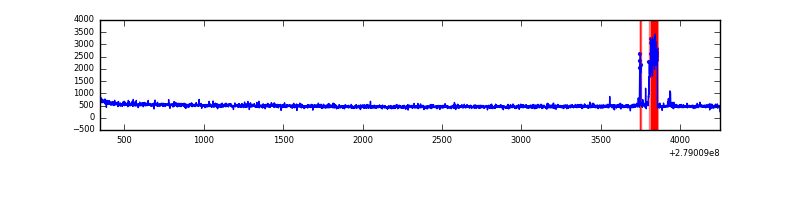 |
| B | 3906 | 3906 | 1 | 1 | 0.03% | 0.03% | 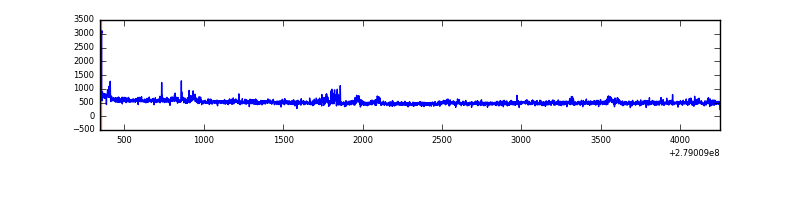 |
| C | 3906 | 3906 | 3 | 3 | 0.08% | 0.08% | 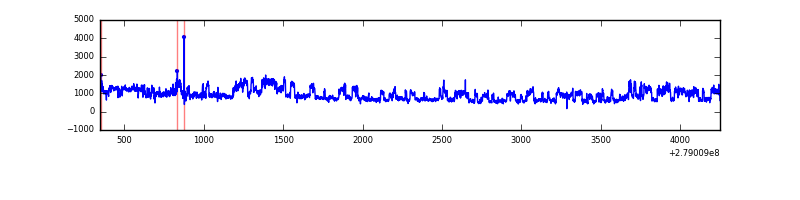 |
| D | 3906 | 3906 | 36 | 36 | 0.92% | 0.92% | 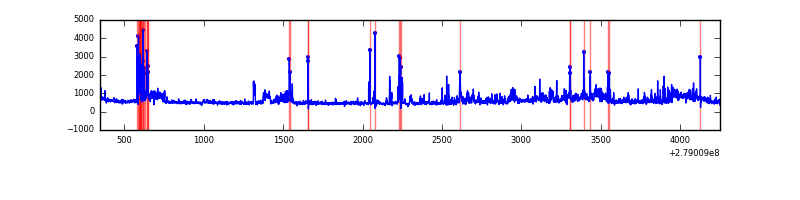 |
Top three noisy pixels from each quadrant. If the there are fewer than three noisy pixels in the level2.evt file, extra rows are filled as -1
| Pixel properties | Quadrant properties | ||||||
|---|---|---|---|---|---|---|---|
| Quadrant | DetID | PixID | Counts | Sigma | Mean | Median | Sigma |
| A | 15 | 174 | 144199 | 1472.14 | 483 | 474 | 97.6 |
| A | 0 | 13 | 5114 | 47.53 | 483 | 474 | 97.6 |
| A | 0 | 226 | 4320 | 39.39 | 483 | 474 | 97.6 |
| B | 15 | 35 | 53731 | 569.03 | 483 | 471 | 93.6 |
| B | 5 | 236 | 31679 | 333.42 | 483 | 471 | 93.6 |
| B | 0 | 219 | 13936 | 143.86 | 483 | 471 | 93.6 |
| C | 3 | 233 | 1801309 | 17137.39 | 451 | 455 | 105.1 |
| C | 14 | 238 | 70523 | 666.79 | 451 | 455 | 105.1 |
| C | 0 | 207 | 37382 | 351.41 | 451 | 455 | 105.1 |
| D | 1 | 52 | 306410 | 2692.51 | 463 | 449 | 113.6 |
| D | 12 | 110 | 259784 | 2282.19 | 463 | 449 | 113.6 |
| D | 10 | 70 | 90867 | 795.69 | 463 | 449 | 113.6 |
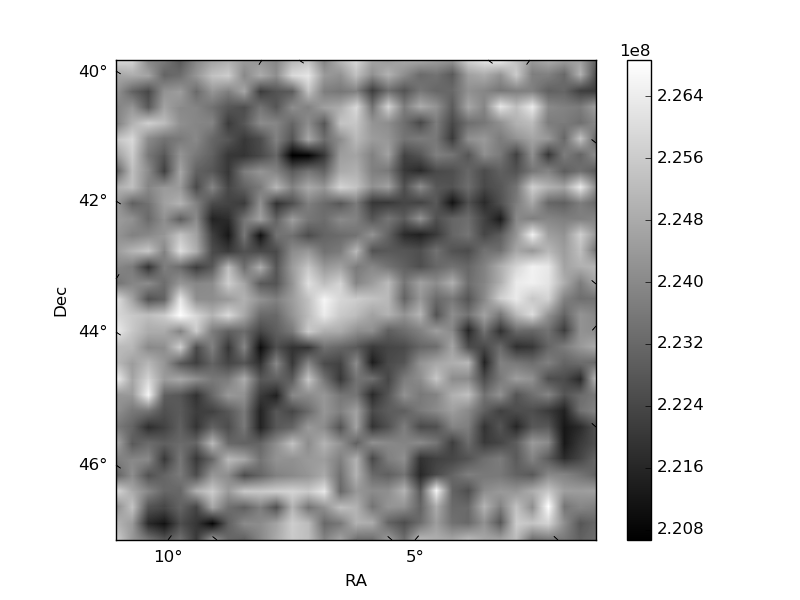
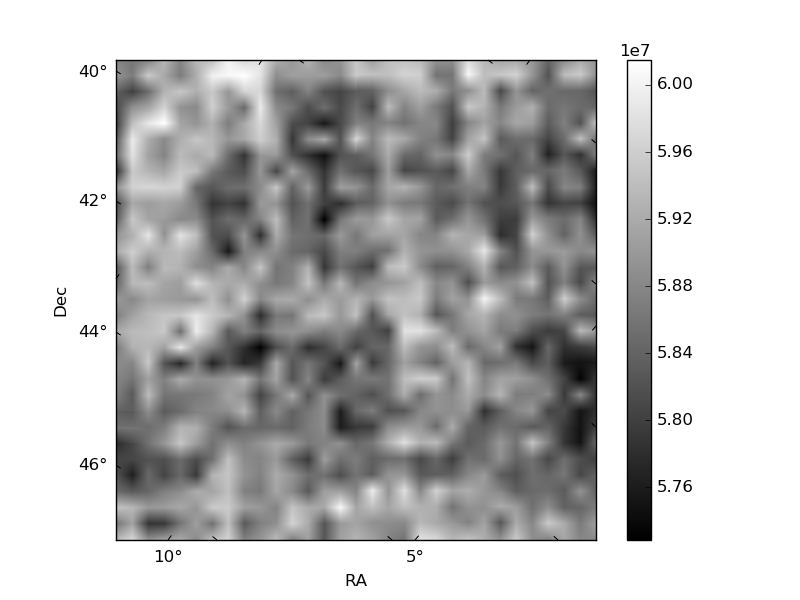
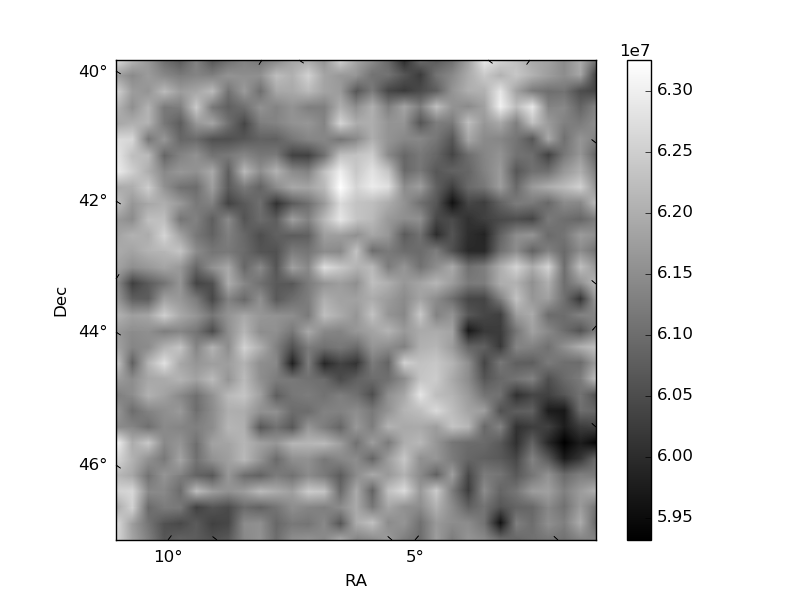
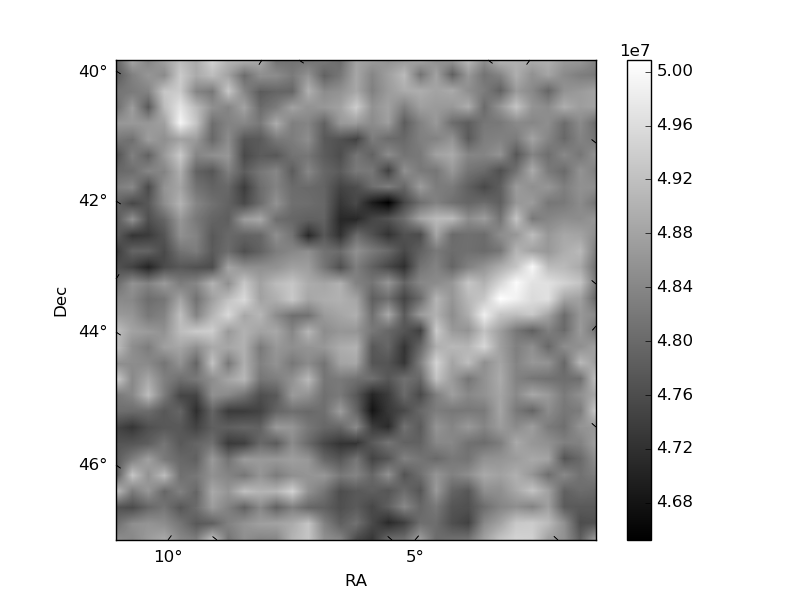
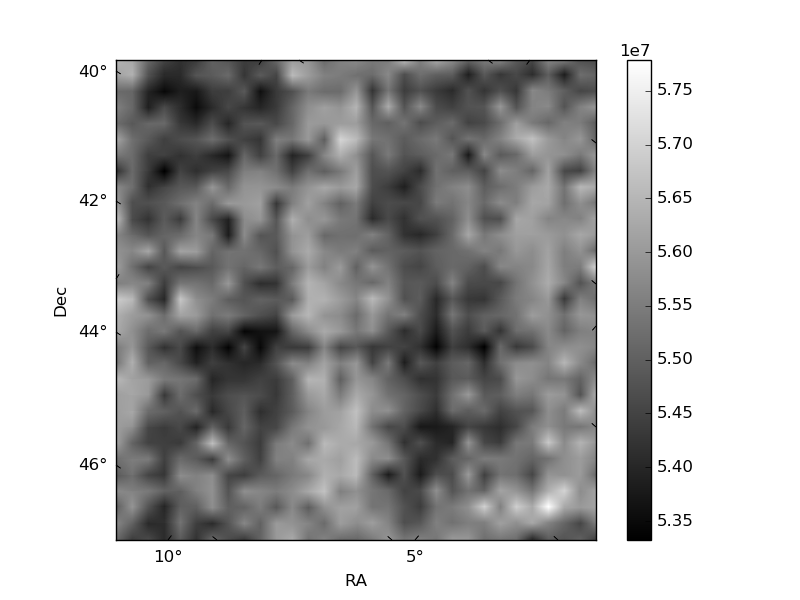
Histogram calculated using DETX and DETY for each event in the final _common_clean file
| Quadrant A | 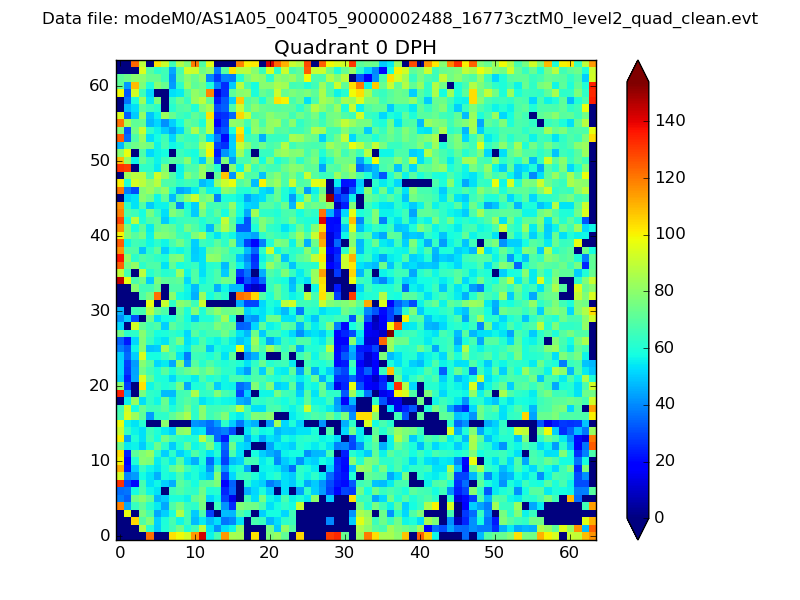 |
 |
Quadrant B |
|---|---|---|---|
| Quadrant D | 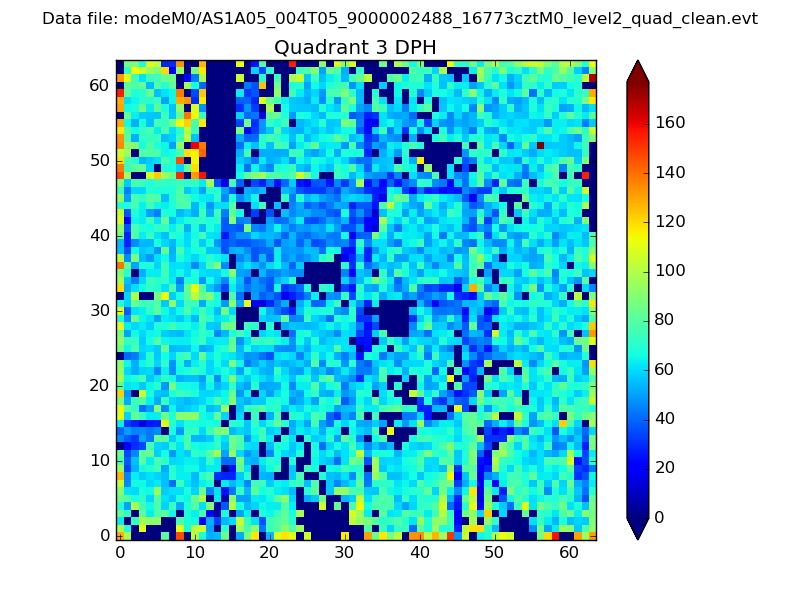 |
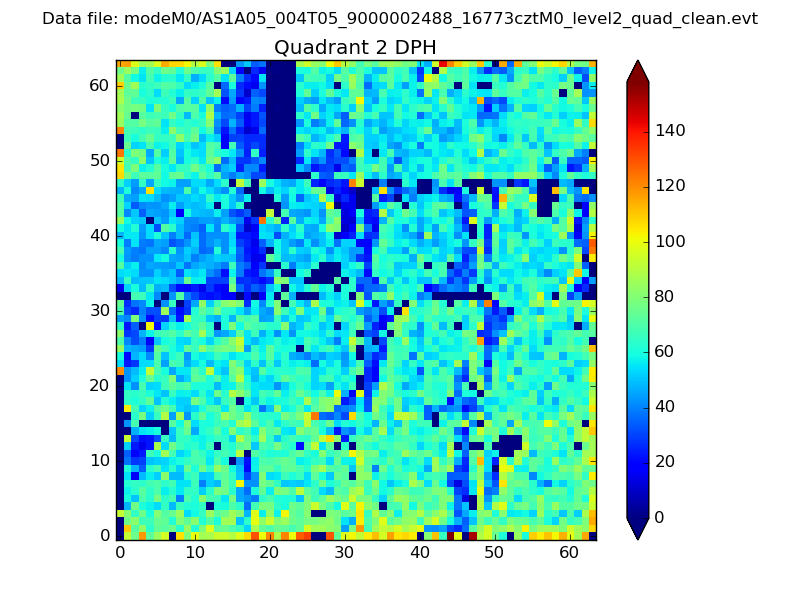 |
Quadrant C |
| Plot type | Count rate plots | Images |
|---|---|---|
| Comparison with Poisson distribution Blue bars denote a histogram of data divided into 1 sec bins. Red curve is a Poisson curve with rate = median count rate of data. |
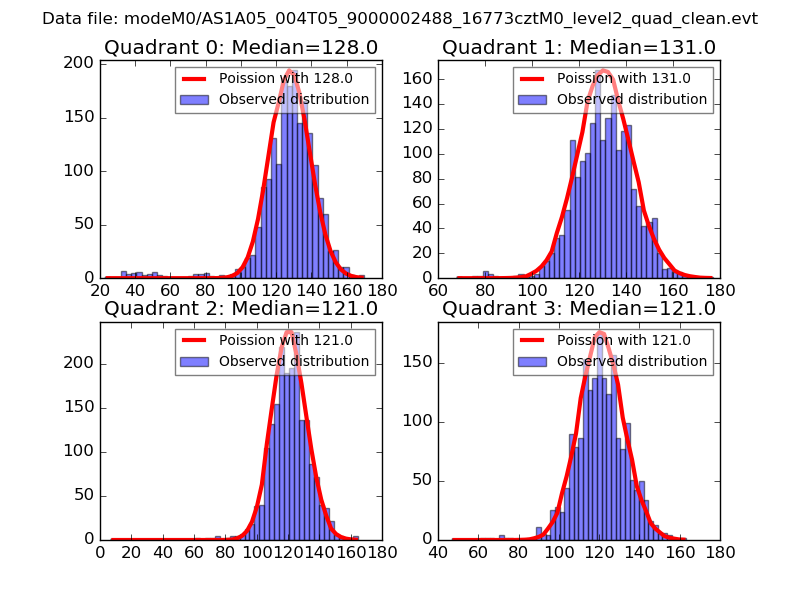 |
 |
| Quadrant-wise count rates Data is divided into 100 sec bins |
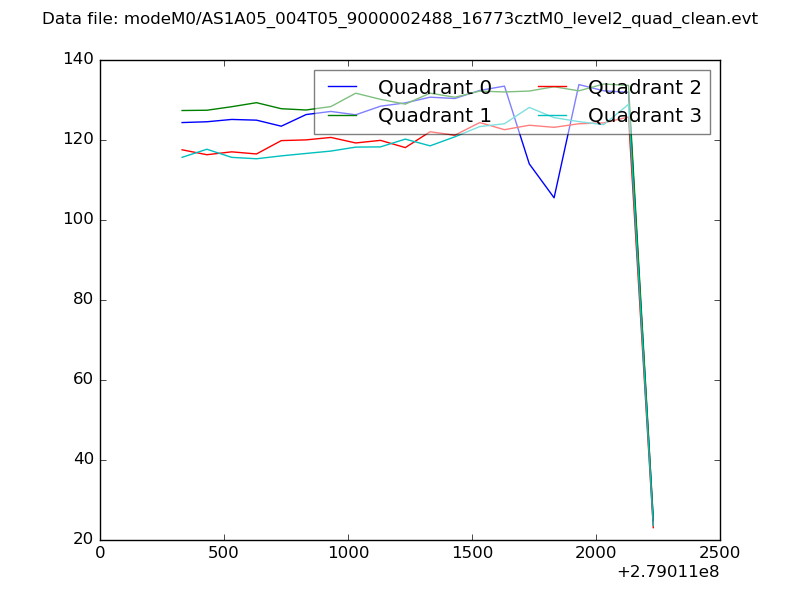 |
|
| Module-wise count rates for Quadrant A Data is divided into 100 sec bins |
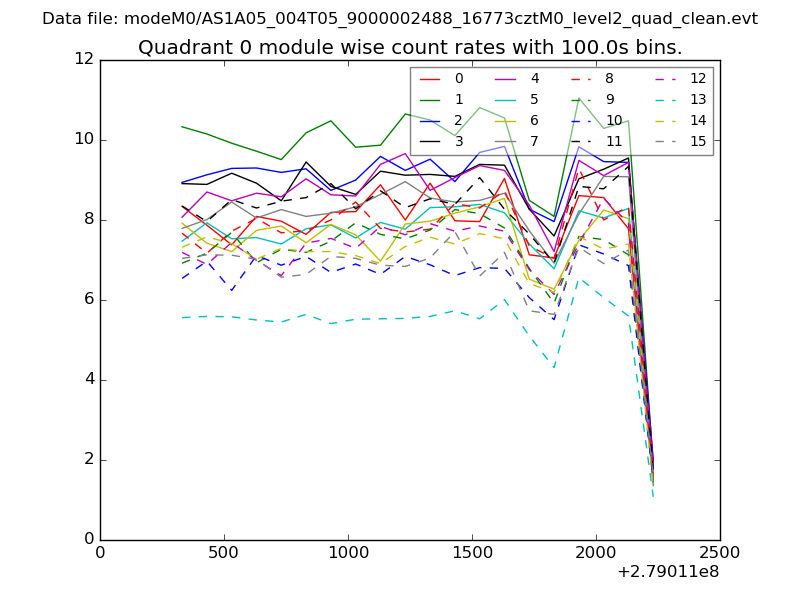 |
 |
| Module-wise count rates for Quadrant B Data is divided into 100 sec bins |
 |
 |
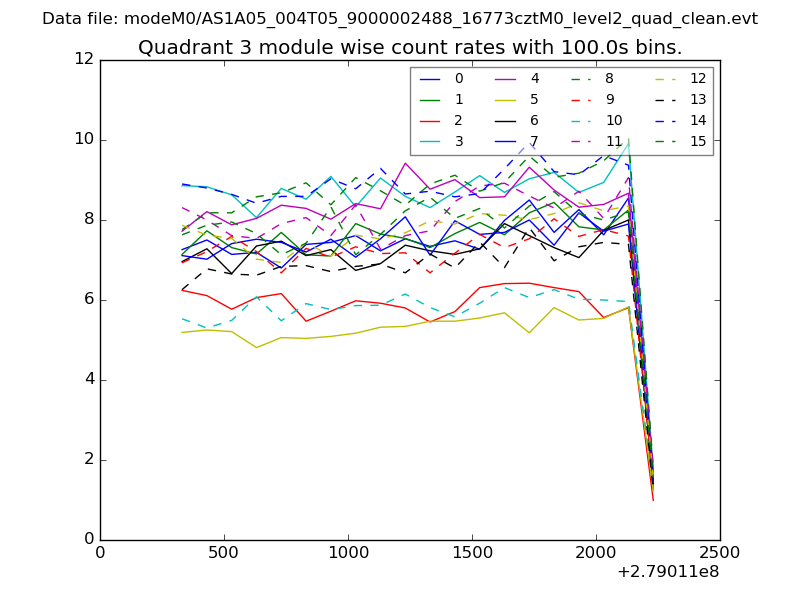
| Module-wise count rates for Quadrant C Data is divided into 100 sec bins |
 |
 |
| Module-wise count rates for Quadrant D Data is divided into 100 sec bins |
 |
 |
| Parameter | Plot |
|---|---|
| CZT HV Monitor |  |
| D_VDD | 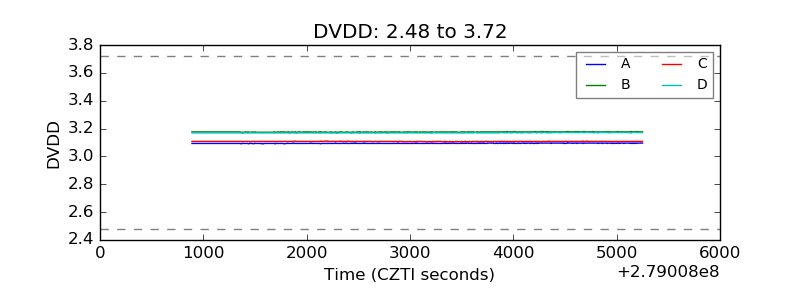 |
| Temperature 1 | 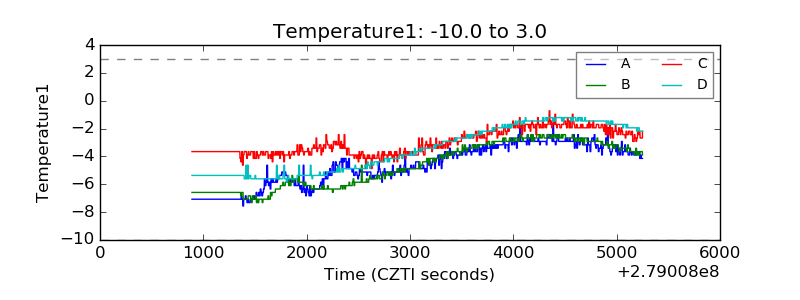 |
| Veto HV Monitor | 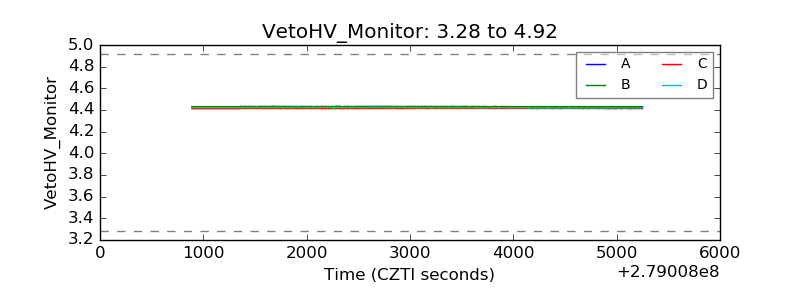 |
| Veto LLD | 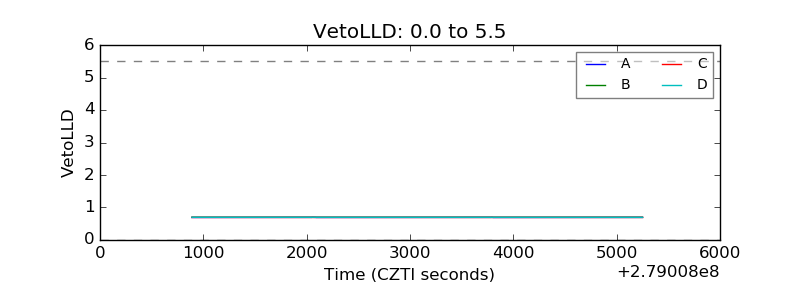 |
| Alpha Counter |  |
| _CPM_Rate | 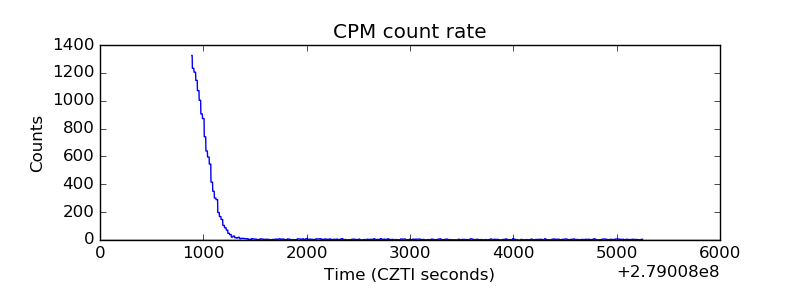 |
| CZT Counter | 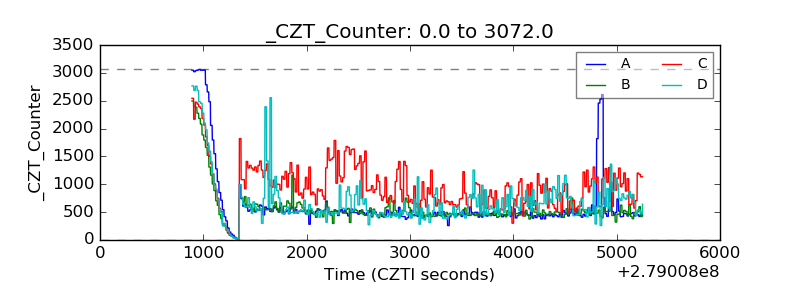 |
| +2.5 Volts monitor |  |
| +5 Volts monitor | 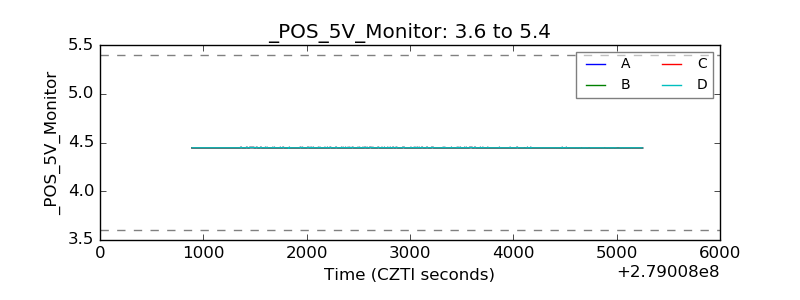 |
| _ROLL_ROT | 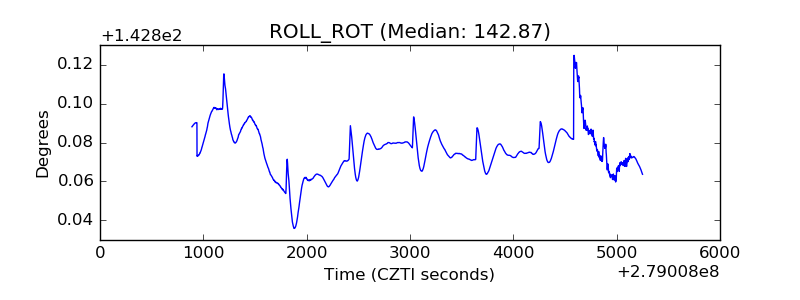 |
| _Roll_DEC | 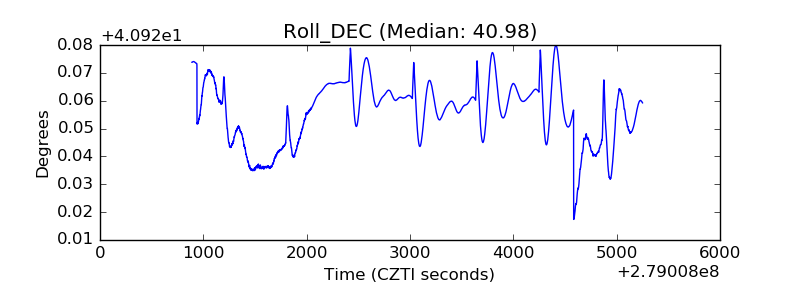 |
| _Roll_RA | 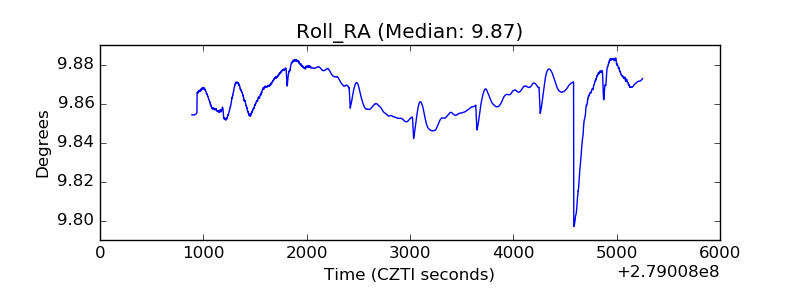 |
| Veto Counter | 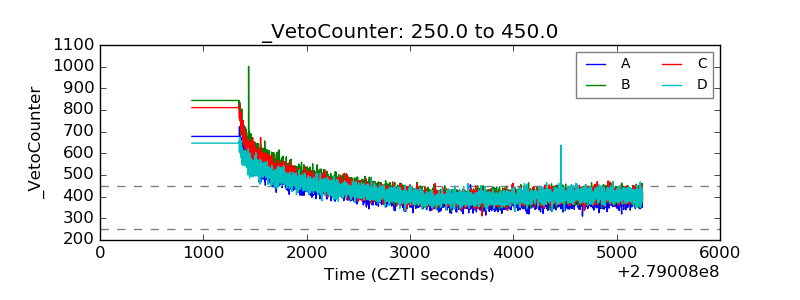 |