| Param | Original file | Final file |
|---|---|---|
| Filename | modeM0/AS1T03_015T01_9000002486cztM0_level2.fits | modeM0/AS1T03_015T01_9000002486cztM0_level2_quad_clean.evt |
| Size (bytes) | 273,625,920 | 342,302,400 |
| Size | 261.0 MB | 326.4 MB |
| Events in quadrant A | 1,689,412 | 2,211,328 |
| Events in quadrant B | 1,619,994 | 2,264,620 |
| Events in quadrant C | 1,642,978 | 2,140,562 |
| Events in quadrant D | 1,318,390 | 1,736,590 |
| Mode M0 | |||
|---|---|---|---|
| Quadrant | BADHDUFLAG | Total packets | Discarded packets |
| A | 0 | 71927 | 0 |
| B | 0 | 63946 | 0 |
| C | 0 | 67696 | 0 |
| D | 0 | 107903 | 0 |
| Mode M9 | |||
|---|---|---|---|
| Quadrant | BADHDUFLAG | Total packets | Discarded packets |
| A | 0 | 46 | 0 |
| B | 0 | 46 | 0 |
| C | 0 | 46 | 0 |
| D | 0 | 46 | 0 |
| Mode SS | |||
|---|---|---|---|
| Quadrant | BADHDUFLAG | Total packets | Discarded packets |
| A | 0 | 598 | 0 |
| B | 0 | 598 | 0 |
| C | 0 | 598 | 0 |
| D | 0 | 598 | 0 |
| Quadrant | Total seconds | Saturated seconds | Saturation percentage |
|---|---|---|---|
| A | 29286 | 1091 | 3.725330% |
| B | 29285 | 317 | 1.082465% |
| C | 29285 | 501 | 1.710773% |
| D | 29283 | 4700 | 16.050268% |
Noise dominated data is calculated using 1-second bins in cleaned event files. If a bin has >2000 counts, and if more than 50% of those come from <1% of pixels, then it is considered to be noise-dominated and hence unusable.
| Quadrant | # 1 sec bins | Bins with >0 counts | Bins with >2000 counts | High rate bins dominated by noise | Noise dominated (total time) | Noise dominated (detector-on time) | Marked lightcurve |
|---|---|---|---|---|---|---|---|
| A | 33948 | 29285 | 0 | 0 | 0.00% | 0.00% |  |
| B | 33948 | 29287 | 0 | 0 | 0.00% | 0.00% |  |
| C | 33948 | 29287 | 0 | 0 | 0.00% | 0.00% |  |
| D | 33948 | 29172 | 0 | 0 | 0.00% | 0.00% | 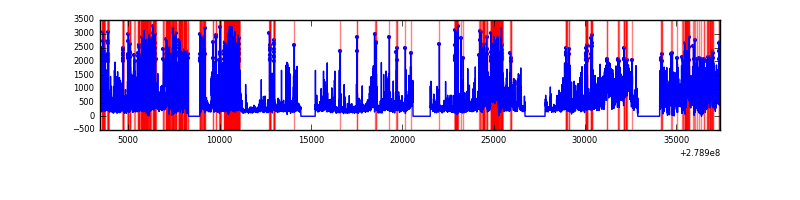 |
Top three noisy pixels from each quadrant. If the there are fewer than three noisy pixels in the level2.evt file, extra rows are filled as -1
| Pixel properties | Quadrant properties | ||||||
|---|---|---|---|---|---|---|---|
| Quadrant | DetID | PixID | Counts | Sigma | Mean | Median | Sigma |
| A | 0 | 29 | 1629 | 11.16 | 439 | 413 | 109.0 |
| A | 7 | 110 | 1346 | 8.56 | 439 | 413 | 109.0 |
| A | 0 | 30 | 1318 | 8.31 | 439 | 413 | 109.0 |
| B | 2 | 9 | 1311 | 10.65 | 428 | 410 | 84.6 |
| B | 2 | 8 | 1110 | 8.27 | 428 | 410 | 84.6 |
| B | 14 | 254 | 1063 | 7.72 | 428 | 410 | 84.6 |
| C | 1 | 81 | 1287 | 7.82 | 433 | 406 | 112.7 |
| C | 1 | 80 | 1272 | 7.69 | 433 | 406 | 112.7 |
| C | 12 | 241 | 1198 | 7.03 | 433 | 406 | 112.7 |
| D | 3 | 14 | 949 | 6.01 | 376 | 343 | 100.9 |
| D | 6 | 67 | 944 | 5.96 | 376 | 343 | 100.9 |
| D | 6 | 231 | 914 | 5.66 | 376 | 343 | 100.9 |
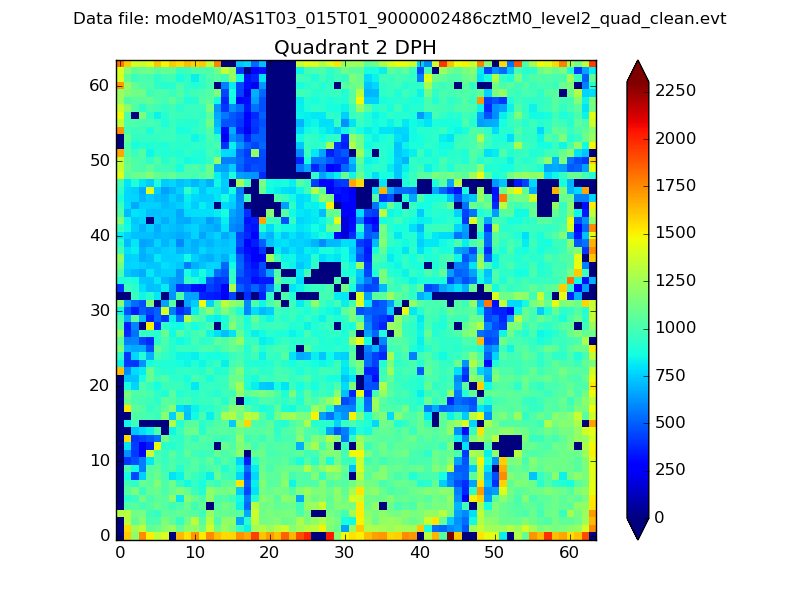
Histogram calculated using DETX and DETY for each event in the final _common_clean file
| Quadrant A | 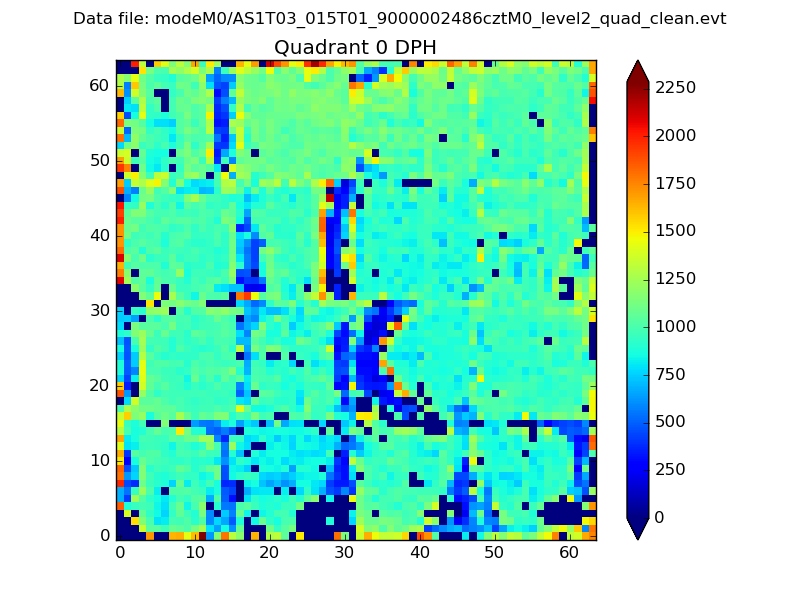 |
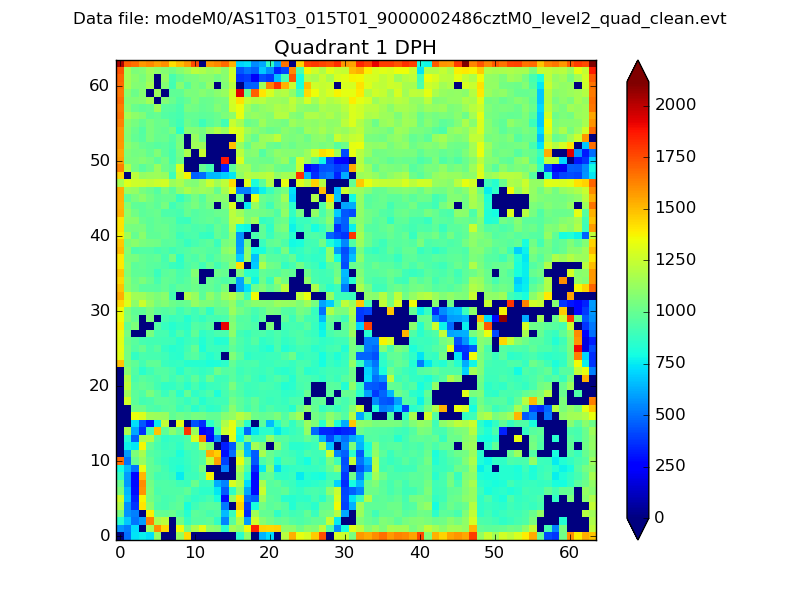 |
Quadrant B |
|---|---|---|---|
| Quadrant D | 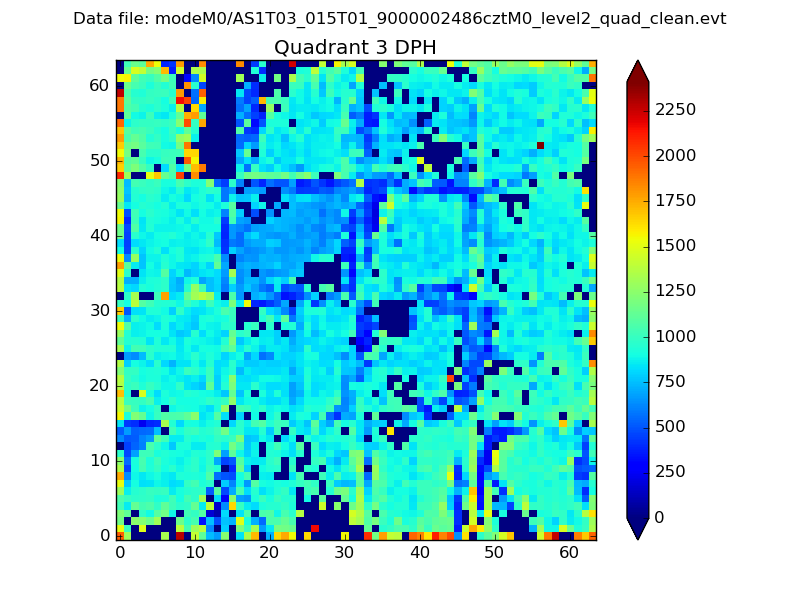 |
 |
Quadrant C |
| Plot type | Count rate plots | Images |
|---|---|---|
| Comparison with Poisson distribution Blue bars denote a histogram of data divided into 1 sec bins. Red curve is a Poisson curve with rate = median count rate of data. |
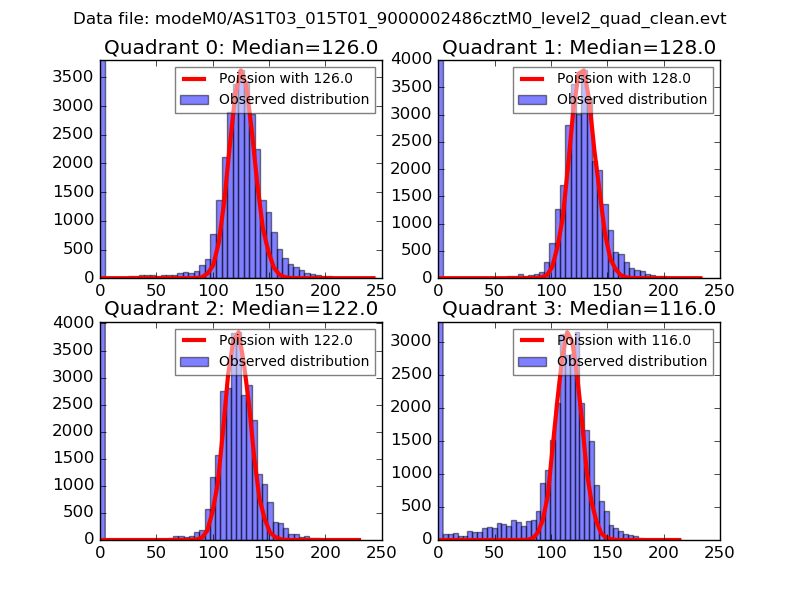 |
 |
| Quadrant-wise count rates Data is divided into 100 sec bins |
 |
|
| Module-wise count rates for Quadrant A Data is divided into 100 sec bins |
 |
 |
| Module-wise count rates for Quadrant B Data is divided into 100 sec bins |
 |
 |
| Module-wise count rates for Quadrant C Data is divided into 100 sec bins |
 |
 |
| Module-wise count rates for Quadrant D Data is divided into 100 sec bins |
 |
 |
| Parameter | Plot |
|---|---|
| CZT HV Monitor |  |
| D_VDD |  |
| Temperature 1 |  |
| Veto HV Monitor | 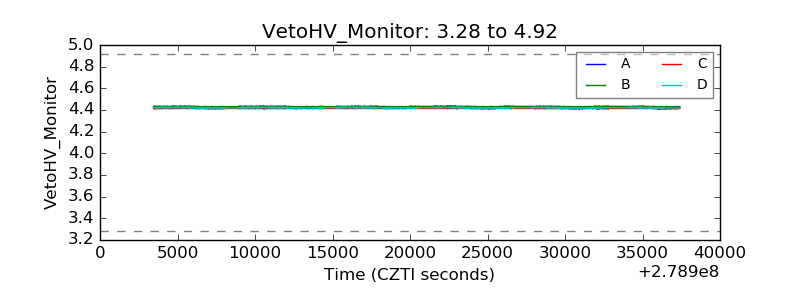 |
| Veto LLD |  |
| Alpha Counter |  |
| _CPM_Rate | 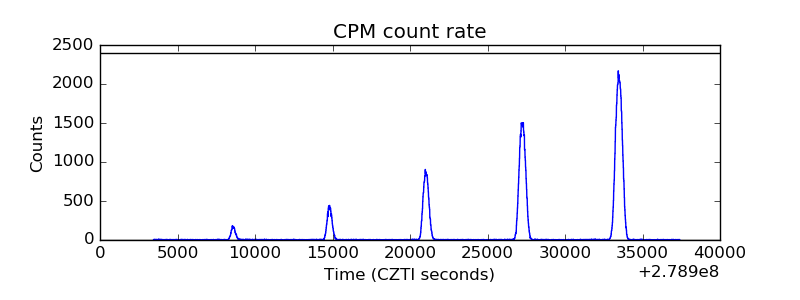 |
| CZT Counter |  |
| +2.5 Volts monitor | 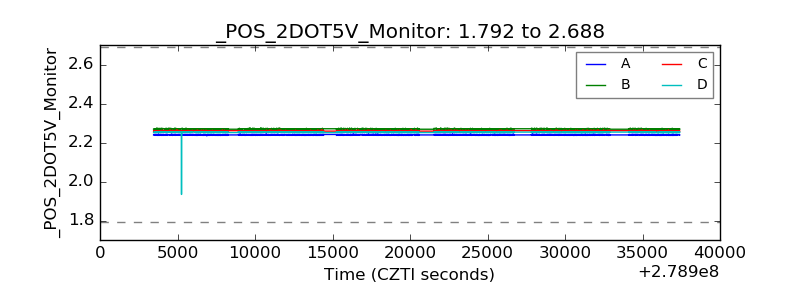 |
| +5 Volts monitor |  |
| _ROLL_ROT |  |
| _Roll_DEC |  |
| _Roll_RA |  |
| Veto Counter |  |