| Param | Original file | Final file |
|---|---|---|
| Filename | modeM0/AS1T03_015T01_9000002486_16755cztM0_level2.evt | modeM0/AS1T03_015T01_9000002486_16755cztM0_level2_quad_clean.evt |
| Size (bytes) | 1,009,506,240 | 212,351,040 |
| Size | 962.7 MB | 202.5 MB |
| Events in quadrant A | 6,118,619 | 1,444,811 |
| Events in quadrant B | 5,998,117 | 1,457,809 |
| Events in quadrant C | 6,331,879 | 1,415,426 |
| Events in quadrant D | 11,321,703 | 1,291,423 |
| Mode M0 | |||
|---|---|---|---|
| Quadrant | BADHDUFLAG | Total packets | Discarded packets |
| A | 0 | 26341 | 3 |
| B | 0 | 25881 | 2 |
| C | 0 | 26737 | 2 |
| D | 0 | 41741 | 2 |
| Mode M9 | |||
|---|---|---|---|
| Quadrant | BADHDUFLAG | Total packets | Discarded packets |
| A | 0 | 14 | 0 |
| B | 0 | 14 | 0 |
| C | 0 | 14 | 0 |
| D | 0 | 14 | 0 |
| Mode SS | |||
|---|---|---|---|
| Quadrant | BADHDUFLAG | Total packets | Discarded packets |
| A | 0 | 242 | 0 |
| B | 0 | 242 | 0 |
| C | 0 | 242 | 0 |
| D | 0 | 242 | 0 |
| Quadrant | Total seconds | Saturated seconds | Saturation percentage |
|---|---|---|---|
| A | 11881 | 98 | 0.824846% |
| B | 11881 | 100 | 0.841680% |
| C | 11881 | 124 | 1.043683% |
| D | 11881 | 1593 | 13.407962% |
Noise dominated data is calculated using 1-second bins in cleaned event files. If a bin has >2000 counts, and if more than 50% of those come from <1% of pixels, then it is considered to be noise-dominated and hence unusable.
| Quadrant | # 1 sec bins | Bins with >0 counts | Bins with >2000 counts | High rate bins dominated by noise | Noise dominated (total time) | Noise dominated (detector-on time) | Marked lightcurve |
|---|---|---|---|---|---|---|---|
| A | 13298 | 11884 | 68 | 68 | 0.51% | 0.57% | 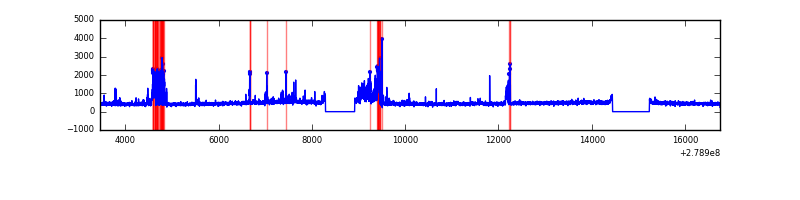 |
| B | 13298 | 11884 | 31 | 31 | 0.23% | 0.26% | 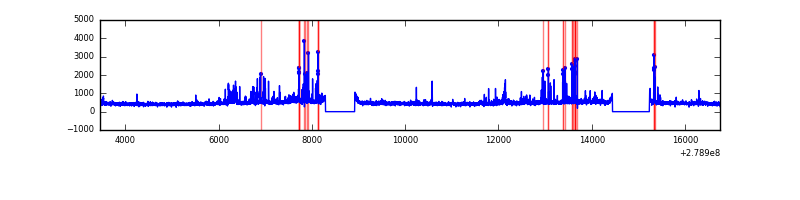 |
| C | 13298 | 11884 | 8 | 8 | 0.06% | 0.07% | 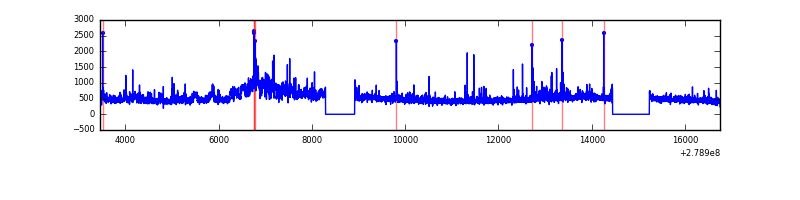 |
| D | 13298 | 11884 | 1272 | 1272 | 9.57% | 10.70% | 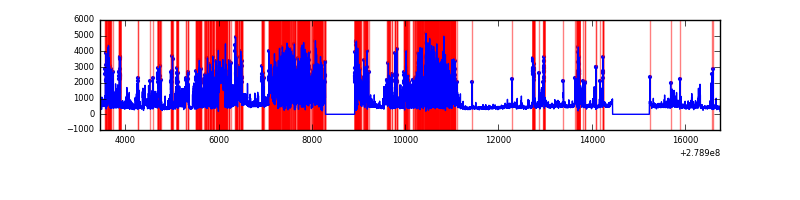 |
Top three noisy pixels from each quadrant. If the there are fewer than three noisy pixels in the level2.evt file, extra rows are filled as -1
| Pixel properties | Quadrant properties | ||||||
|---|---|---|---|---|---|---|---|
| Quadrant | DetID | PixID | Counts | Sigma | Mean | Median | Sigma |
| A | 15 | 174 | 808824 | 2921.13 | 1371 | 1340 | 276.4 |
| A | 14 | 4 | 33171 | 115.15 | 1371 | 1340 | 276.4 |
| A | 0 | 226 | 11950 | 38.38 | 1371 | 1340 | 276.4 |
| B | 10 | 16 | 180201 | 690.24 | 1371 | 1334 | 259.1 |
| B | 15 | 35 | 144050 | 550.73 | 1371 | 1334 | 259.1 |
| B | 0 | 219 | 78698 | 298.54 | 1371 | 1334 | 259.1 |
| C | 3 | 233 | 642703 | 2103.59 | 1315 | 1323 | 304.9 |
| C | 0 | 207 | 303215 | 990.14 | 1315 | 1323 | 304.9 |
| C | 14 | 238 | 205423 | 669.4 | 1315 | 1323 | 304.9 |
| D | 1 | 52 | 5587130 | 18583.04 | 1252 | 1220 | 300.6 |
| D | 15 | 0 | 550304 | 1826.68 | 1252 | 1220 | 300.6 |
| D | 2 | 33 | 249957 | 827.49 | 1252 | 1220 | 300.6 |
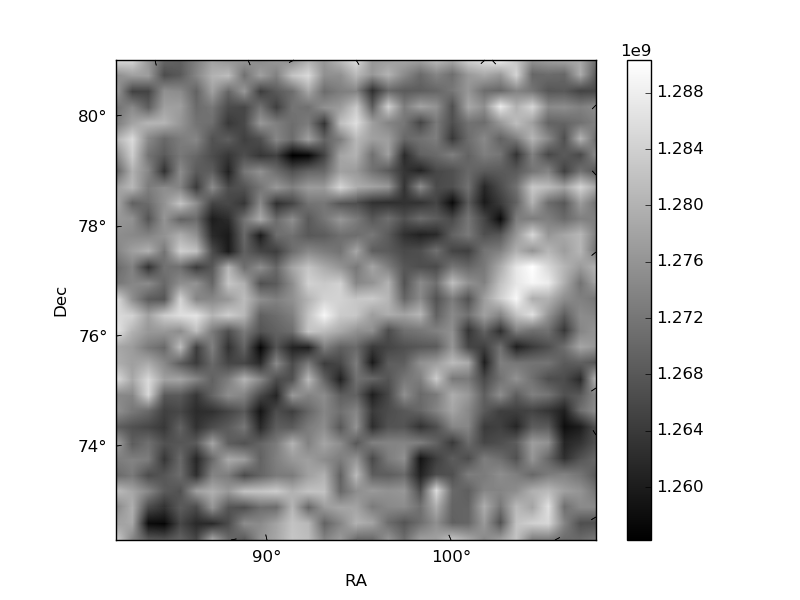
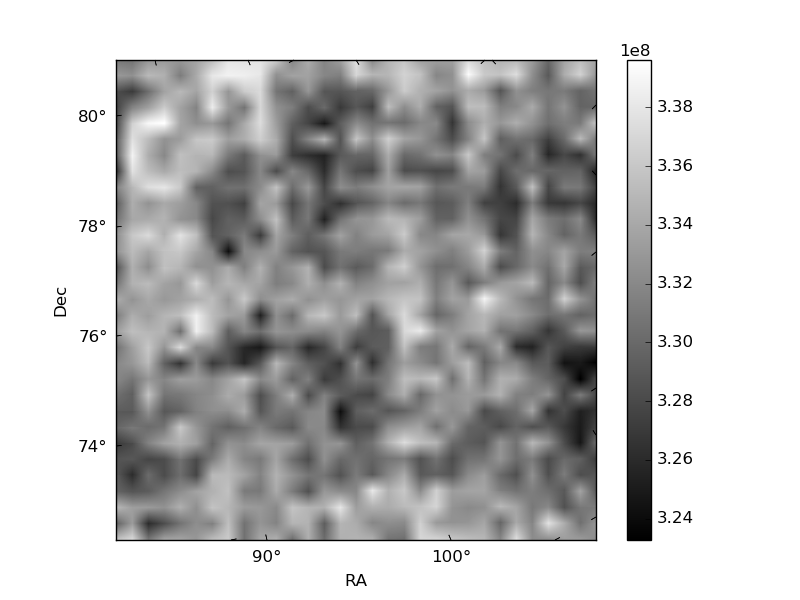
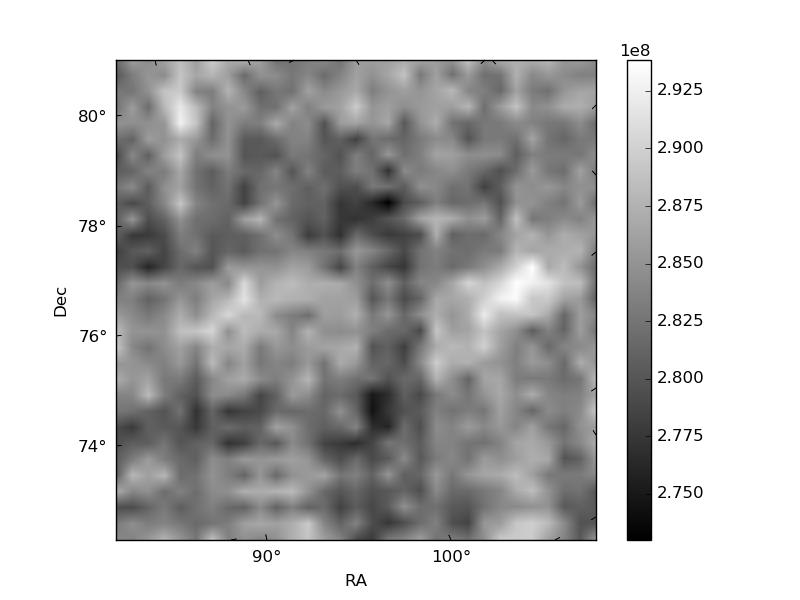
Histogram calculated using DETX and DETY for each event in the final _common_clean file
| Quadrant A | 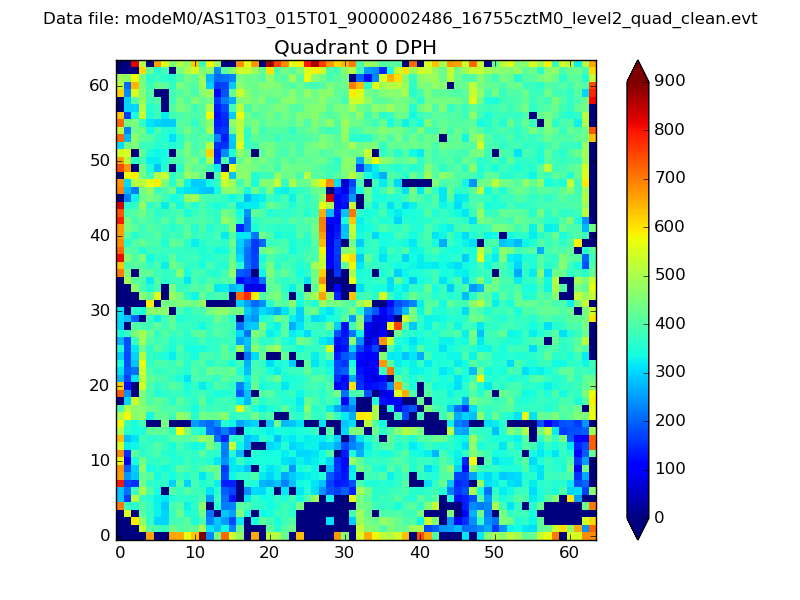 |
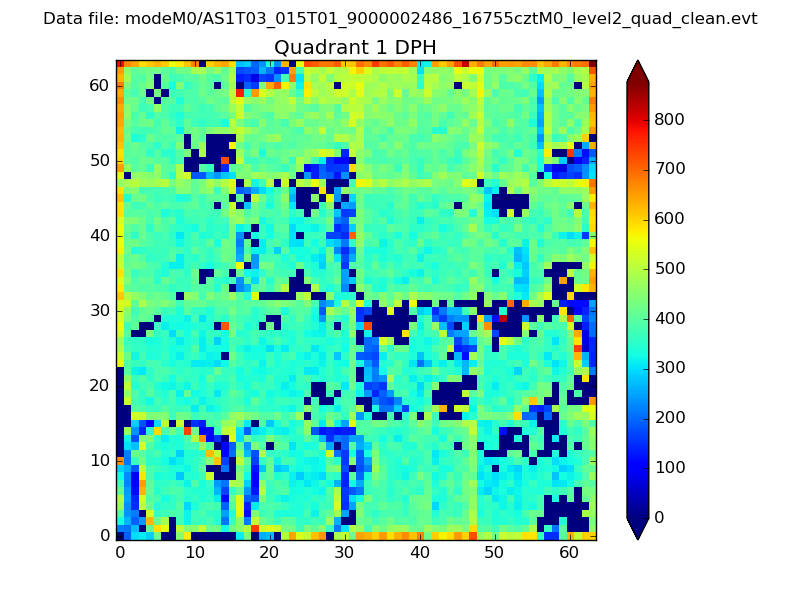 |
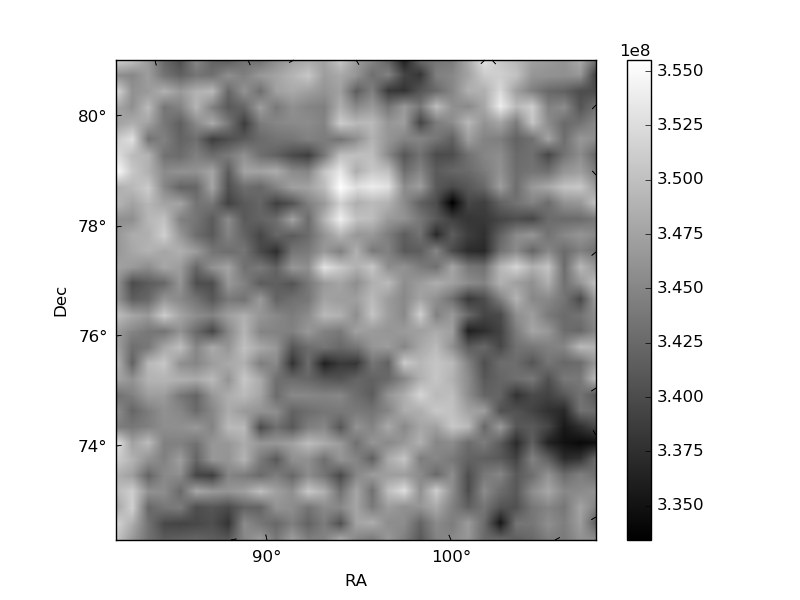
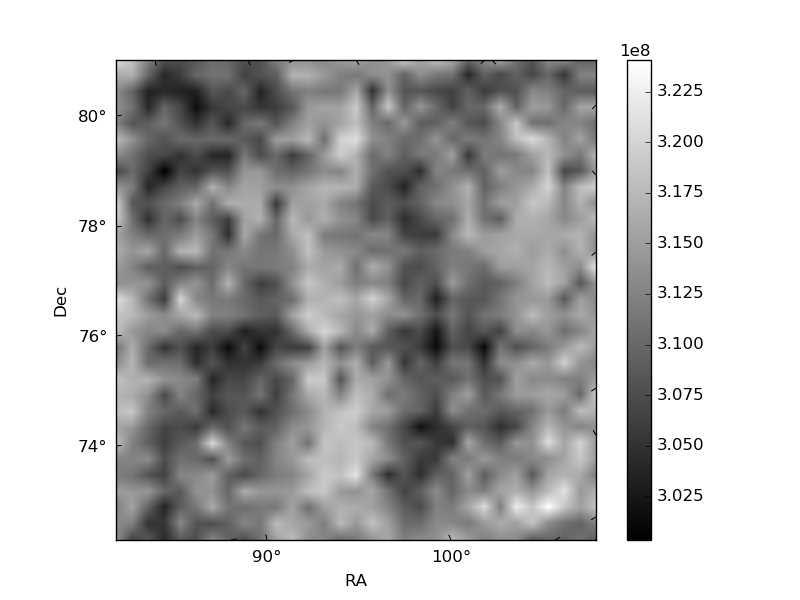
Quadrant B |
|---|---|---|---|
| Quadrant D | 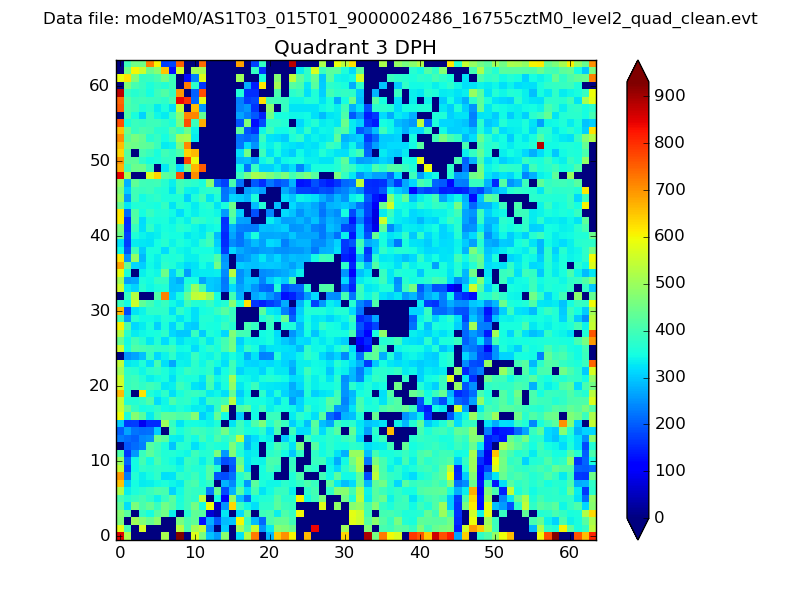 |
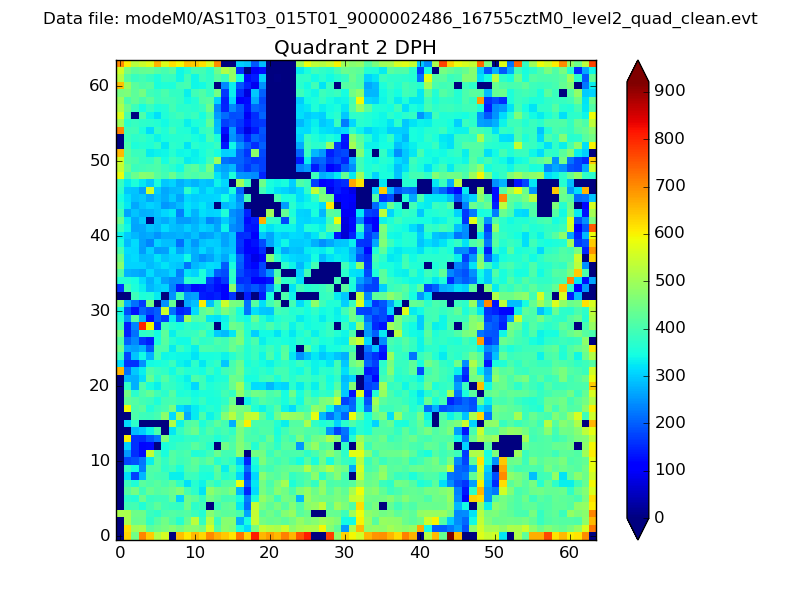 |
Quadrant C |
| Plot type | Count rate plots | Images |
|---|---|---|
| Comparison with Poisson distribution Blue bars denote a histogram of data divided into 1 sec bins. Red curve is a Poisson curve with rate = median count rate of data. |
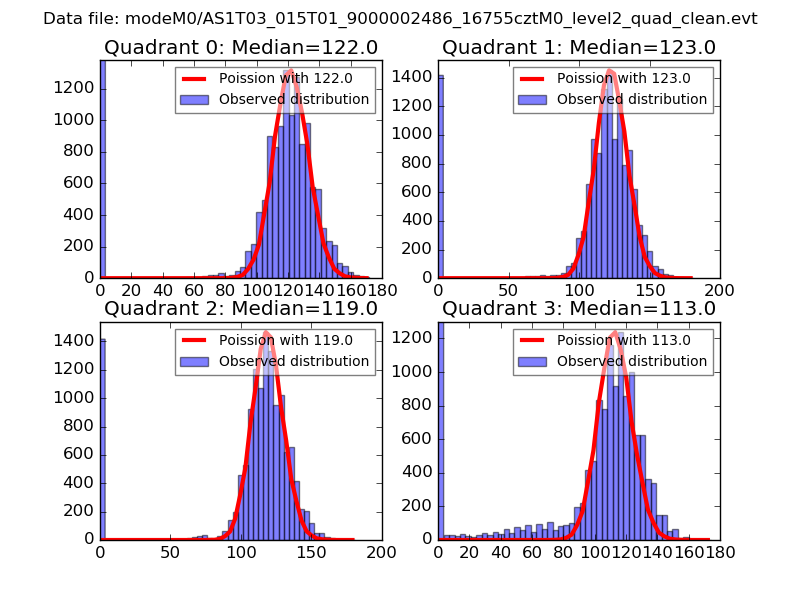 |
 |
| Quadrant-wise count rates Data is divided into 100 sec bins |
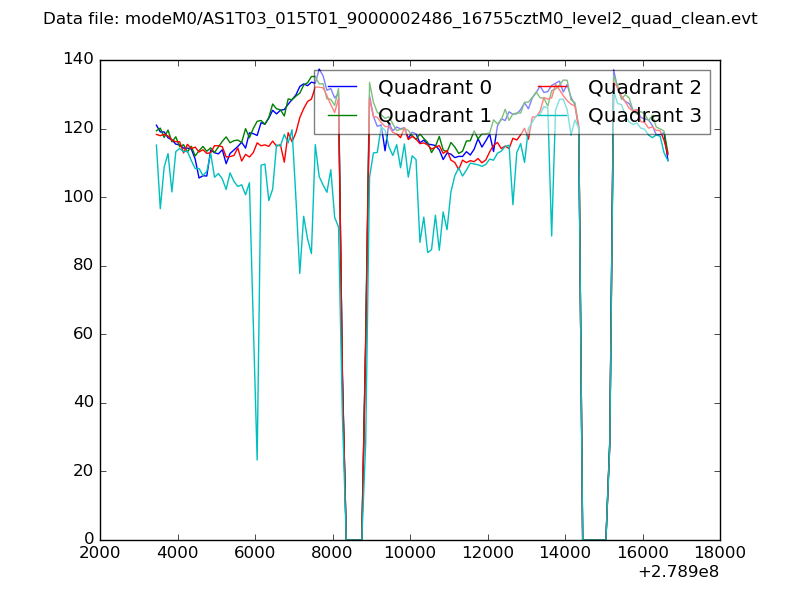 |
|
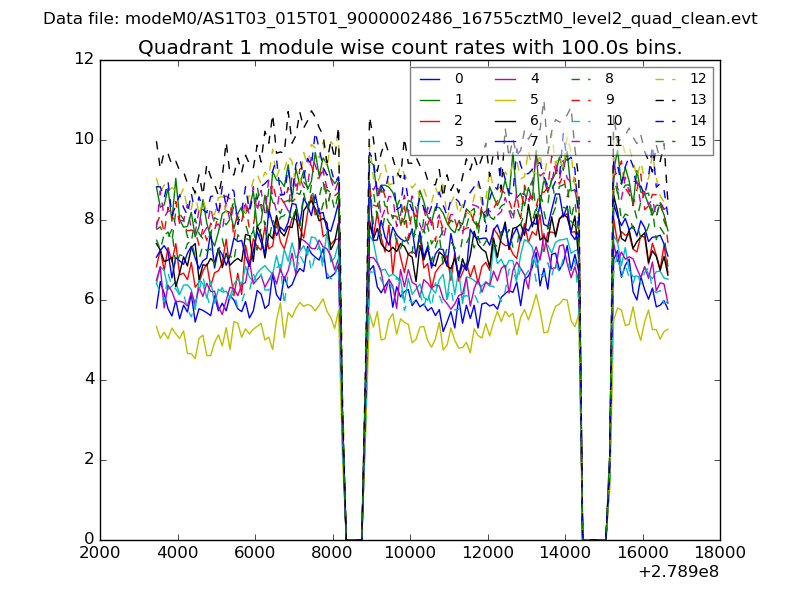
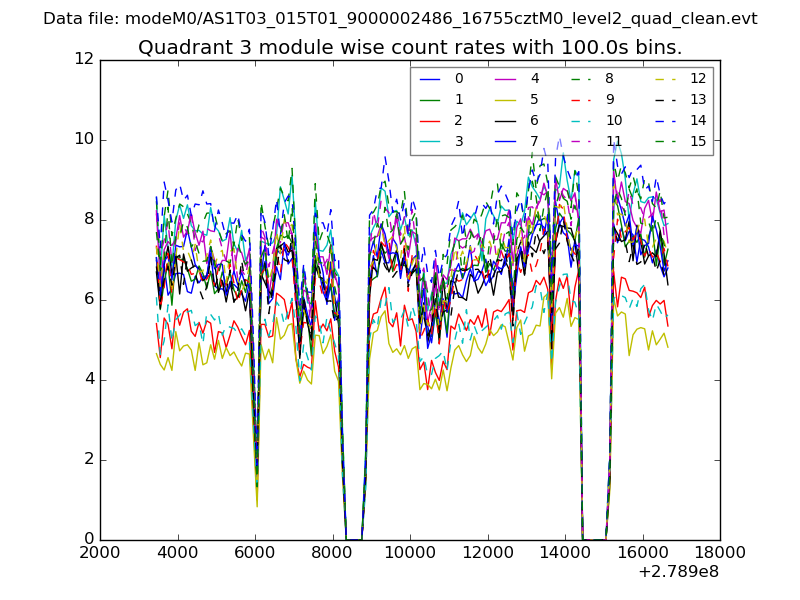
| Module-wise count rates for Quadrant A Data is divided into 100 sec bins |
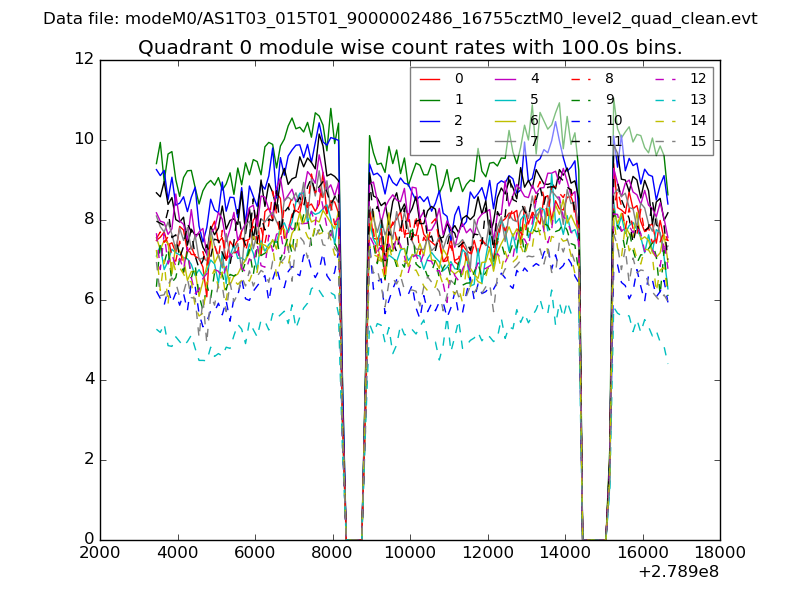 |
 |
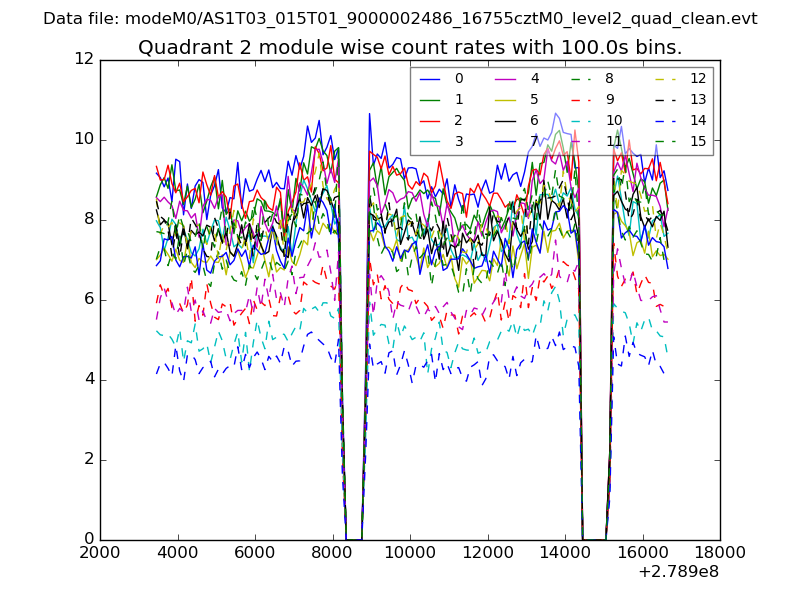
| Module-wise count rates for Quadrant B Data is divided into 100 sec bins |
 |
 |
| Module-wise count rates for Quadrant C Data is divided into 100 sec bins |
 |
 |
| Module-wise count rates for Quadrant D Data is divided into 100 sec bins |
 |
 |
| Parameter | Plot |
|---|---|
| CZT HV Monitor | 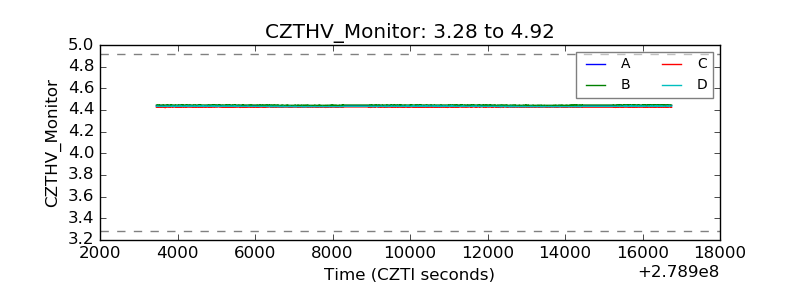 |
| D_VDD | 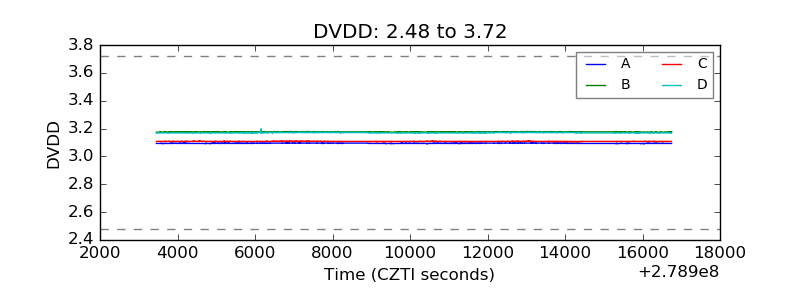 |
| Temperature 1 | 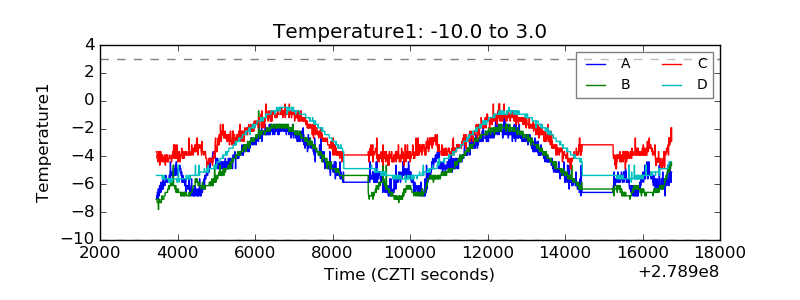 |
| Veto HV Monitor |  |
| Veto LLD | 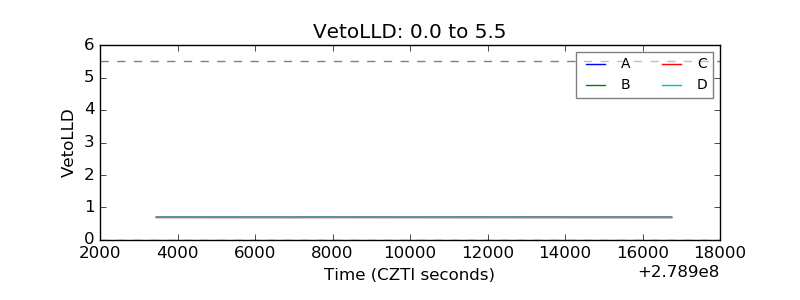 |
| Alpha Counter | 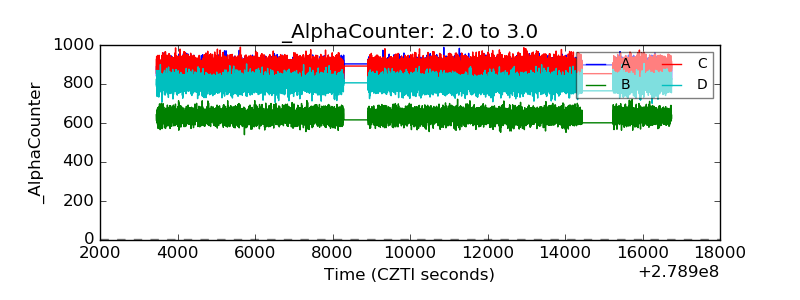 |
| _CPM_Rate | 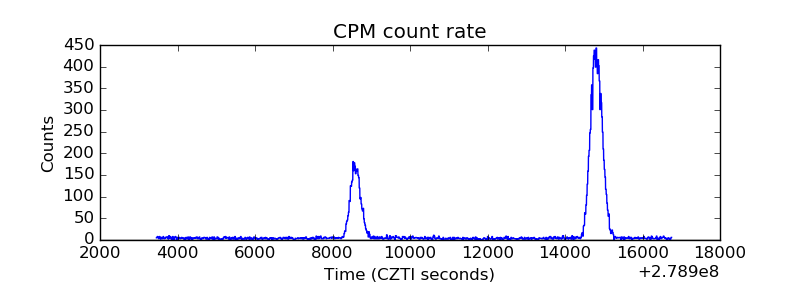 |
| CZT Counter |  |
| +2.5 Volts monitor |  |
| +5 Volts monitor | 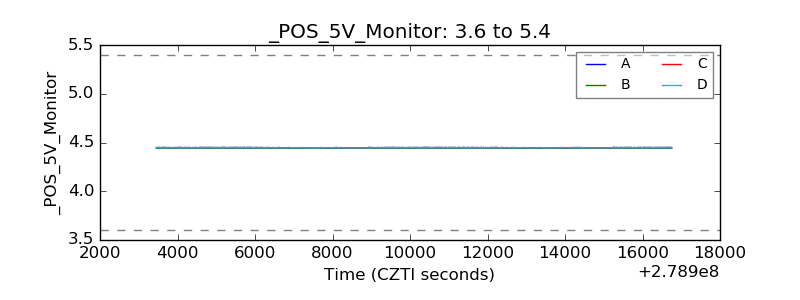 |
| _ROLL_ROT | 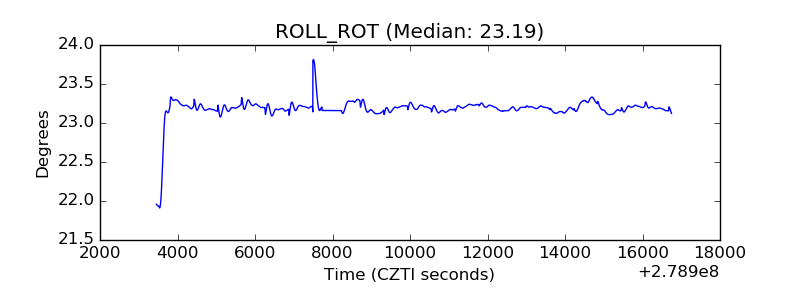 |
| _Roll_DEC | 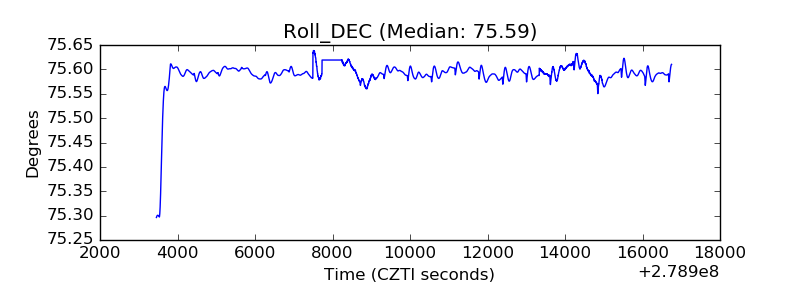 |
| _Roll_RA | 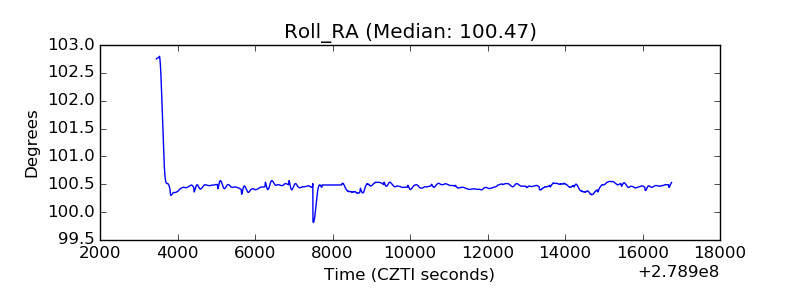 |
| Veto Counter | 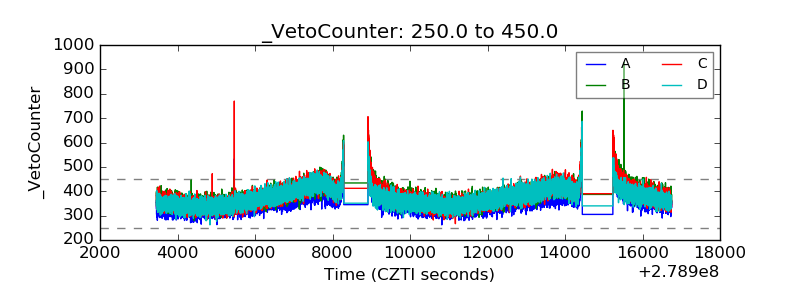 |