| Param | Original file | Final file |
|---|---|---|
| Filename | modeM0/AS1T03_015T01_9000002486_16759cztM0_level2.evt | modeM0/AS1T03_015T01_9000002486_16759cztM0_level2_quad_clean.evt |
| Size (bytes) | 619,516,800 | 127,344,960 |
| Size | 590.8 MB | 121.4 MB |
| Events in quadrant A | 3,777,242 | 899,228 |
| Events in quadrant B | 3,397,926 | 900,700 |
| Events in quadrant C | 3,468,888 | 858,461 |
| Events in quadrant D | 7,685,871 | 752,543 |
| Mode M0 | |||
|---|---|---|---|
| Quadrant | BADHDUFLAG | Total packets | Discarded packets |
| A | 0 | 15284 | 3 |
| B | 0 | 14092 | 2 |
| C | 0 | 14219 | 2 |
| D | 0 | 27204 | 2 |
| Mode M9 | |||
|---|---|---|---|
| Quadrant | BADHDUFLAG | Total packets | Discarded packets |
| A | 0 | 12 | 0 |
| B | 0 | 12 | 0 |
| C | 0 | 12 | 0 |
| D | 0 | 13 | 0 |
| Mode SS | |||
|---|---|---|---|
| Quadrant | BADHDUFLAG | Total packets | Discarded packets |
| A | 0 | 130 | 0 |
| B | 0 | 130 | 0 |
| C | 0 | 130 | 0 |
| D | 0 | 130 | 0 |
| Quadrant | Total seconds | Saturated seconds | Saturation percentage |
|---|---|---|---|
| A | 6384 | 134 | 2.098997% |
| B | 6384 | 86 | 1.347118% |
| C | 6384 | 88 | 1.378446% |
| D | 6384 | 1409 | 22.070802% |
Noise dominated data is calculated using 1-second bins in cleaned event files. If a bin has >2000 counts, and if more than 50% of those come from <1% of pixels, then it is considered to be noise-dominated and hence unusable.
| Quadrant | # 1 sec bins | Bins with >0 counts | Bins with >2000 counts | High rate bins dominated by noise | Noise dominated (total time) | Noise dominated (detector-on time) | Marked lightcurve |
|---|---|---|---|---|---|---|---|
| A | 7585 | 6386 | 60 | 60 | 0.79% | 0.94% | 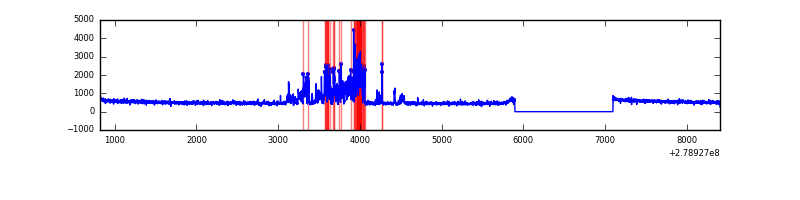 |
| B | 7585 | 6386 | 16 | 16 | 0.21% | 0.25% | 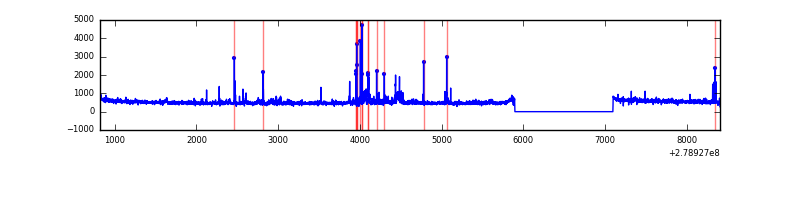 |
| C | 7585 | 6386 | 4 | 4 | 0.05% | 0.06% | 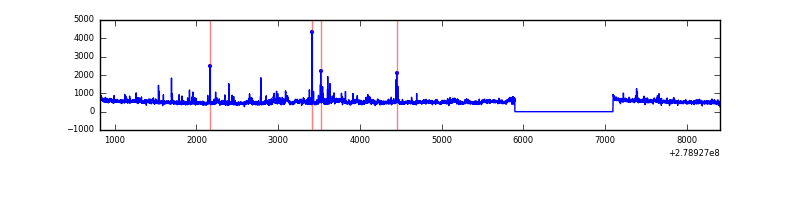 |
| D | 7585 | 6385 | 992 | 992 | 13.08% | 15.54% | 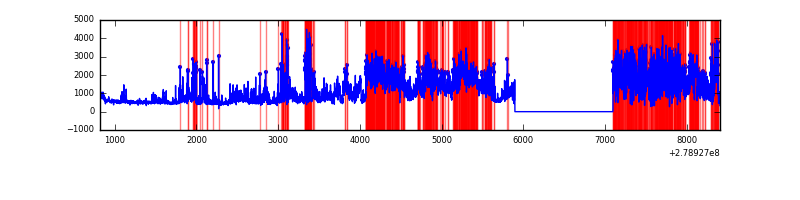 |
Top three noisy pixels from each quadrant. If the there are fewer than three noisy pixels in the level2.evt file, extra rows are filled as -1
| Pixel properties | Quadrant properties | ||||||
|---|---|---|---|---|---|---|---|
| Quadrant | DetID | PixID | Counts | Sigma | Mean | Median | Sigma |
| A | 14 | 4 | 657019 | 4142.62 | 806 | 788 | 158.4 |
| A | 15 | 174 | 20437 | 124.04 | 806 | 788 | 158.4 |
| A | 0 | 226 | 7285 | 41.01 | 806 | 788 | 158.4 |
| B | 15 | 35 | 107604 | 725.45 | 793 | 775 | 147.3 |
| B | 5 | 236 | 57712 | 386.64 | 793 | 775 | 147.3 |
| B | 0 | 189 | 51992 | 347.8 | 793 | 775 | 147.3 |
| C | 3 | 233 | 232912 | 1334.38 | 756 | 762 | 174.0 |
| C | 0 | 207 | 158502 | 906.67 | 756 | 762 | 174.0 |
| C | 14 | 238 | 119166 | 680.57 | 756 | 762 | 174.0 |
| D | 1 | 52 | 4007760 | 23366.6 | 710 | 689 | 171.5 |
| D | 12 | 110 | 319510 | 1859.15 | 710 | 689 | 171.5 |
| D | 13 | 232 | 242857 | 1412.16 | 710 | 689 | 171.5 |
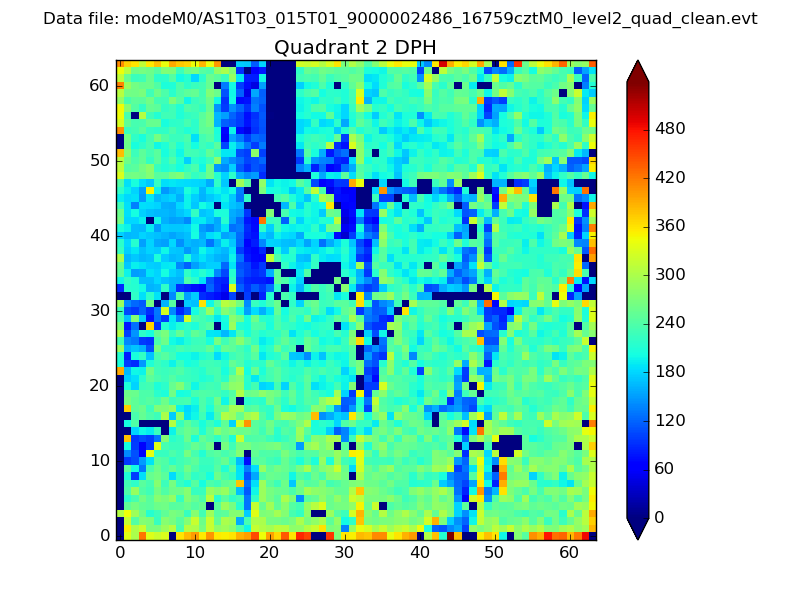
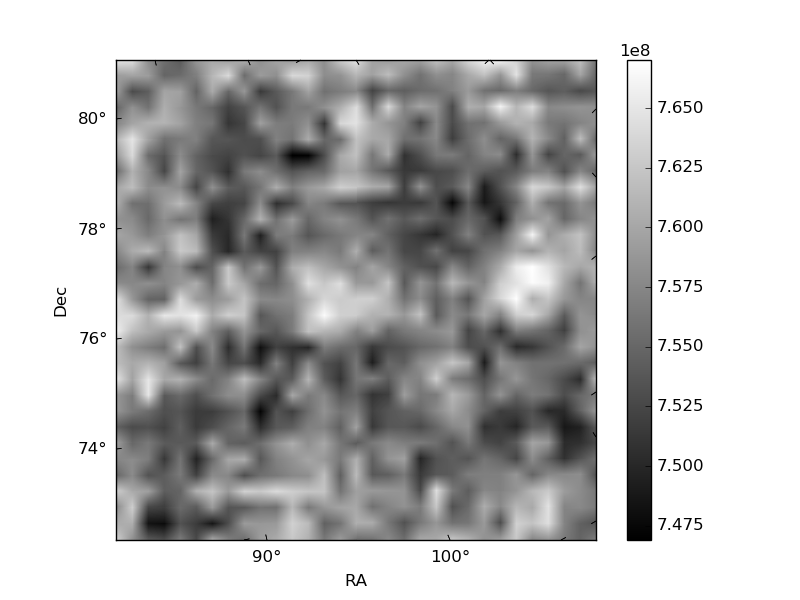
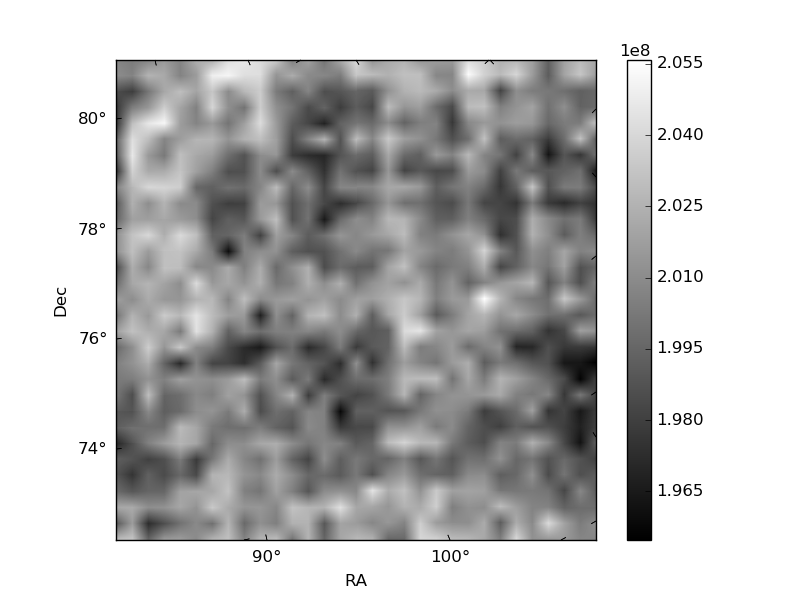
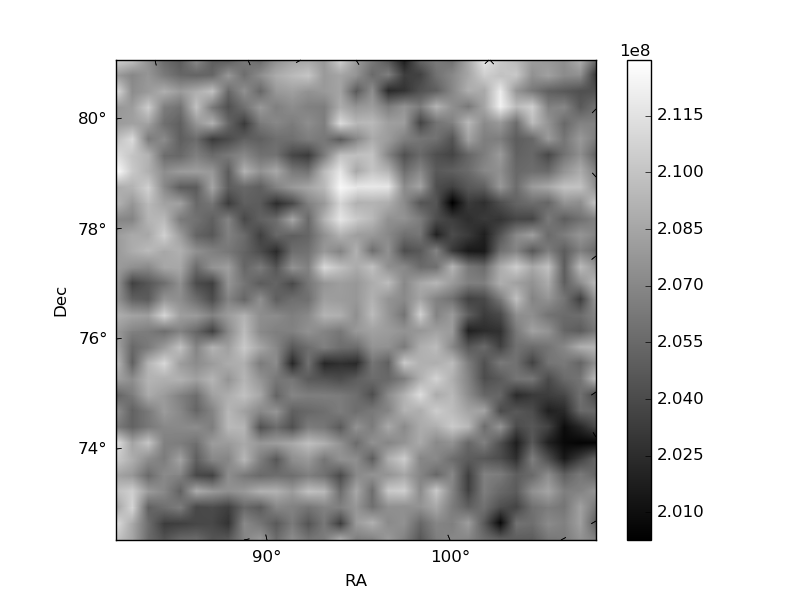
Histogram calculated using DETX and DETY for each event in the final _common_clean file
| Quadrant A | 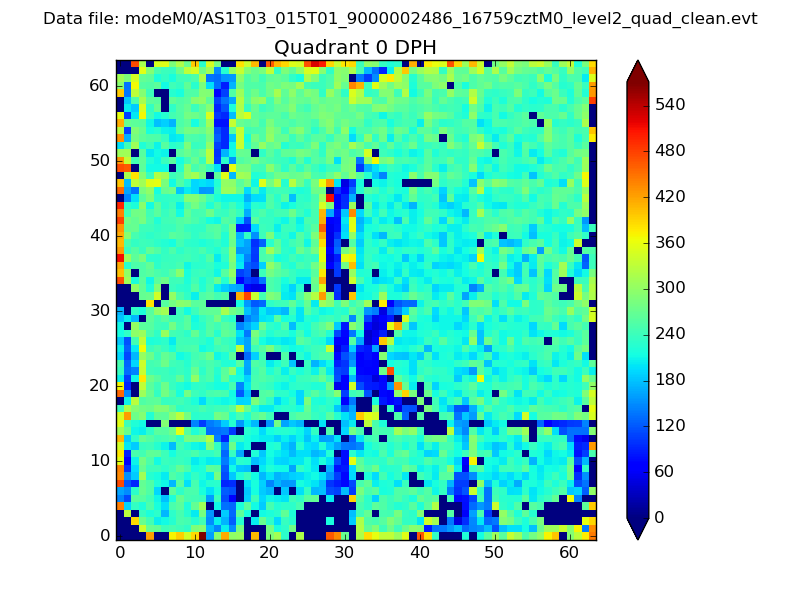 |
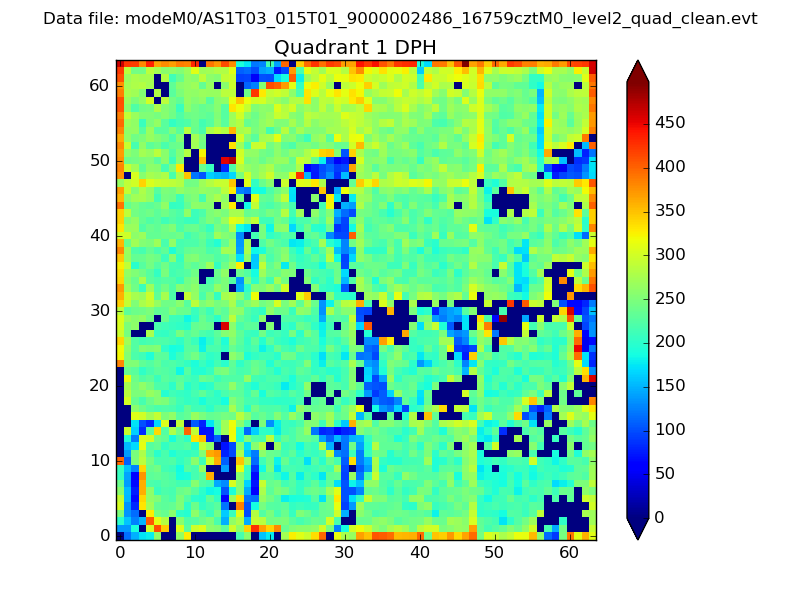 |
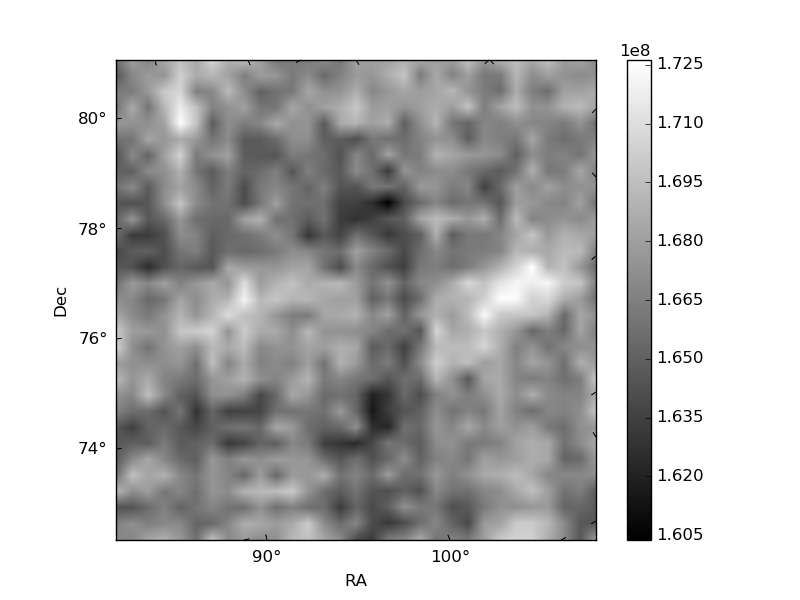
Quadrant B |
|---|---|---|---|
| Quadrant D | 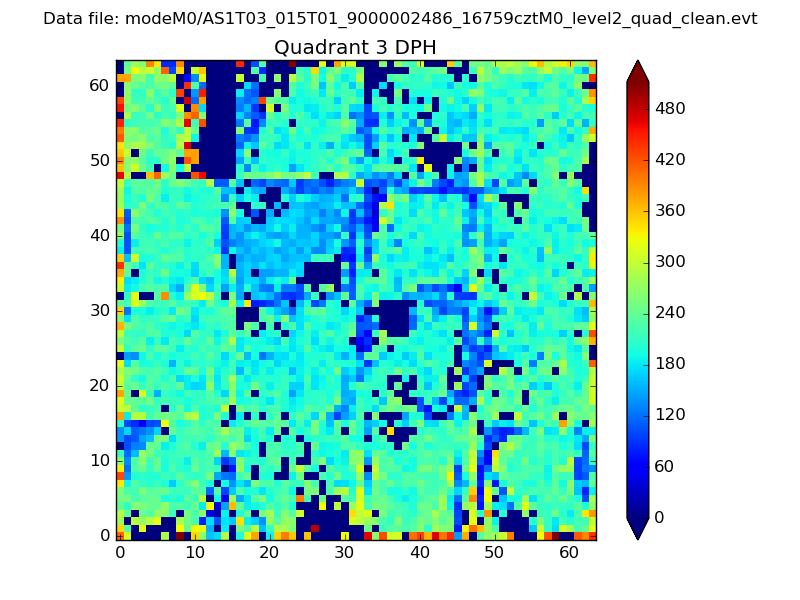 |
 |
Quadrant C |
| Plot type | Count rate plots | Images |
|---|---|---|
| Comparison with Poisson distribution Blue bars denote a histogram of data divided into 1 sec bins. Red curve is a Poisson curve with rate = median count rate of data. |
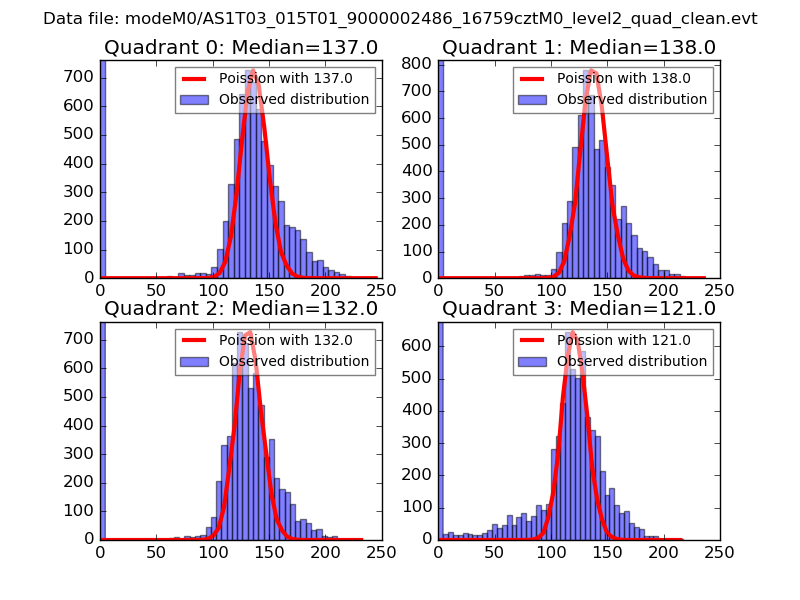 |
 |
| Quadrant-wise count rates Data is divided into 100 sec bins |
 |
|
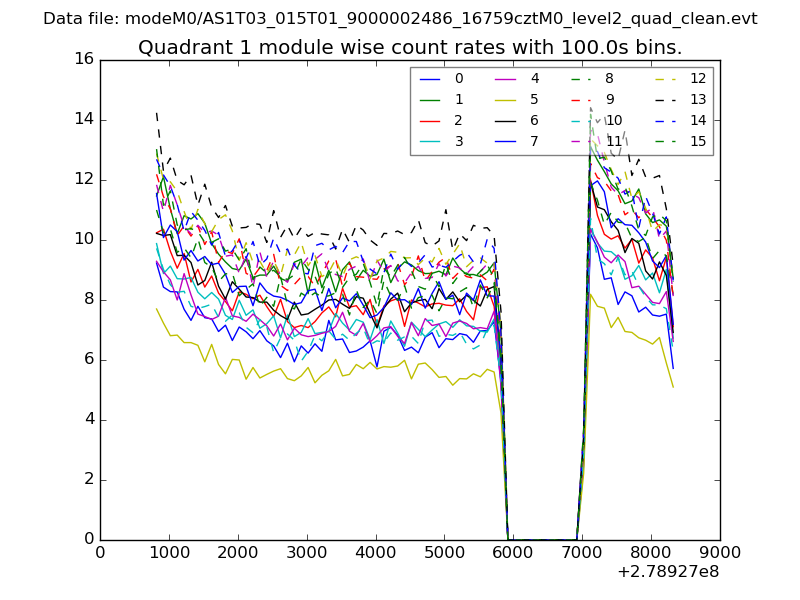
| Module-wise count rates for Quadrant A Data is divided into 100 sec bins |
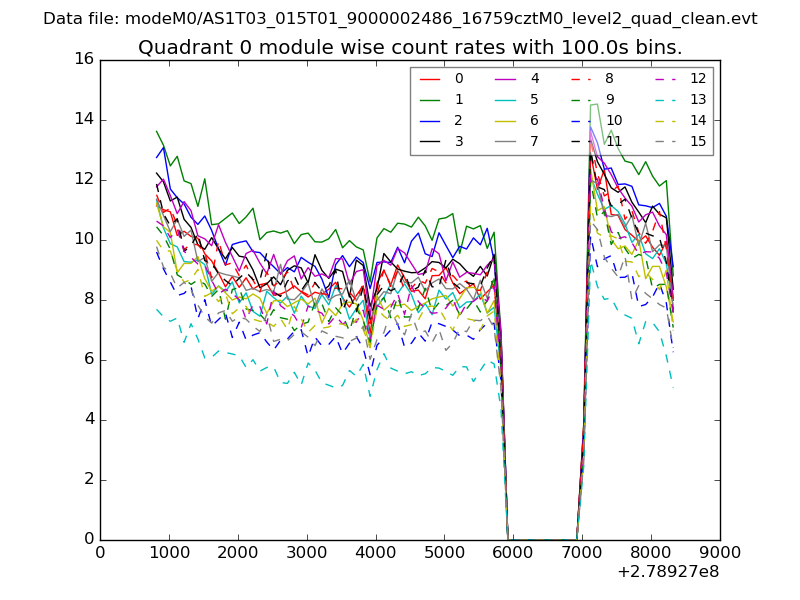 |
 |
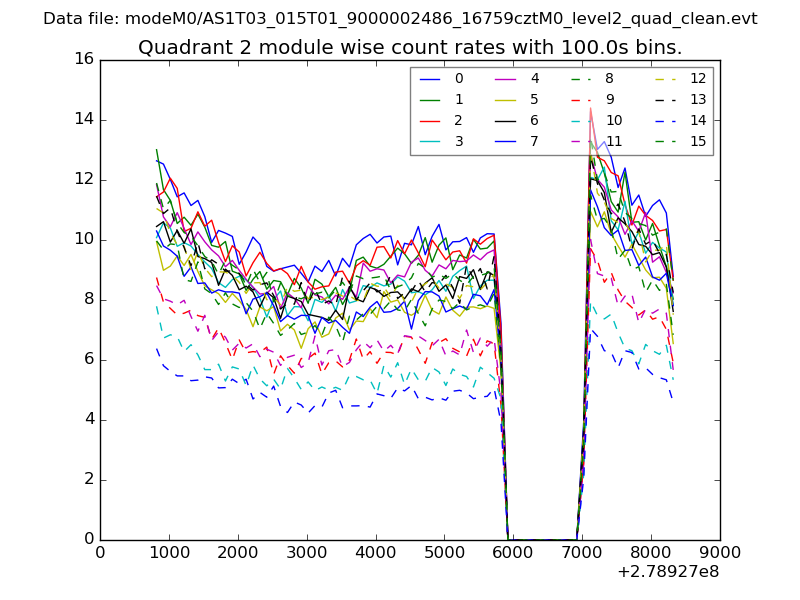
| Module-wise count rates for Quadrant B Data is divided into 100 sec bins |
 |
 |
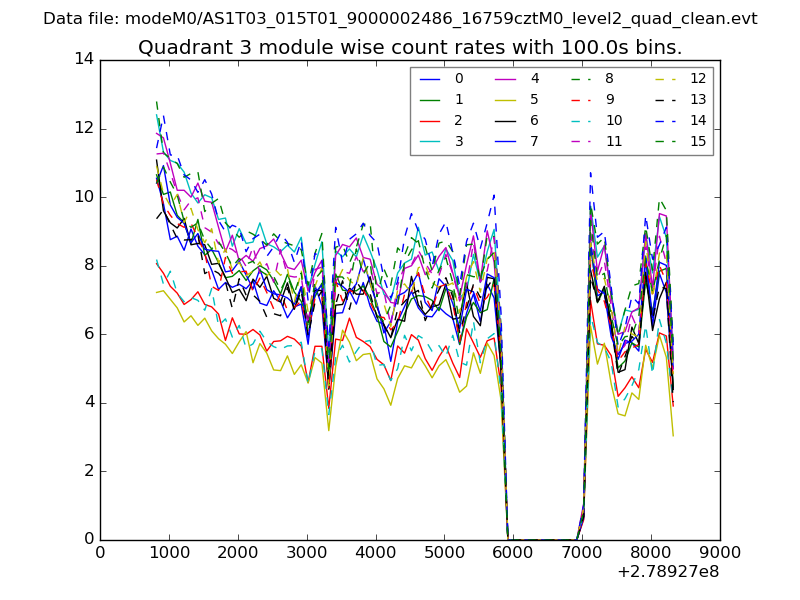
| Module-wise count rates for Quadrant C Data is divided into 100 sec bins |
 |
 |
| Module-wise count rates for Quadrant D Data is divided into 100 sec bins |
 |
 |
| Parameter | Plot |
|---|---|
| CZT HV Monitor | 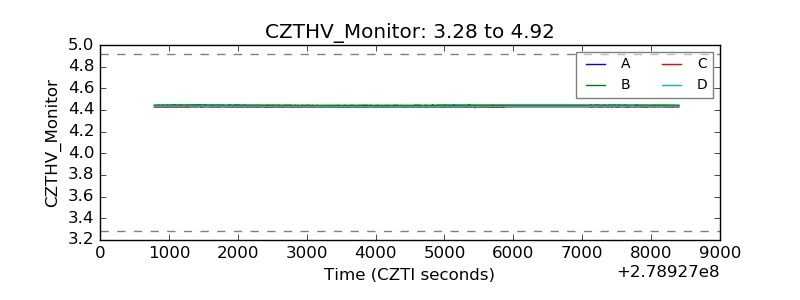 |
| D_VDD | 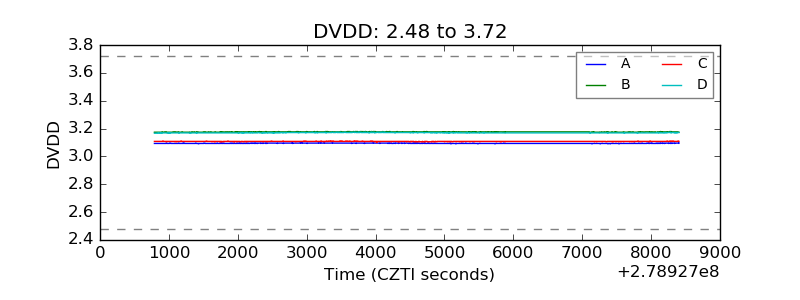 |
| Temperature 1 | 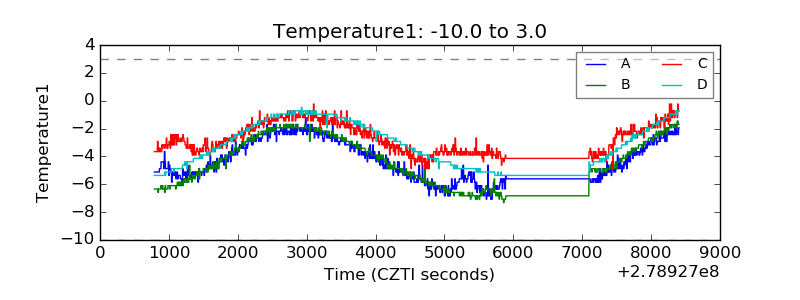 |
| Veto HV Monitor | 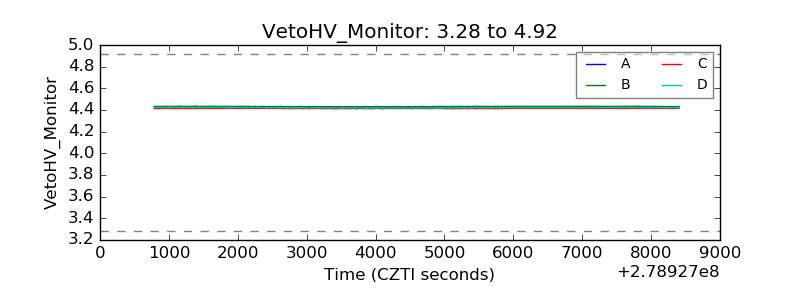 |
| Veto LLD | 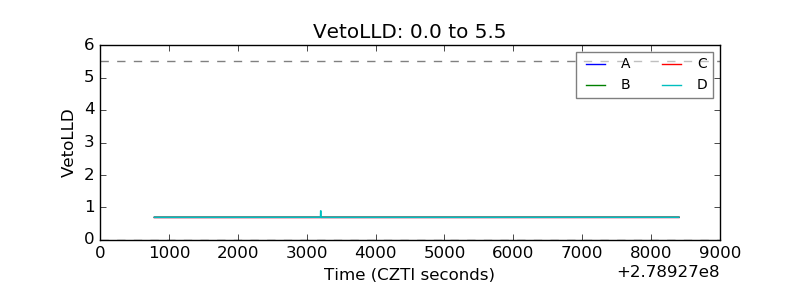 |
| Alpha Counter | 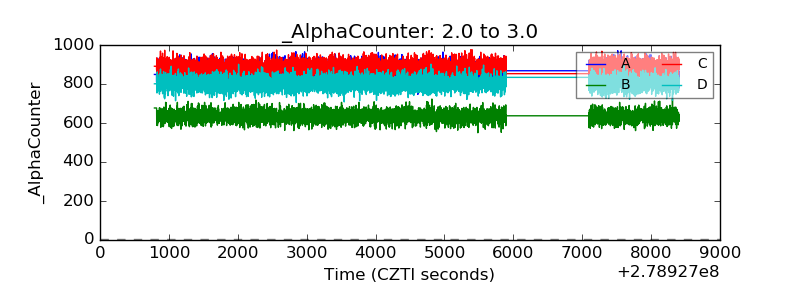 |
| _CPM_Rate |  |
| CZT Counter | 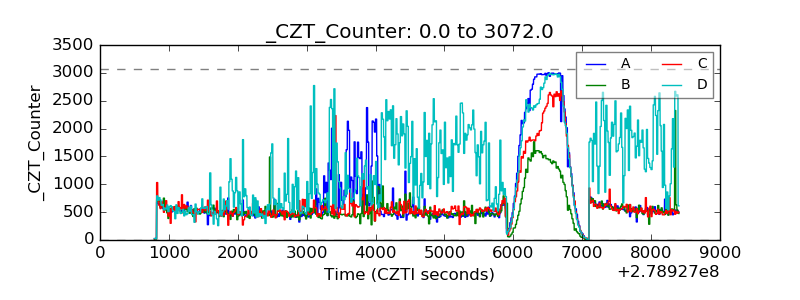 |
| +2.5 Volts monitor |  |
| +5 Volts monitor | 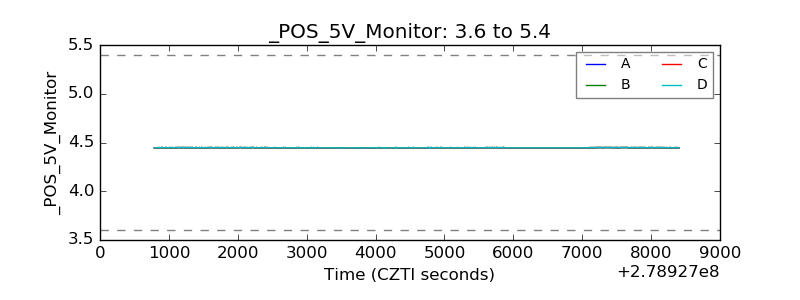 |
| _ROLL_ROT | 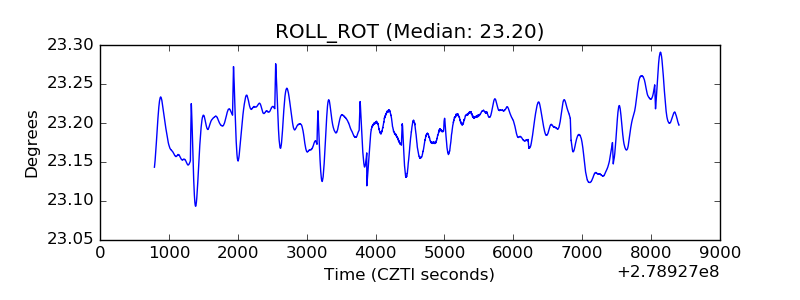 |
| _Roll_DEC | 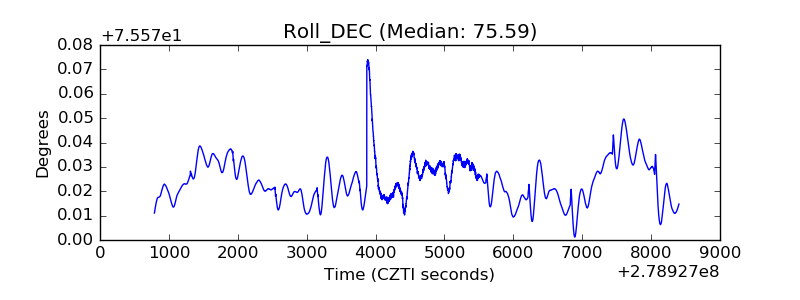 |
| _Roll_RA | 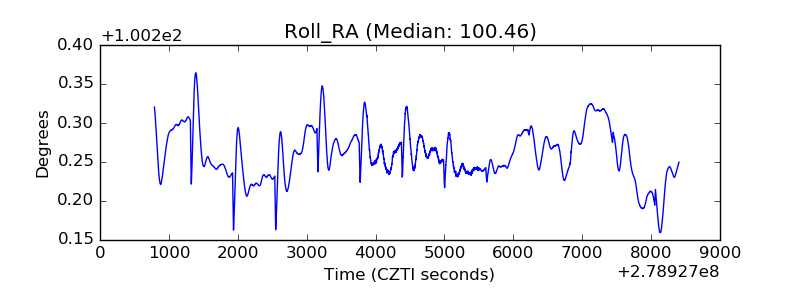 |
| Veto Counter | 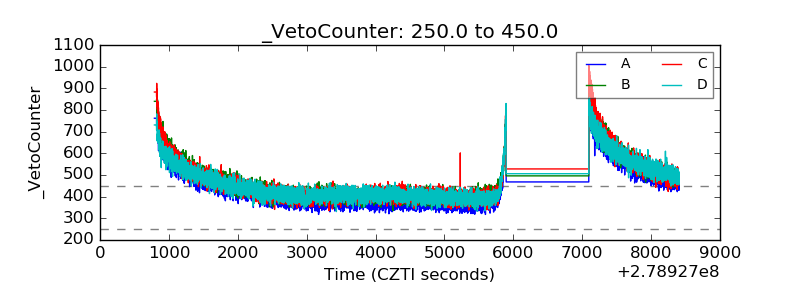 |