| Param | Original file | Final file |
|---|---|---|
| Filename | modeM0/AS1T03_015T01_9000002486_16760cztM0_level2.evt | modeM0/AS1T03_015T01_9000002486_16760cztM0_level2_quad_clean.evt |
| Size (bytes) | 331,260,480 | 55,923,840 |
| Size | 315.9 MB | 53.3 MB |
| Events in quadrant A | 1,484,937 | 415,643 |
| Events in quadrant B | 1,692,692 | 410,104 |
| Events in quadrant C | 1,588,835 | 386,906 |
| Events in quadrant D | 5,069,021 | 274,490 |
| Mode M0 | |||
|---|---|---|---|
| Quadrant | BADHDUFLAG | Total packets | Discarded packets |
| A | 0 | 6099 | 4 |
| B | 0 | 6736 | 13 |
| C | 0 | 6605 | 6 |
| D | 0 | 17106 | 40 |
| Mode SS | |||
|---|---|---|---|
| Quadrant | BADHDUFLAG | Total packets | Discarded packets |
| A | 0 | 58 | 0 |
| B | 0 | 58 | 2 |
| C | 0 | 58 | 0 |
| D | 0 | 58 | 0 |
| Quadrant | Total seconds | Saturated seconds | Saturation percentage |
|---|---|---|---|
| A | 2881 | 12 | 0.416522% |
| B | 2879 | 34 | 1.180966% |
| C | 2881 | 13 | 0.451232% |
| D | 2876 | 1523 | 52.955494% |
Noise dominated data is calculated using 1-second bins in cleaned event files. If a bin has >2000 counts, and if more than 50% of those come from <1% of pixels, then it is considered to be noise-dominated and hence unusable.
| Quadrant | # 1 sec bins | Bins with >0 counts | Bins with >2000 counts | High rate bins dominated by noise | Noise dominated (total time) | Noise dominated (detector-on time) | Marked lightcurve |
|---|---|---|---|---|---|---|---|
| A | 2884 | 2884 | 8 | 8 | 0.28% | 0.28% | 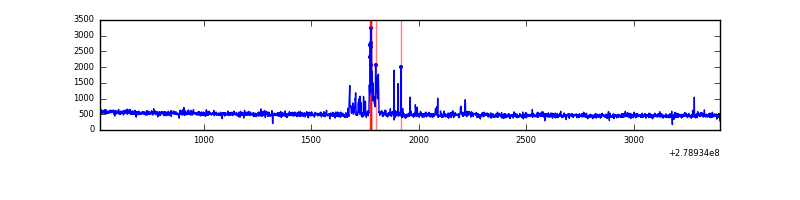 |
| B | 2884 | 2884 | 25 | 25 | 0.87% | 0.87% | 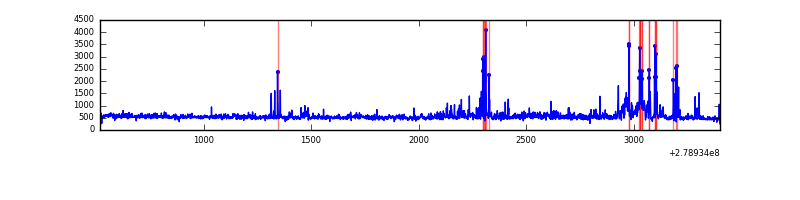 |
| C | 2884 | 2884 | 0 | 0 | 0.00% | 0.00% |  |
| D | 2884 | 2884 | 1065 | 1065 | 36.93% | 36.93% | 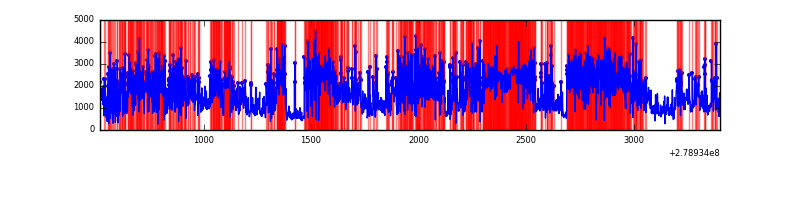 |
Top three noisy pixels from each quadrant. If the there are fewer than three noisy pixels in the level2.evt file, extra rows are filled as -1
| Pixel properties | Quadrant properties | ||||||
|---|---|---|---|---|---|---|---|
| Quadrant | DetID | PixID | Counts | Sigma | Mean | Median | Sigma |
| A | 15 | 174 | 87621 | 1193.21 | 361 | 353 | 73.1 |
| A | 14 | 4 | 9272 | 121.95 | 361 | 353 | 73.1 |
| A | 0 | 226 | 3262 | 39.77 | 361 | 353 | 73.1 |
| B | 15 | 35 | 82626 | 1247.26 | 350 | 342 | 66.0 |
| B | 0 | 189 | 68055 | 1026.39 | 350 | 342 | 66.0 |
| B | 7 | 220 | 59250 | 892.93 | 350 | 342 | 66.0 |
| C | 3 | 233 | 191376 | 2434.67 | 337 | 340 | 78.5 |
| C | 14 | 238 | 54399 | 688.96 | 337 | 340 | 78.5 |
| C | 0 | 207 | 22582 | 283.46 | 337 | 340 | 78.5 |
| D | 1 | 52 | 2477201 | 38524.24 | 263 | 255 | 64.3 |
| D | 13 | 232 | 1414596 | 21997.42 | 263 | 255 | 64.3 |
| D | 2 | 33 | 79474 | 1232.1 | 263 | 255 | 64.3 |
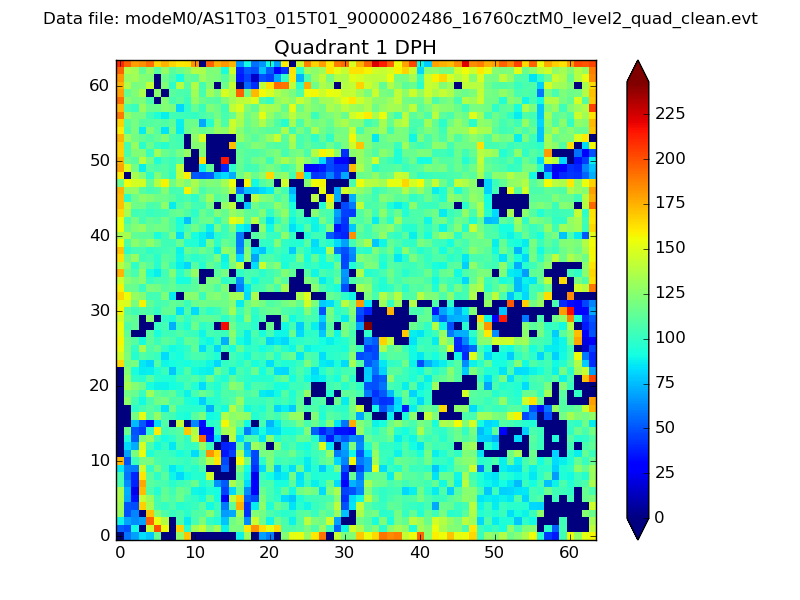
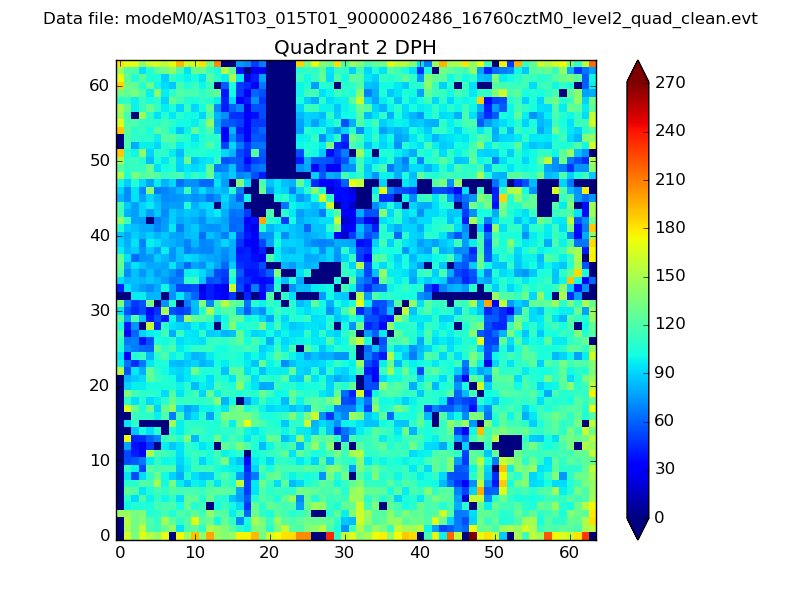
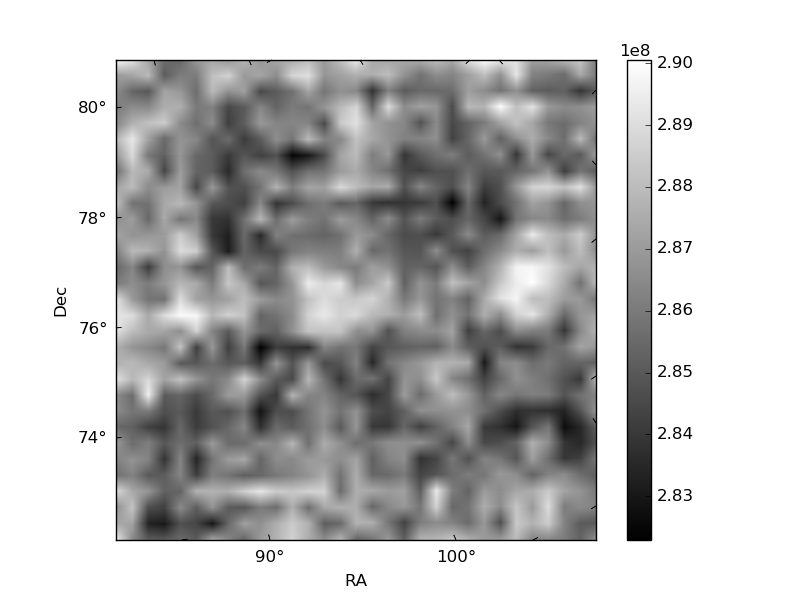
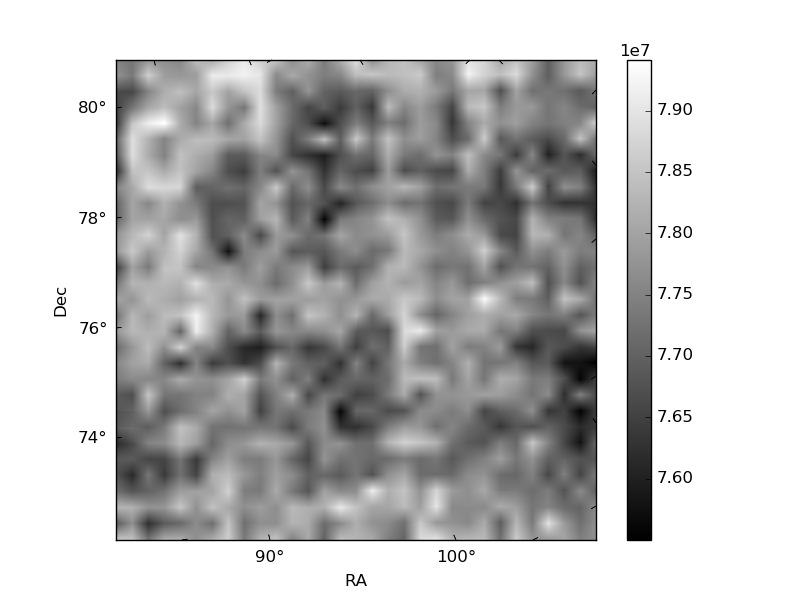
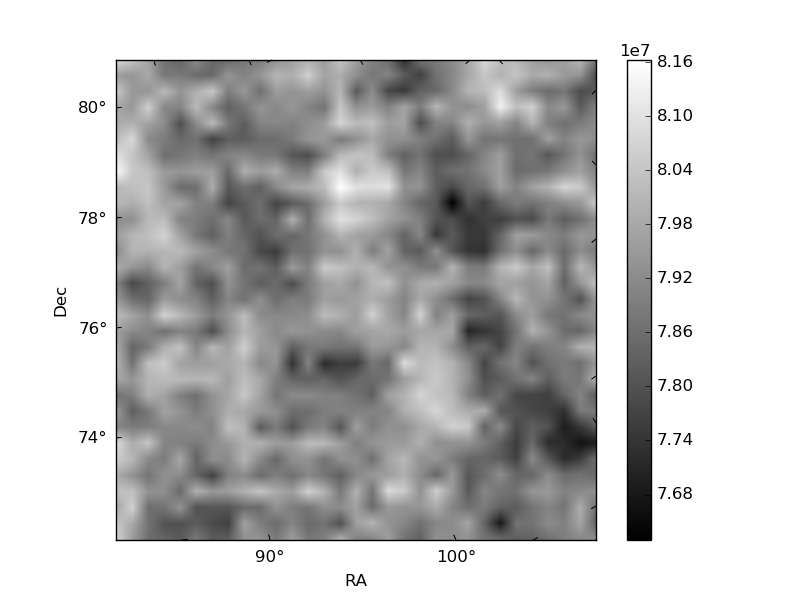
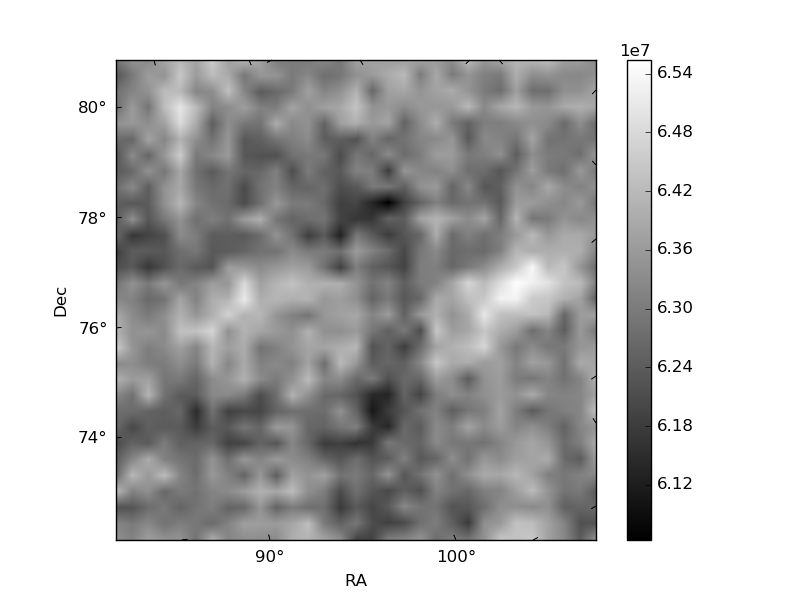
Histogram calculated using DETX and DETY for each event in the final _common_clean file
| Quadrant A | 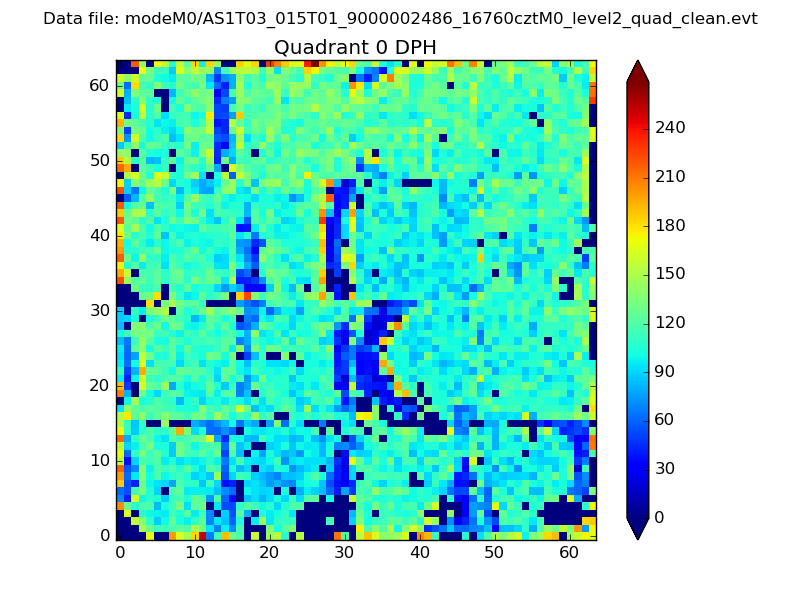 |
 |
Quadrant B |
|---|---|---|---|
| Quadrant D | 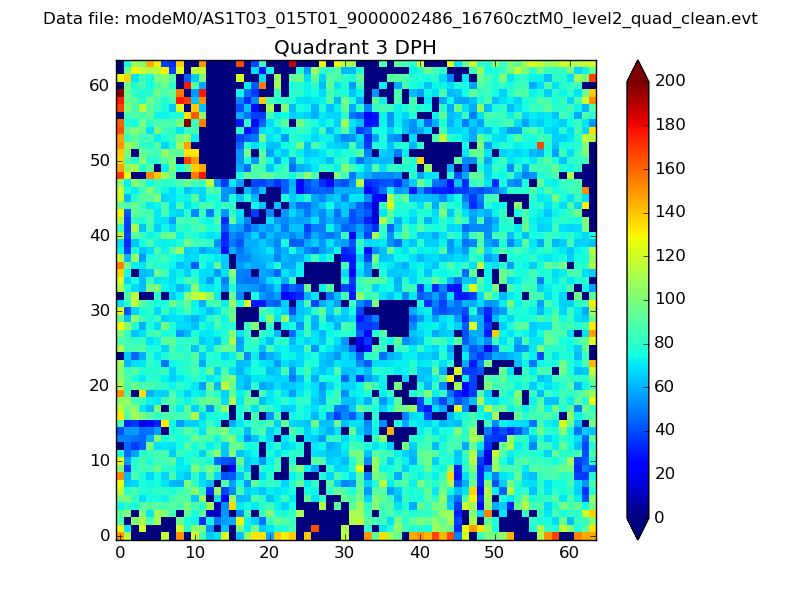 |
 |
Quadrant C |
| Plot type | Count rate plots | Images |
|---|---|---|
| Comparison with Poisson distribution Blue bars denote a histogram of data divided into 1 sec bins. Red curve is a Poisson curve with rate = median count rate of data. |
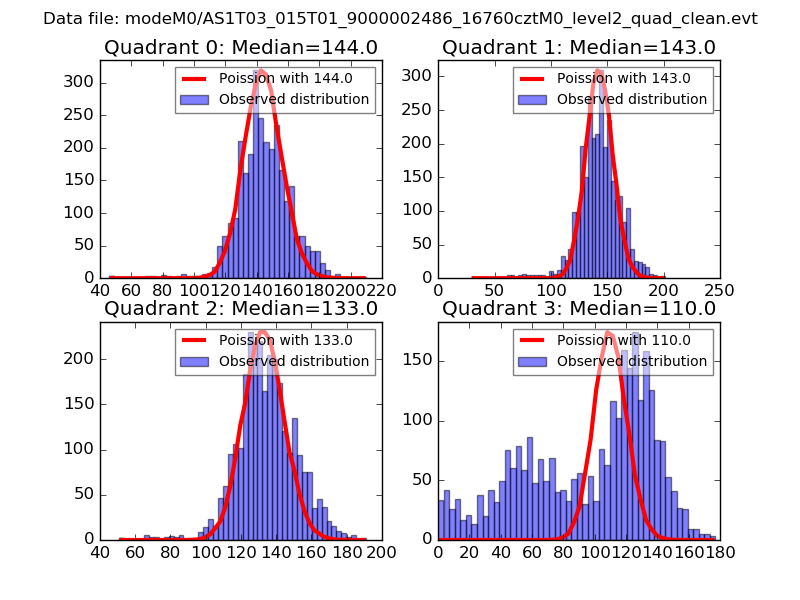 |
 |
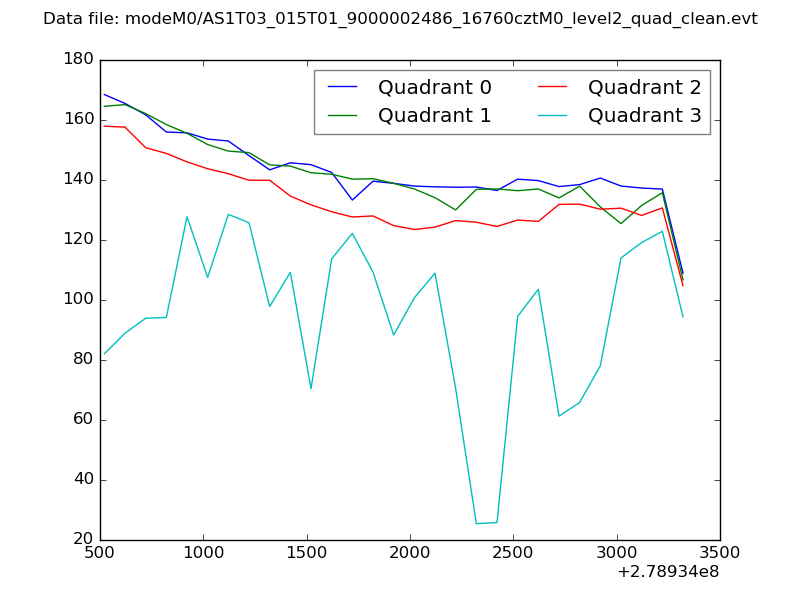
| Quadrant-wise count rates Data is divided into 100 sec bins |
 |
|
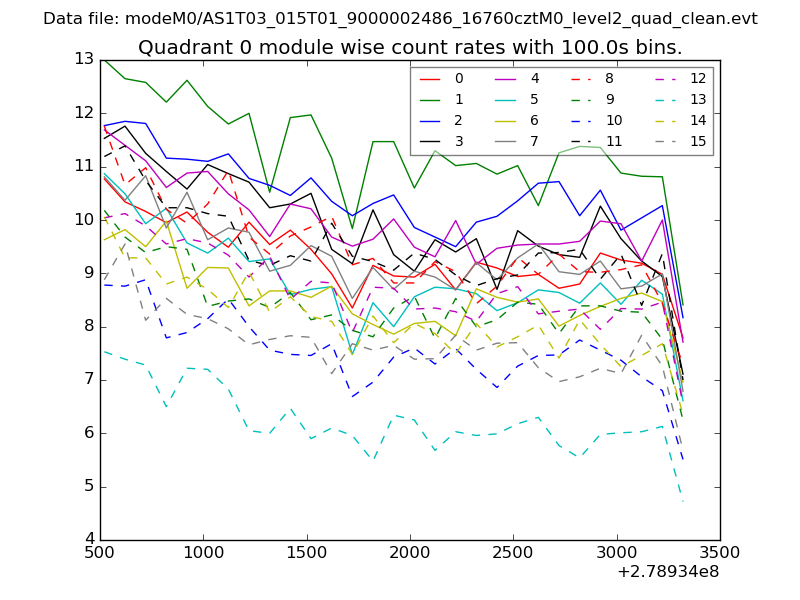
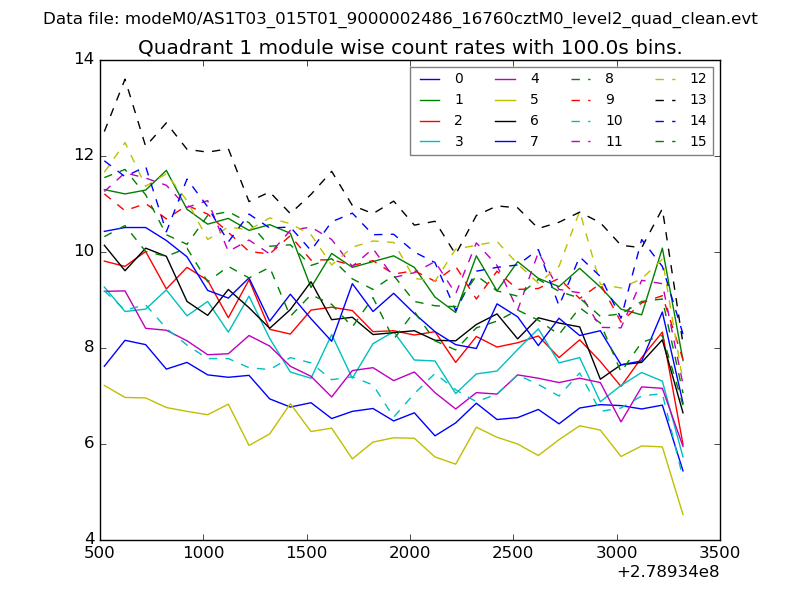
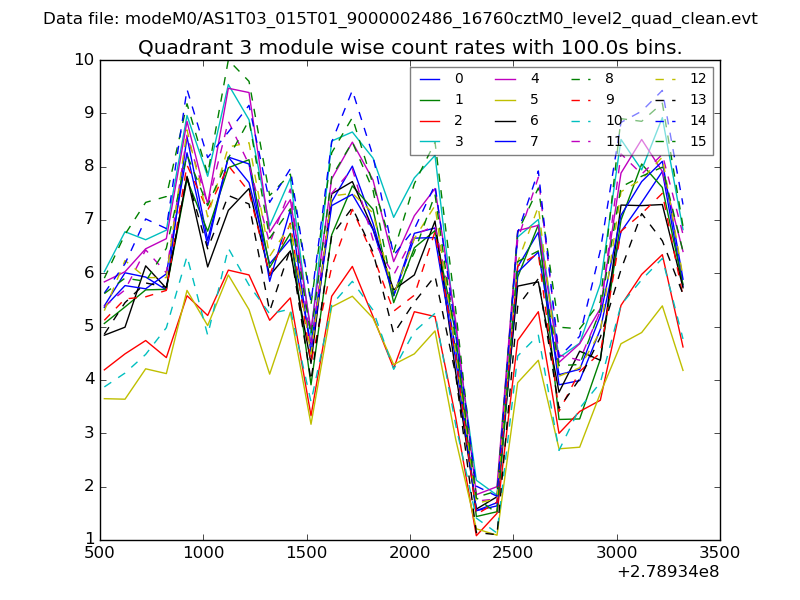
| Module-wise count rates for Quadrant A Data is divided into 100 sec bins |
 |
 |
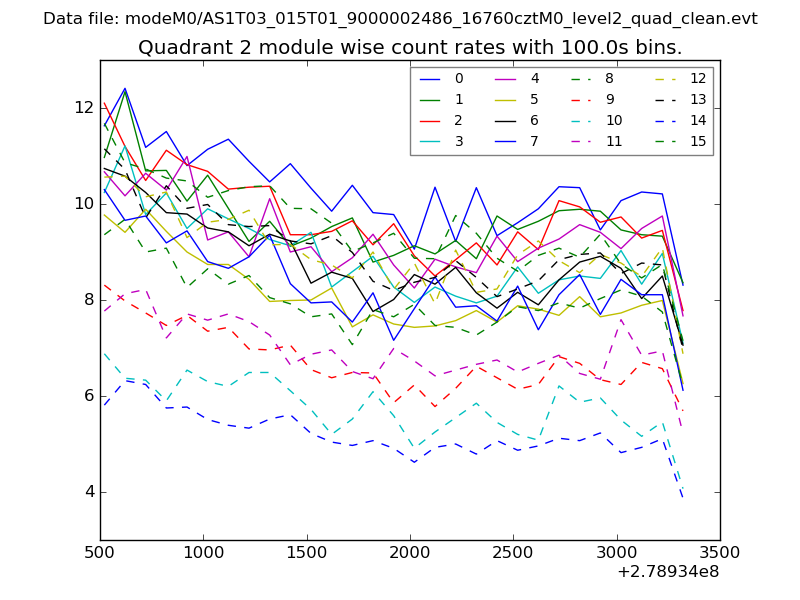
| Module-wise count rates for Quadrant B Data is divided into 100 sec bins |
 |
 |
| Module-wise count rates for Quadrant C Data is divided into 100 sec bins |
 |
 |
| Module-wise count rates for Quadrant D Data is divided into 100 sec bins |
 |
 |
| Parameter | Plot |
|---|---|
| CZT HV Monitor | 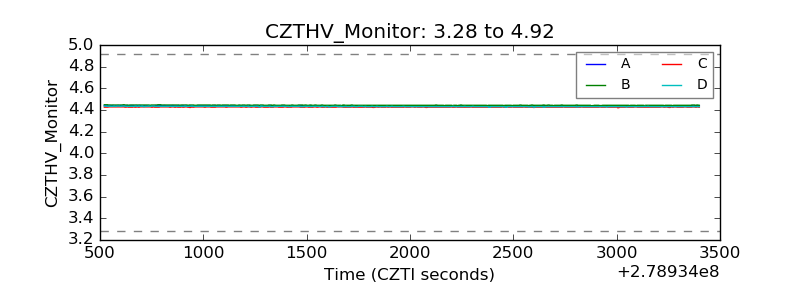 |
| D_VDD | 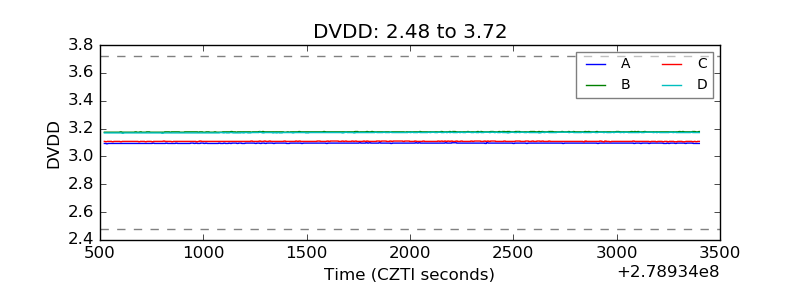 |
| Temperature 1 | 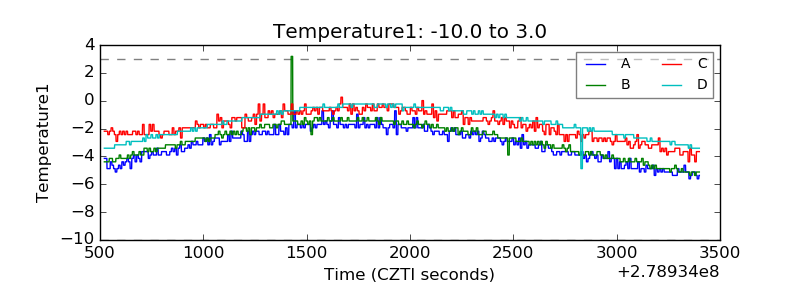 |
| Veto HV Monitor |  |
| Veto LLD | 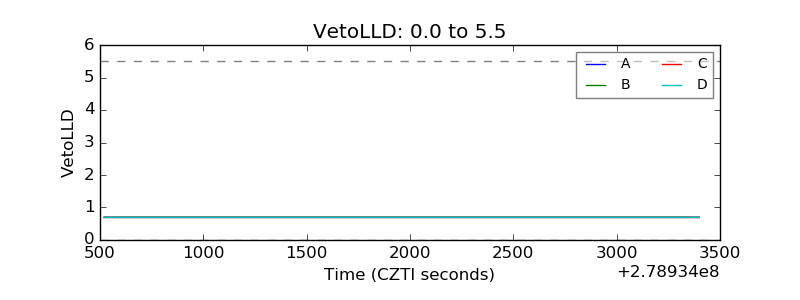 |
| Alpha Counter | 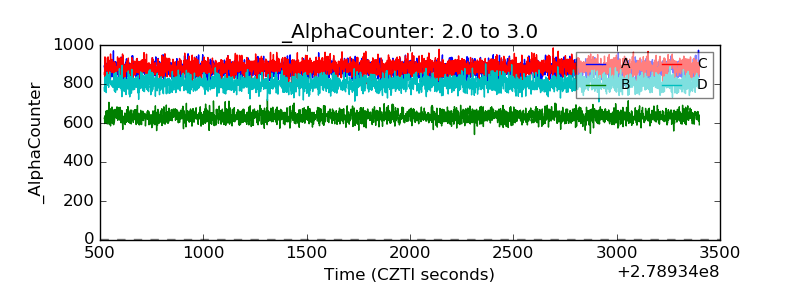 |
| _CPM_Rate | 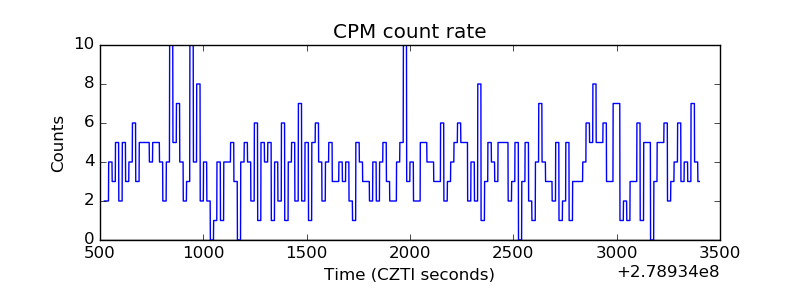 |
| CZT Counter | 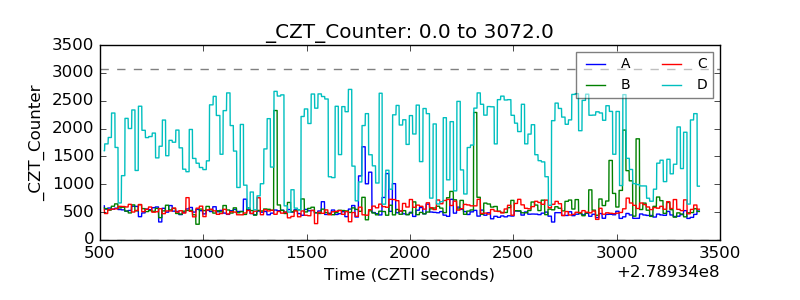 |
| +2.5 Volts monitor |  |
| +5 Volts monitor |  |
| _ROLL_ROT | 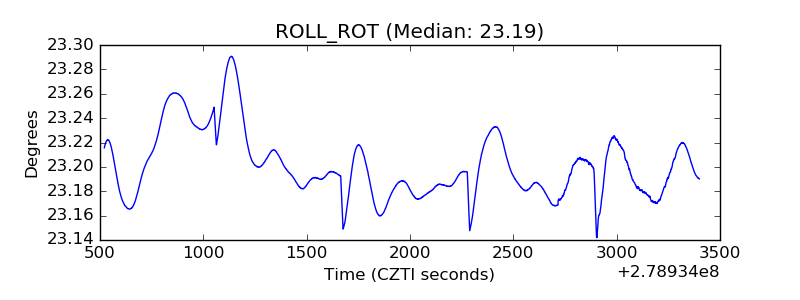 |
| _Roll_DEC | 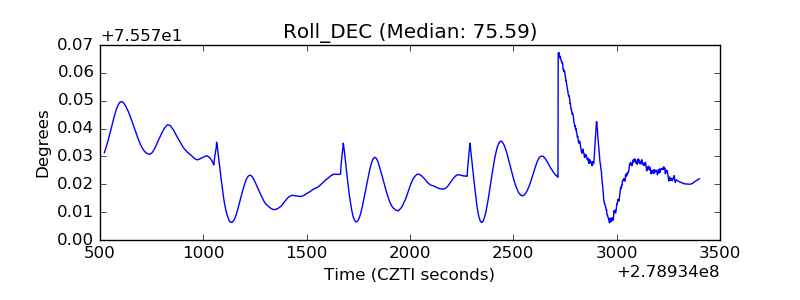 |
| _Roll_RA | 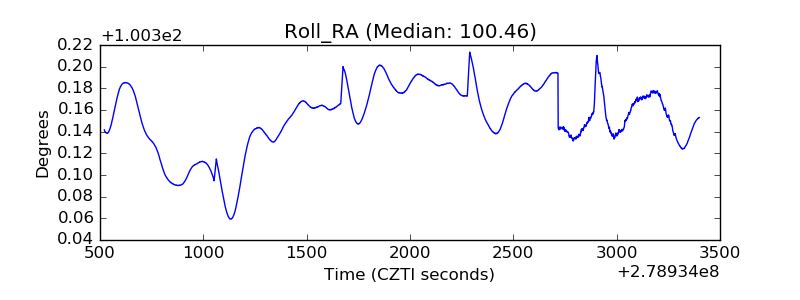 |
| Veto Counter | 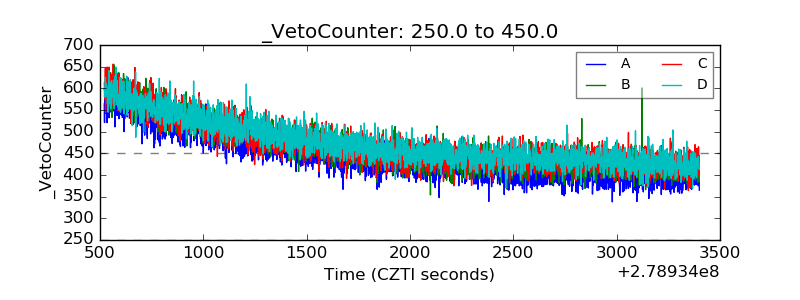 |