| Param | Original file | Final file |
|---|---|---|
| Filename | modeM0/AS1A05_004T02_9000002490cztM0_level2.fits | modeM0/AS1A05_004T02_9000002490cztM0_level2_quad_clean.evt |
| Size (bytes) | 489,003,840 | 410,492,160 |
| Size | 466.4 MB | 391.5 MB |
| Events in quadrant A | 3,139,042 | 2,436,247 |
| Events in quadrant B | 3,056,974 | 2,580,935 |
| Events in quadrant C | 3,070,976 | 2,454,328 |
| Events in quadrant D | 2,014,162 | 1,440,199 |
| Mode M0 | |||
|---|---|---|---|
| Quadrant | BADHDUFLAG | Total packets | Discarded packets |
| A | 0 | 135145 | 0 |
| B | 0 | 113458 | 0 |
| C | 0 | 130680 | 0 |
| D | 0 | 243464 | 0 |
| Mode SS | |||
|---|---|---|---|
| Quadrant | BADHDUFLAG | Total packets | Discarded packets |
| A | 0 | 1050 | 0 |
| B | 0 | 1050 | 0 |
| C | 0 | 1050 | 0 |
| D | 0 | 1050 | 0 |
| Mode M9 | |||
|---|---|---|---|
| Quadrant | BADHDUFLAG | Total packets | Discarded packets |
| A | 0 | 85 | 0 |
| B | 0 | 85 | 0 |
| C | 0 | 85 | 0 |
| D | 0 | 85 | 0 |
| Quadrant | Total seconds | Saturated seconds | Saturation percentage |
|---|---|---|---|
| A | 51252 | 3243 | 6.327558% |
| B | 51252 | 874 | 1.705299% |
| C | 51252 | 1581 | 3.084758% |
| D | 51252 | 19189 | 37.440490% |
Noise dominated data is calculated using 1-second bins in cleaned event files. If a bin has >2000 counts, and if more than 50% of those come from <1% of pixels, then it is considered to be noise-dominated and hence unusable.
| Quadrant | # 1 sec bins | Bins with >0 counts | Bins with >2000 counts | High rate bins dominated by noise | Noise dominated (total time) | Noise dominated (detector-on time) | Marked lightcurve |
|---|---|---|---|---|---|---|---|
| A | 60042 | 51223 | 0 | 0 | 0.00% | 0.00% |  |
| B | 60042 | 51249 | 0 | 0 | 0.00% | 0.00% |  |
| C | 60042 | 51253 | 0 | 0 | 0.00% | 0.00% |  |
| D | 60042 | 48873 | 0 | 0 | 0.00% | 0.00% |  |
Top three noisy pixels from each quadrant. If the there are fewer than three noisy pixels in the level2.evt file, extra rows are filled as -1
| Pixel properties | Quadrant properties | ||||||
|---|---|---|---|---|---|---|---|
| Quadrant | DetID | PixID | Counts | Sigma | Mean | Median | Sigma |
| A | 0 | 29 | 2592 | 9.07 | 817 | 766 | 201.4 |
| A | 7 | 110 | 2395 | 8.09 | 817 | 766 | 201.4 |
| A | 9 | 19 | 2323 | 7.73 | 817 | 766 | 201.4 |
| B | 2 | 9 | 2519 | 11.12 | 808 | 771 | 157.2 |
| B | 2 | 8 | 2065 | 8.23 | 808 | 771 | 157.2 |
| B | 3 | 17 | 2060 | 8.2 | 808 | 771 | 157.2 |
| C | 1 | 81 | 2371 | 7.71 | 810 | 756 | 209.4 |
| C | 1 | 80 | 2359 | 7.66 | 810 | 756 | 209.4 |
| C | 2 | 191 | 2098 | 6.41 | 810 | 756 | 209.4 |
| D | 6 | 231 | 1481 | 6.35 | 573 | 523 | 151.0 |
| D | 6 | 67 | 1406 | 5.85 | 573 | 523 | 151.0 |
| D | 13 | 238 | 1392 | 5.76 | 573 | 523 | 151.0 |
Histogram calculated using DETX and DETY for each event in the final _common_clean file
| Quadrant A |  |
 |
Quadrant B |
|---|---|---|---|
| Quadrant D |  |
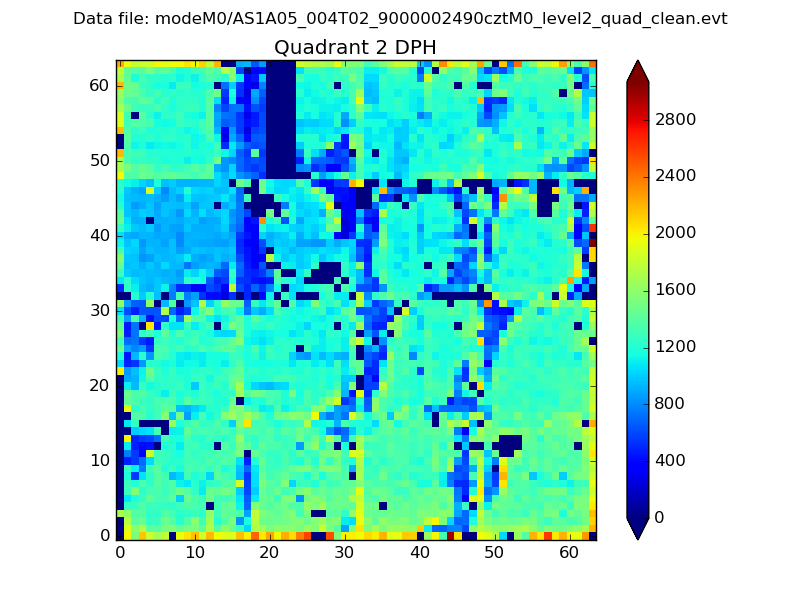 |
Quadrant C |
| Plot type | Count rate plots | Images |
|---|---|---|
| Comparison with Poisson distribution Blue bars denote a histogram of data divided into 1 sec bins. Red curve is a Poisson curve with rate = median count rate of data. |
 |
 |
| Quadrant-wise count rates Data is divided into 100 sec bins |
 |
|
| Module-wise count rates for Quadrant A Data is divided into 100 sec bins |
 |
 |
| Module-wise count rates for Quadrant B Data is divided into 100 sec bins |
 |
 |
| Module-wise count rates for Quadrant C Data is divided into 100 sec bins |
 |
 |
| Module-wise count rates for Quadrant D Data is divided into 100 sec bins |
 |
 |
| Parameter | Plot |
|---|---|
| CZT HV Monitor |  |
| D_VDD | 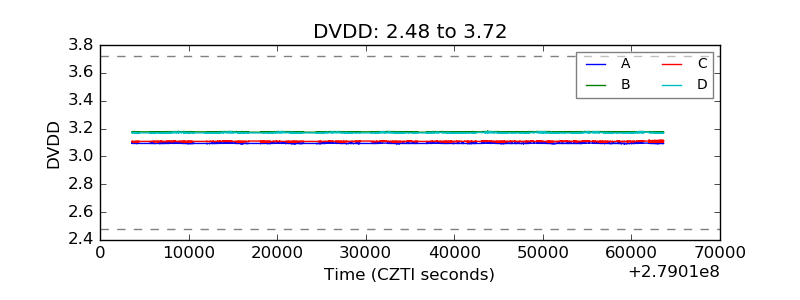 |
| Temperature 1 |  |
| Veto HV Monitor |  |
| Veto LLD |  |
| Alpha Counter |  |
| _CPM_Rate |  |
| CZT Counter |  |
| +2.5 Volts monitor | 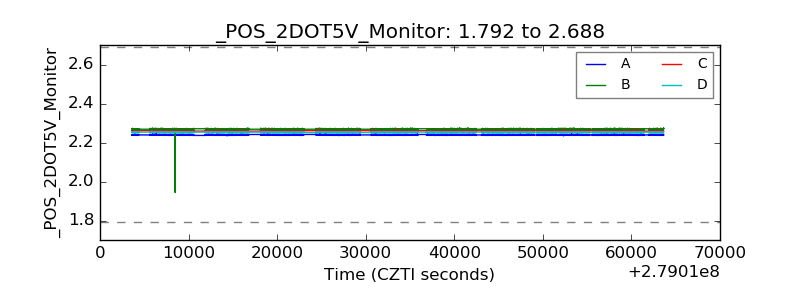 |
| +5 Volts monitor |  |
| _ROLL_ROT | 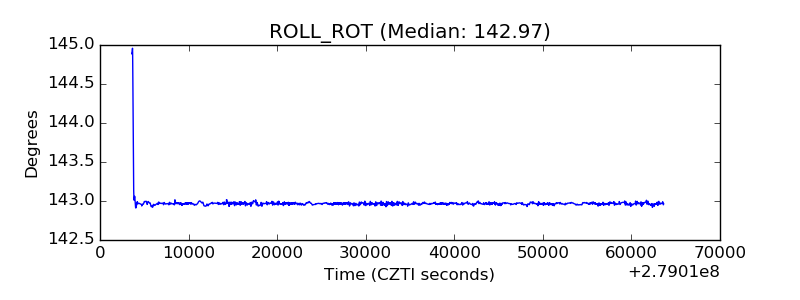 |
| _Roll_DEC |  |
| _Roll_RA |  |
| Veto Counter |  |