| Param | Original file | Final file |
|---|---|---|
| Filename | modeM0/AS1A05_004T02_9000002490_16773cztM0_level2.evt | modeM0/AS1A05_004T02_9000002490_16773cztM0_level2_quad_clean.evt |
| Size (bytes) | 192,712,320 | 19,880,640 |
| Size | 183.8 MB | 19.0 MB |
| Events in quadrant A | 1,214,633 | 111,874 |
| Events in quadrant B | 1,374,249 | 111,776 |
| Events in quadrant C | 1,684,622 | 106,786 |
| Events in quadrant D | 1,407,718 | 108,119 |
| Mode M0 | |||
|---|---|---|---|
| Quadrant | BADHDUFLAG | Total packets | Discarded packets |
| A | 0 | 4975 | 2 |
| B | 0 | 5580 | 1 |
| C | 0 | 6761 | 1 |
| D | 0 | 5591 | 1 |
| Mode SS | |||
|---|---|---|---|
| Quadrant | BADHDUFLAG | Total packets | Discarded packets |
| A | 0 | 46 | 0 |
| B | 0 | 46 | 0 |
| C | 0 | 46 | 0 |
| D | 0 | 46 | 0 |
| Mode M9 | |||
|---|---|---|---|
| Quadrant | BADHDUFLAG | Total packets | Discarded packets |
| A | 0 | 12 | 0 |
| B | 0 | 12 | 0 |
| C | 0 | 12 | 0 |
| D | 0 | 12 | 0 |
| Quadrant | Total seconds | Saturated seconds | Saturation percentage |
|---|---|---|---|
| A | 2258 | 31 | 1.372896% |
| B | 2258 | 45 | 1.992914% |
| C | 2258 | 74 | 3.277236% |
| D | 2258 | 36 | 1.594331% |
Noise dominated data is calculated using 1-second bins in cleaned event files. If a bin has >2000 counts, and if more than 50% of those come from <1% of pixels, then it is considered to be noise-dominated and hence unusable.
| Quadrant | # 1 sec bins | Bins with >0 counts | Bins with >2000 counts | High rate bins dominated by noise | Noise dominated (total time) | Noise dominated (detector-on time) | Marked lightcurve |
|---|---|---|---|---|---|---|---|
| A | 3429 | 2260 | 0 | 0 | 0.00% | 0.00% | 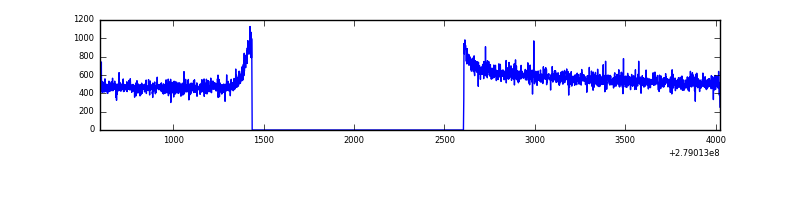 |
| B | 3429 | 2260 | 0 | 0 | 0.00% | 0.00% | 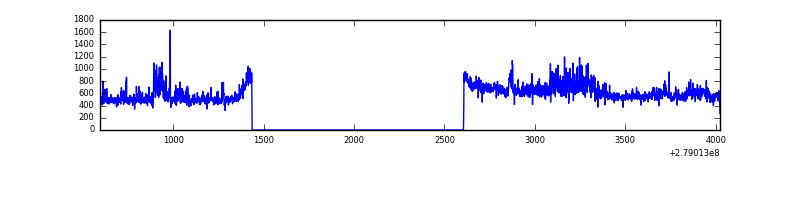 |
| C | 3429 | 2260 | 3 | 3 | 0.09% | 0.13% | 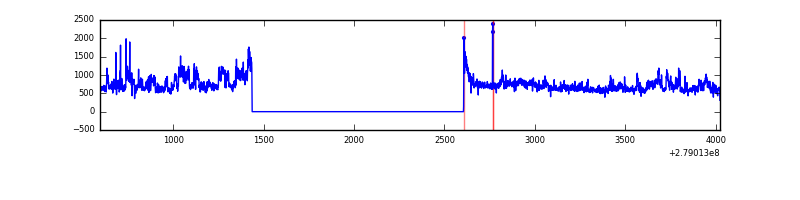 |
| D | 3429 | 2260 | 10 | 10 | 0.29% | 0.44% | 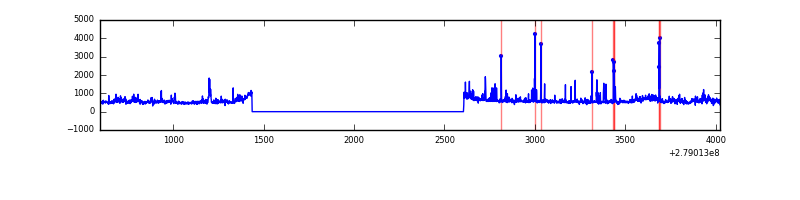 |
Top three noisy pixels from each quadrant. If the there are fewer than three noisy pixels in the level2.evt file, extra rows are filled as -1
| Pixel properties | Quadrant properties | ||||||
|---|---|---|---|---|---|---|---|
| Quadrant | DetID | PixID | Counts | Sigma | Mean | Median | Sigma |
| A | 0 | 226 | 2810 | 38.42 | 315 | 310 | 65.1 |
| A | 12 | 194 | 2322 | 30.92 | 315 | 310 | 65.1 |
| A | 3 | 137 | 2083 | 27.24 | 315 | 310 | 65.1 |
| B | 5 | 236 | 62541 | 1026.07 | 314 | 308 | 60.7 |
| B | 3 | 64 | 28706 | 468.21 | 314 | 308 | 60.7 |
| B | 15 | 35 | 25138 | 409.39 | 314 | 308 | 60.7 |
| C | 3 | 233 | 461852 | 6570.9 | 293 | 295 | 70.2 |
| C | 14 | 238 | 45621 | 645.28 | 293 | 295 | 70.2 |
| C | 0 | 207 | 32470 | 458.06 | 293 | 295 | 70.2 |
| D | 1 | 52 | 176886 | 2404.55 | 300 | 292 | 73.4 |
| D | 11 | 176 | 42632 | 576.51 | 300 | 292 | 73.4 |
| D | 13 | 248 | 17467 | 233.86 | 300 | 292 | 73.4 |
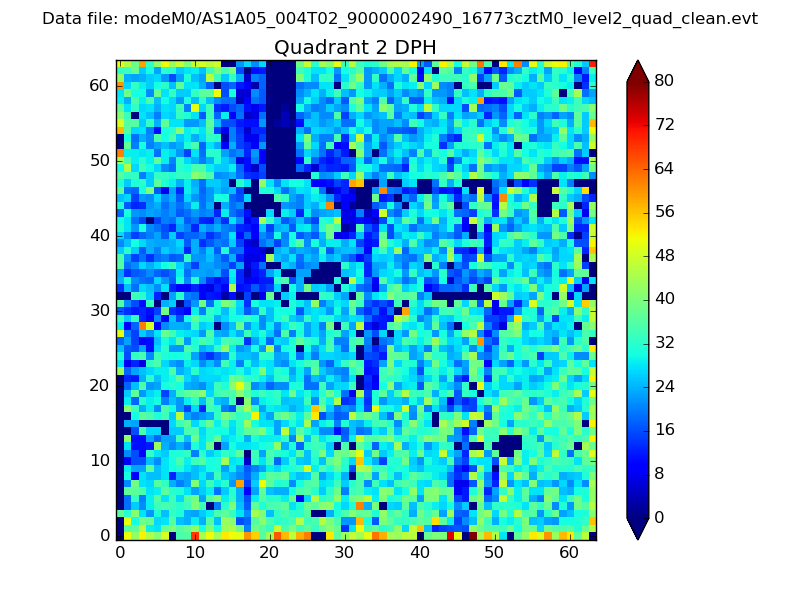
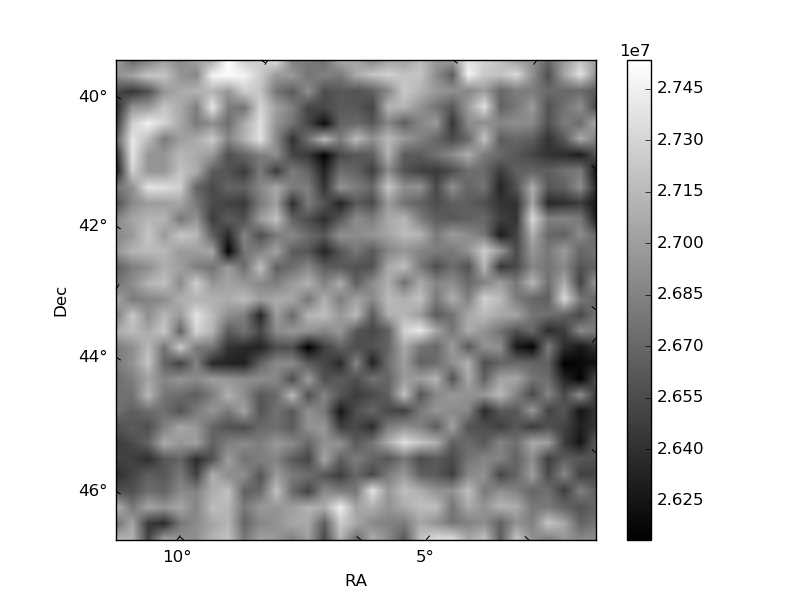
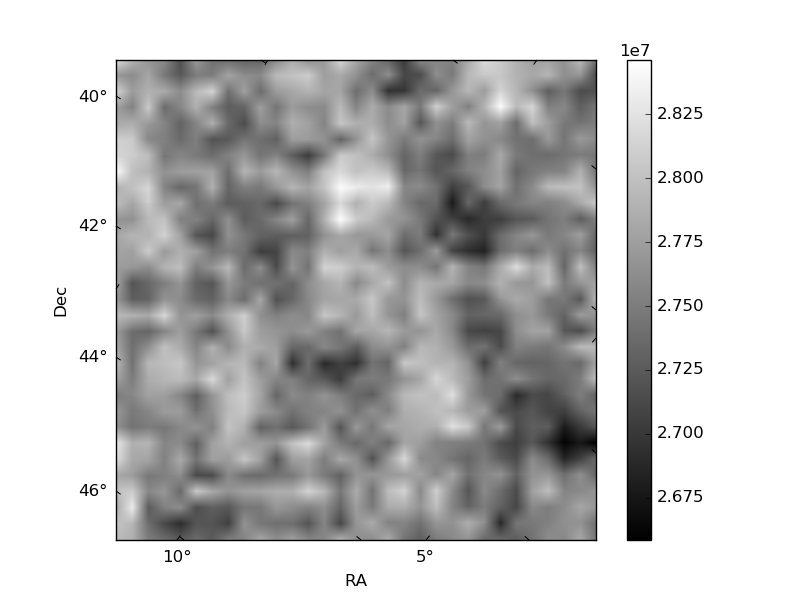
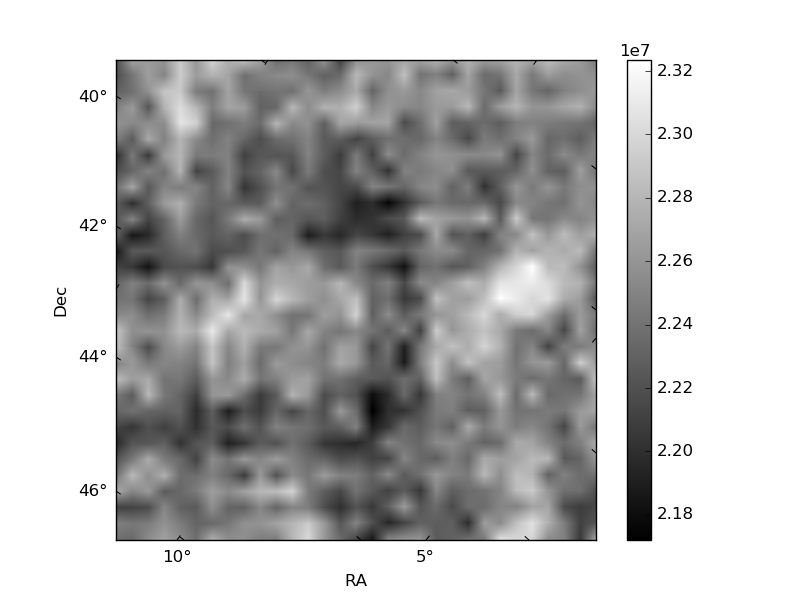
Histogram calculated using DETX and DETY for each event in the final _common_clean file
| Quadrant A |  |
 |
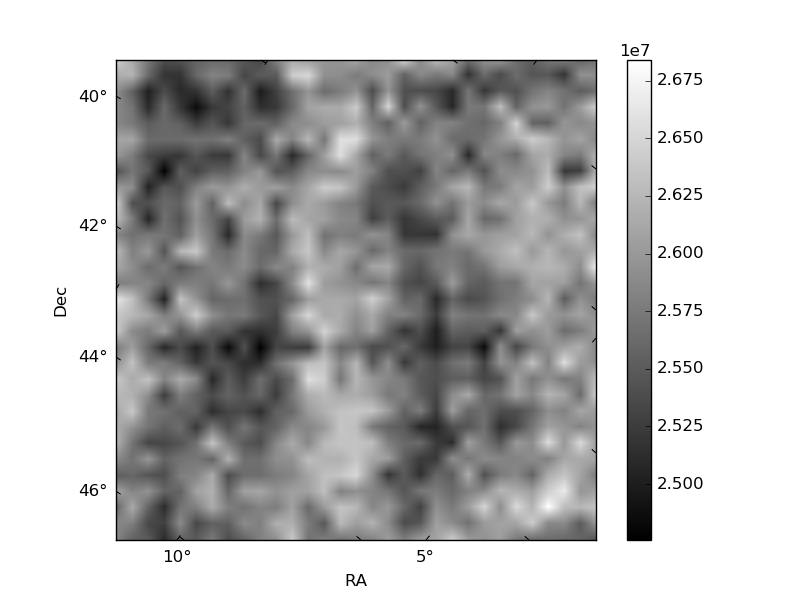
Quadrant B |
|---|---|---|---|
| Quadrant D | 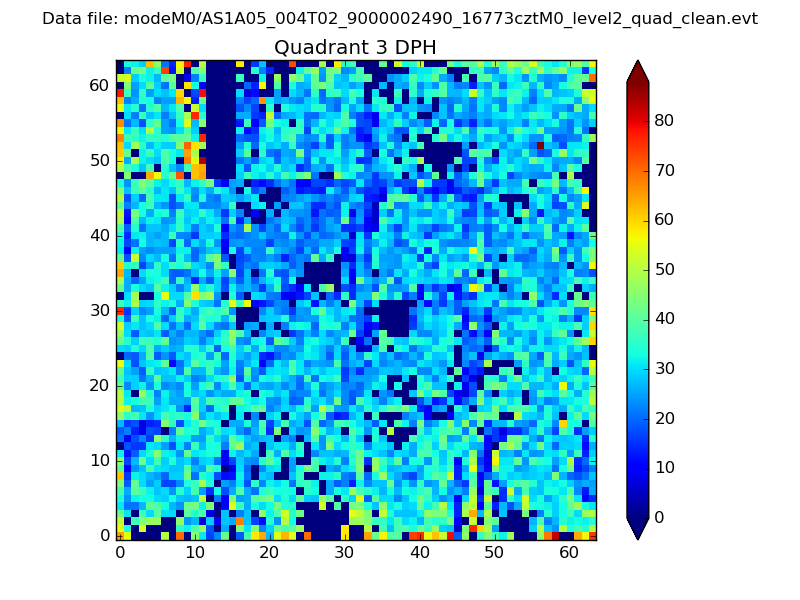 |
 |
Quadrant C |
| Plot type | Count rate plots | Images |
|---|---|---|
| Comparison with Poisson distribution Blue bars denote a histogram of data divided into 1 sec bins. Red curve is a Poisson curve with rate = median count rate of data. |
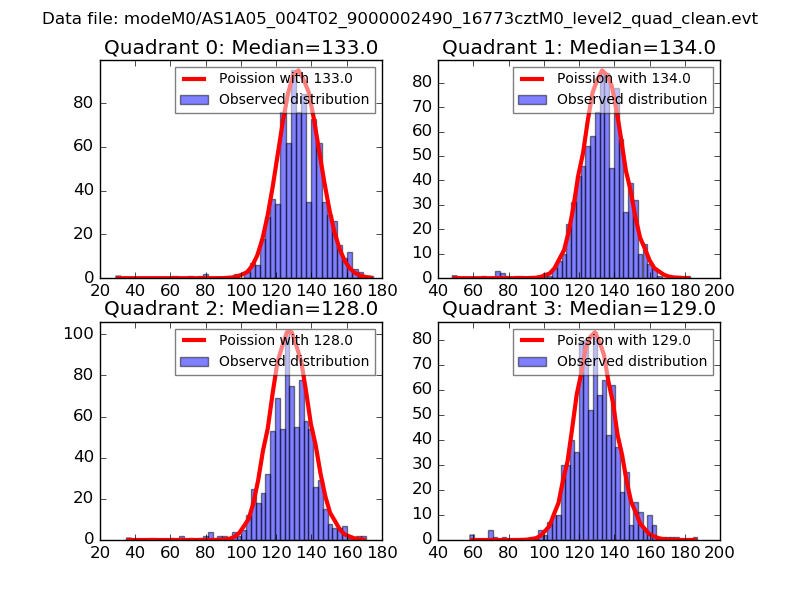 |
 |
| Quadrant-wise count rates Data is divided into 100 sec bins |
 |
|
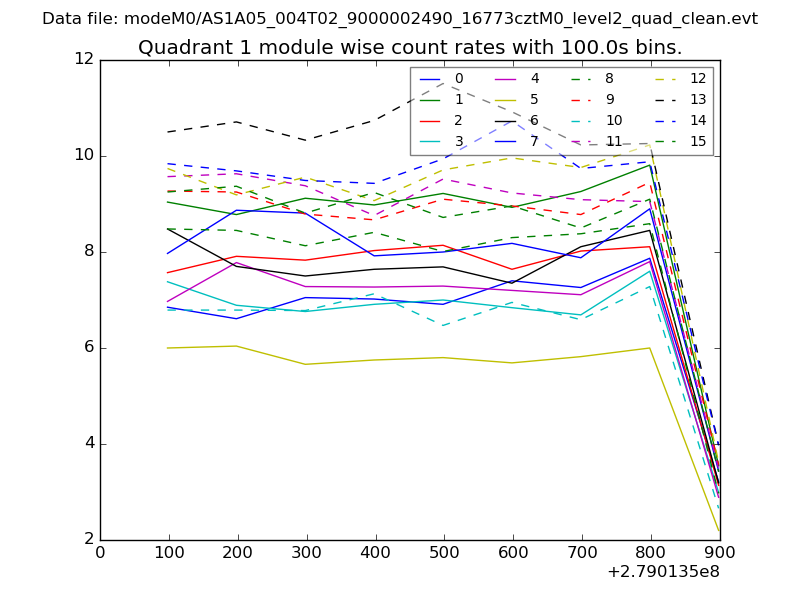
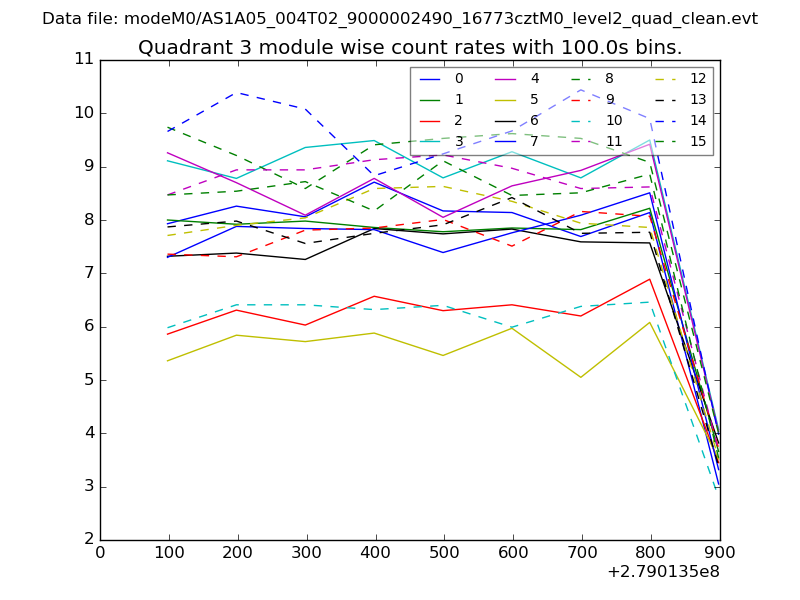
| Module-wise count rates for Quadrant A Data is divided into 100 sec bins |
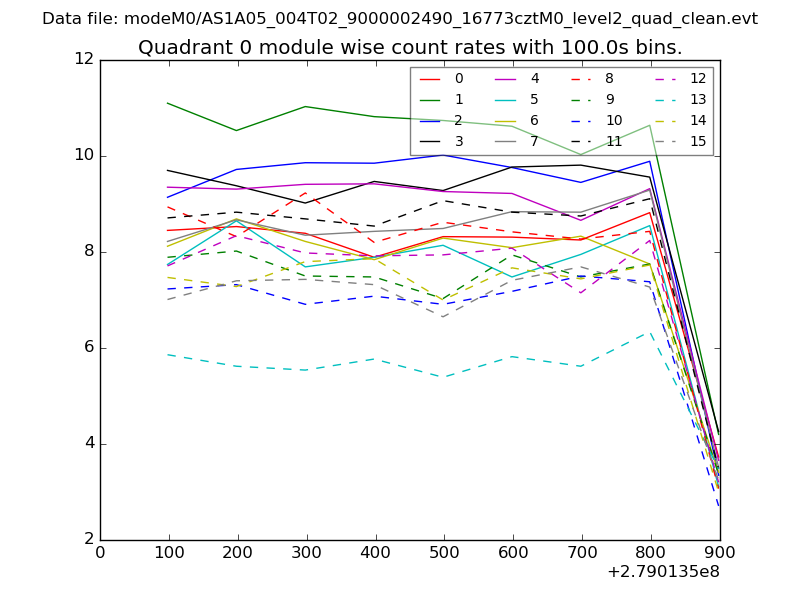 |
 |
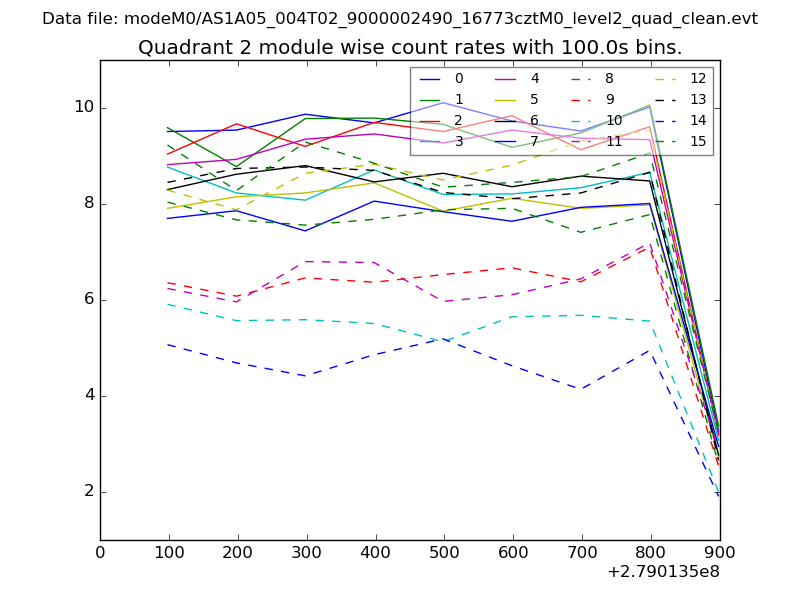
| Module-wise count rates for Quadrant B Data is divided into 100 sec bins |
 |
 |
| Module-wise count rates for Quadrant C Data is divided into 100 sec bins |
 |
 |
| Module-wise count rates for Quadrant D Data is divided into 100 sec bins |
 |
 |
| Parameter | Plot |
|---|---|
| CZT HV Monitor | 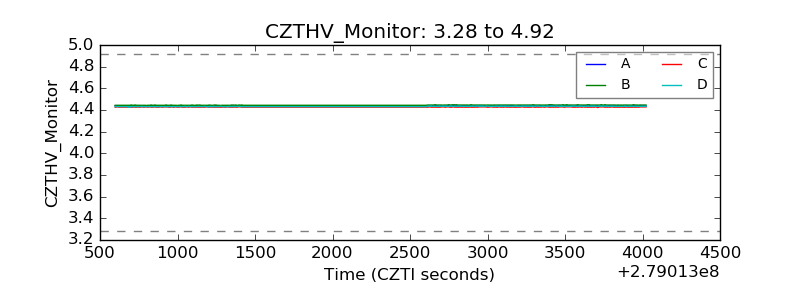 |
| D_VDD | 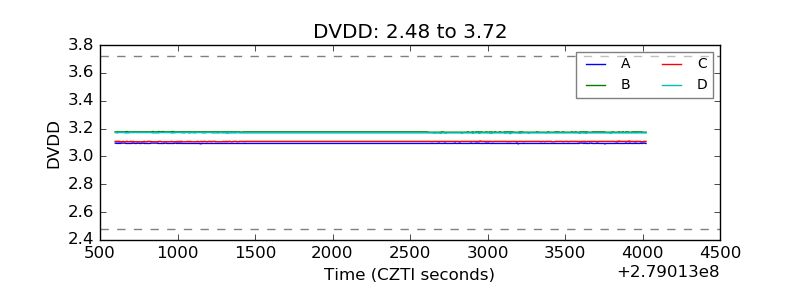 |
| Temperature 1 | 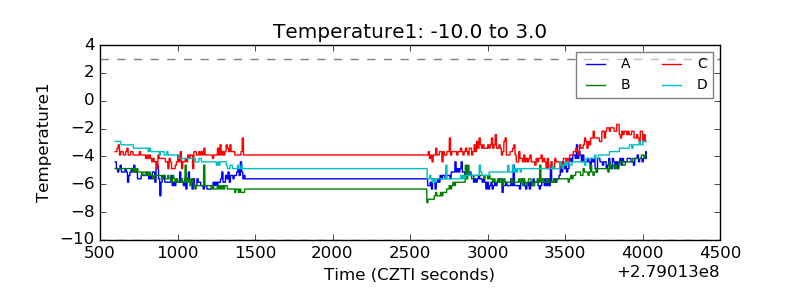 |
| Veto HV Monitor |  |
| Veto LLD | 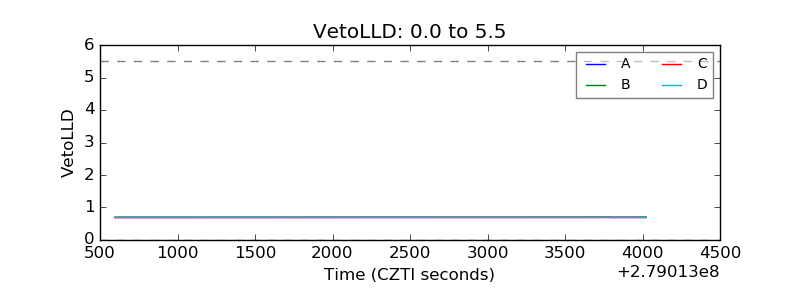 |
| Alpha Counter | 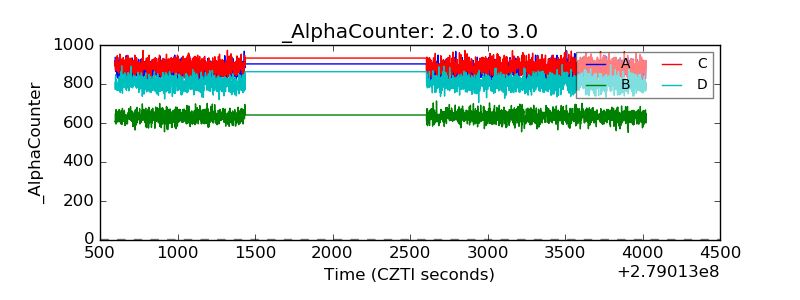 |
| _CPM_Rate | 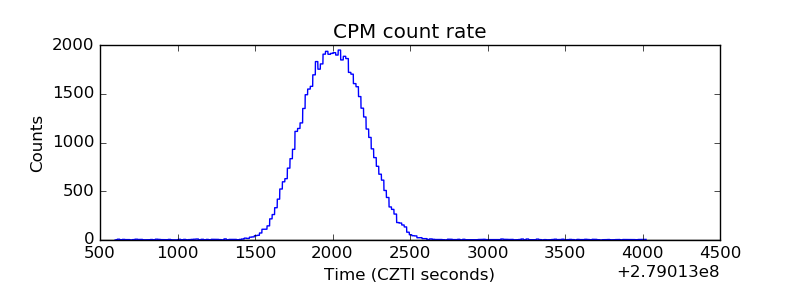 |
| CZT Counter | 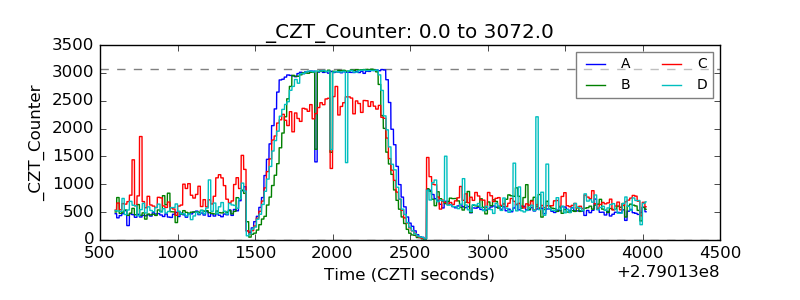 |
| +2.5 Volts monitor |  |
| +5 Volts monitor |  |
| _ROLL_ROT | 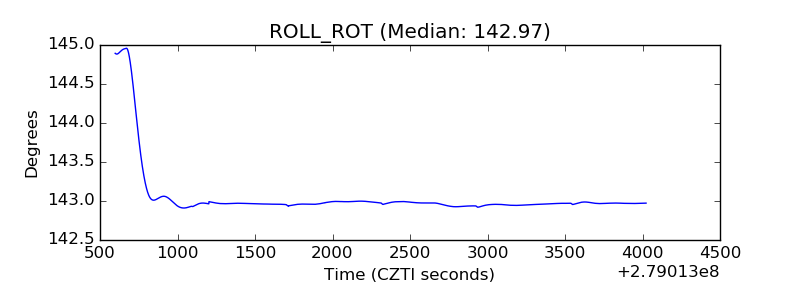 |
| _Roll_DEC | 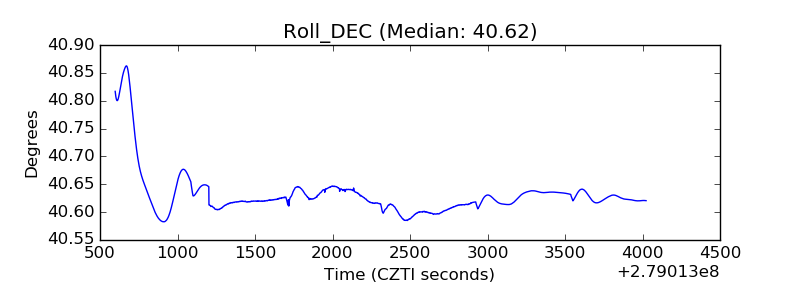 |
| _Roll_RA |  |
| Veto Counter | 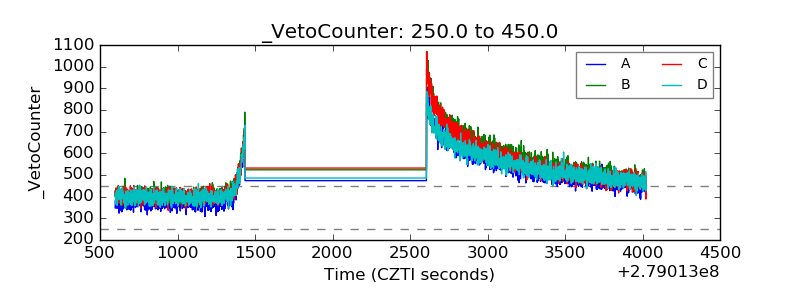 |