| Param | Original file | Final file |
|---|---|---|
| Filename | modeM0/AS1A05_004T02_9000002490_16775cztM0_level2.evt | modeM0/AS1A05_004T02_9000002490_16775cztM0_level2_quad_clean.evt |
| Size (bytes) | 617,932,800 | 100,252,800 |
| Size | 589.3 MB | 95.6 MB |
| Events in quadrant A | 3,706,607 | 679,275 |
| Events in quadrant B | 3,819,577 | 681,073 |
| Events in quadrant C | 5,353,514 | 633,858 |
| Events in quadrant D | 5,386,868 | 580,580 |
| Mode M0 | |||
|---|---|---|---|
| Quadrant | BADHDUFLAG | Total packets | Discarded packets |
| A | 0 | 15174 | 3 |
| B | 0 | 15570 | 2 |
| C | 0 | 20689 | 2 |
| D | 0 | 20158 | 2 |
| Mode SS | |||
|---|---|---|---|
| Quadrant | BADHDUFLAG | Total packets | Discarded packets |
| A | 0 | 138 | 0 |
| B | 0 | 138 | 0 |
| C | 0 | 138 | 0 |
| D | 0 | 138 | 0 |
| Mode M9 | |||
|---|---|---|---|
| Quadrant | BADHDUFLAG | Total packets | Discarded packets |
| A | 0 | 25 | 0 |
| B | 0 | 25 | 0 |
| C | 0 | 25 | 0 |
| D | 0 | 25 | 0 |
| Quadrant | Total seconds | Saturated seconds | Saturation percentage |
|---|---|---|---|
| A | 6607 | 142 | 2.149236% |
| B | 6607 | 163 | 2.467080% |
| C | 6607 | 277 | 4.192523% |
| D | 6607 | 971 | 14.696534% |
Noise dominated data is calculated using 1-second bins in cleaned event files. If a bin has >2000 counts, and if more than 50% of those come from <1% of pixels, then it is considered to be noise-dominated and hence unusable.
| Quadrant | # 1 sec bins | Bins with >0 counts | Bins with >2000 counts | High rate bins dominated by noise | Noise dominated (total time) | Noise dominated (detector-on time) | Marked lightcurve |
|---|---|---|---|---|---|---|---|
| A | 9168 | 6609 | 0 | 0 | 0.00% | 0.00% | 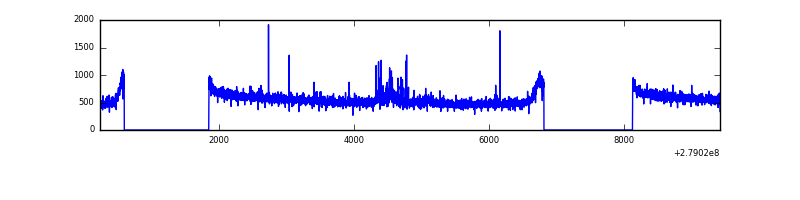 |
| B | 9168 | 6610 | 2 | 2 | 0.02% | 0.03% | 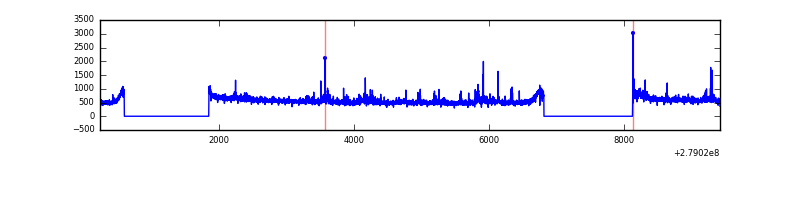 |
| C | 9168 | 6610 | 8 | 8 | 0.09% | 0.12% | 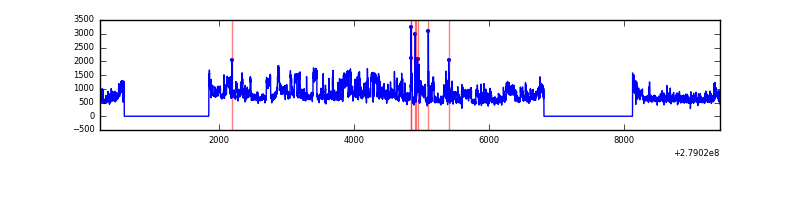 |
| D | 9167 | 6609 | 606 | 606 | 6.61% | 9.17% | 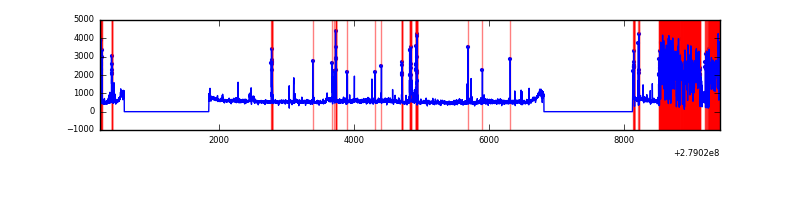 |
Top three noisy pixels from each quadrant. If the there are fewer than three noisy pixels in the level2.evt file, extra rows are filled as -1
| Pixel properties | Quadrant properties | ||||||
|---|---|---|---|---|---|---|---|
| Quadrant | DetID | PixID | Counts | Sigma | Mean | Median | Sigma |
| A | 15 | 174 | 81212 | 432.27 | 938 | 924 | 185.7 |
| A | 0 | 13 | 13367 | 66.99 | 938 | 924 | 185.7 |
| A | 9 | 143 | 9274 | 44.96 | 938 | 924 | 185.7 |
| B | 0 | 229 | 54389 | 310.24 | 922 | 902 | 172.4 |
| B | 15 | 35 | 50967 | 290.39 | 922 | 902 | 172.4 |
| B | 5 | 236 | 48549 | 276.37 | 922 | 902 | 172.4 |
| C | 3 | 233 | 1648295 | 8251.0 | 867 | 875 | 199.7 |
| C | 0 | 207 | 182971 | 912.01 | 867 | 875 | 199.7 |
| C | 14 | 238 | 135244 | 672.98 | 867 | 875 | 199.7 |
| D | 1 | 52 | 1924340 | 9751.94 | 816 | 793 | 197.2 |
| D | 12 | 110 | 158988 | 802.01 | 816 | 793 | 197.2 |
| D | 2 | 33 | 74986 | 376.14 | 816 | 793 | 197.2 |
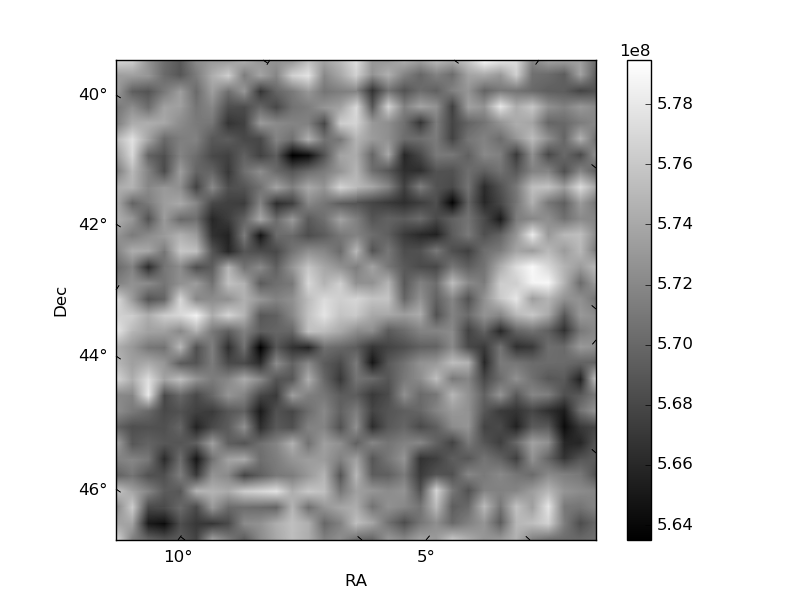
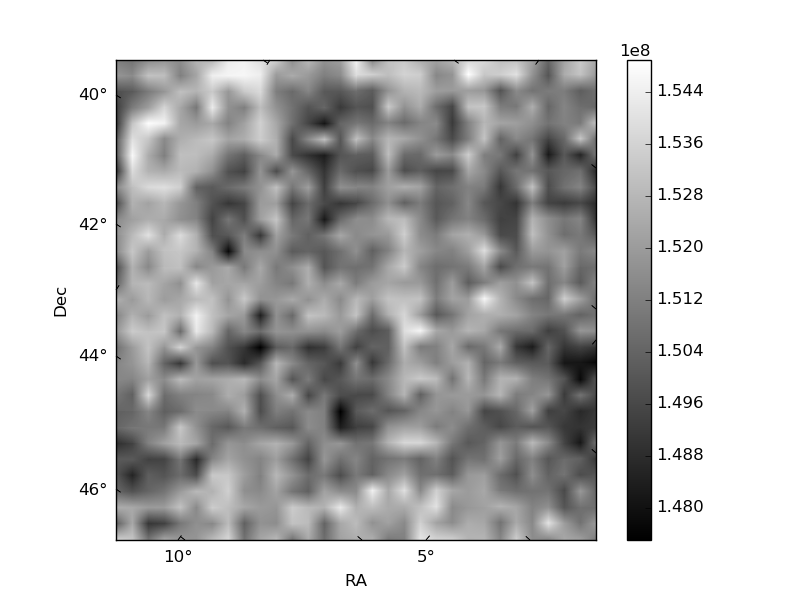
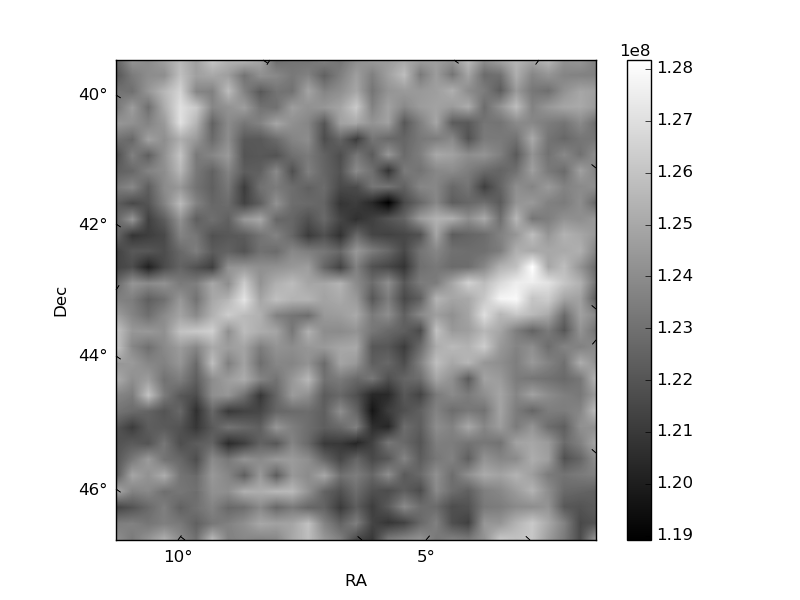
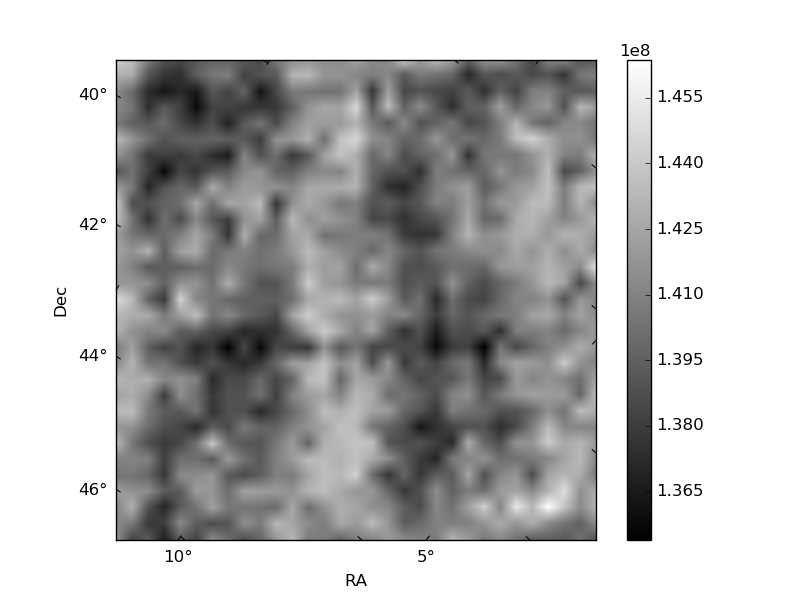
Histogram calculated using DETX and DETY for each event in the final _common_clean file
| Quadrant A | 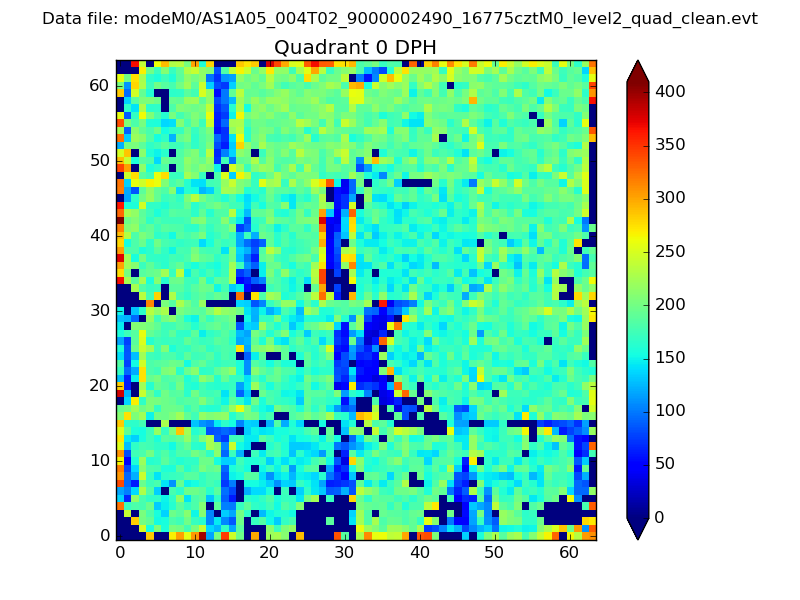 |
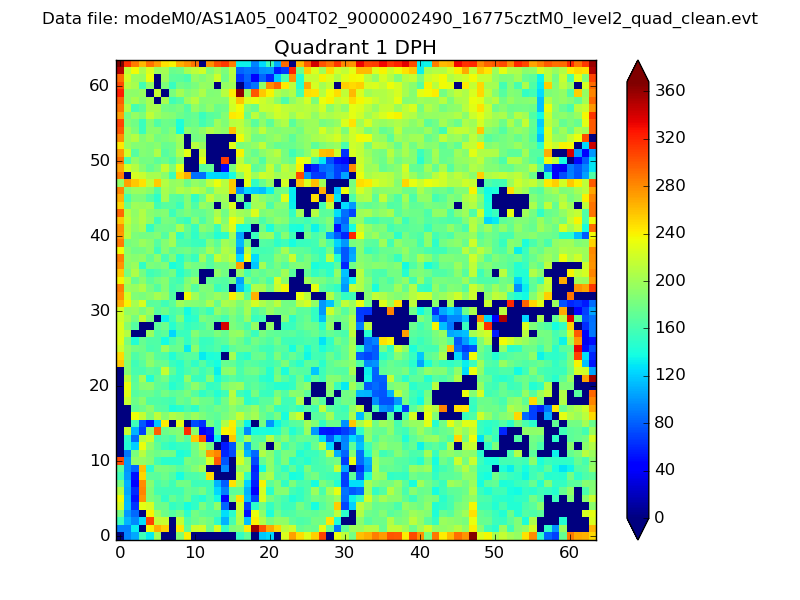 |
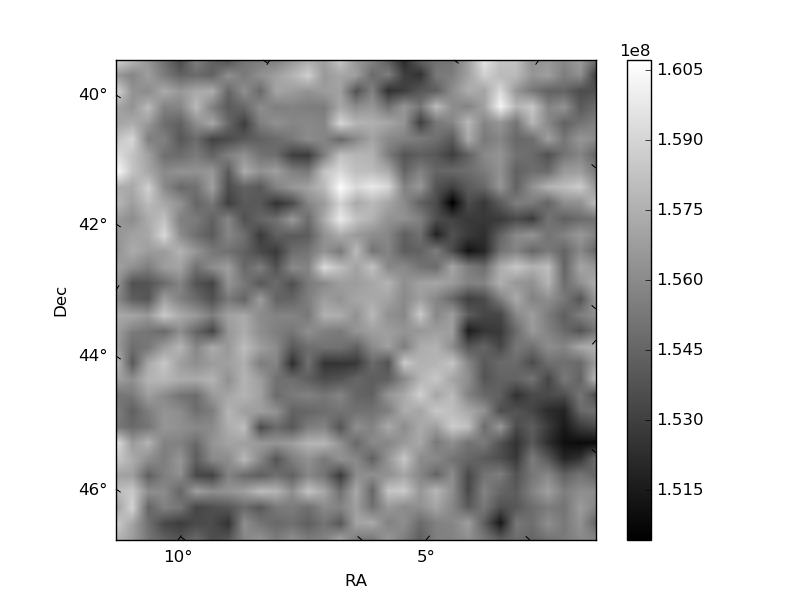
Quadrant B |
|---|---|---|---|
| Quadrant D | 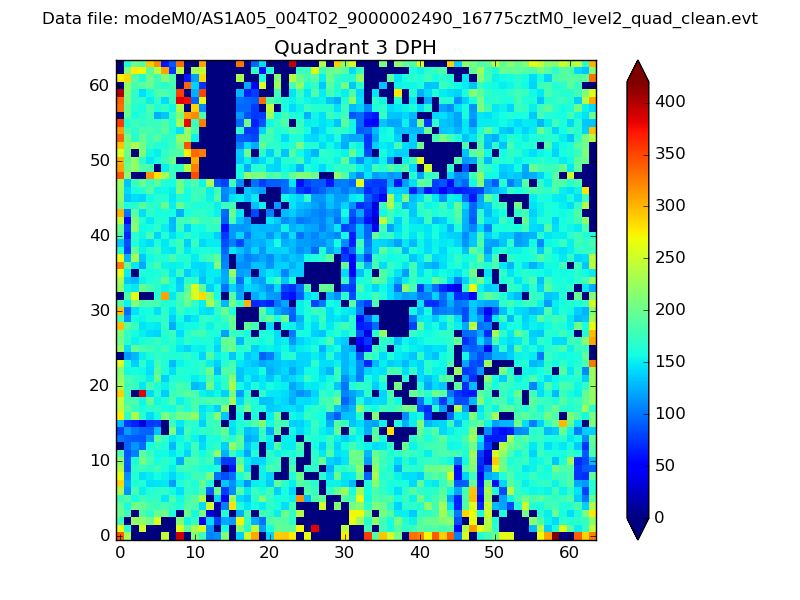 |
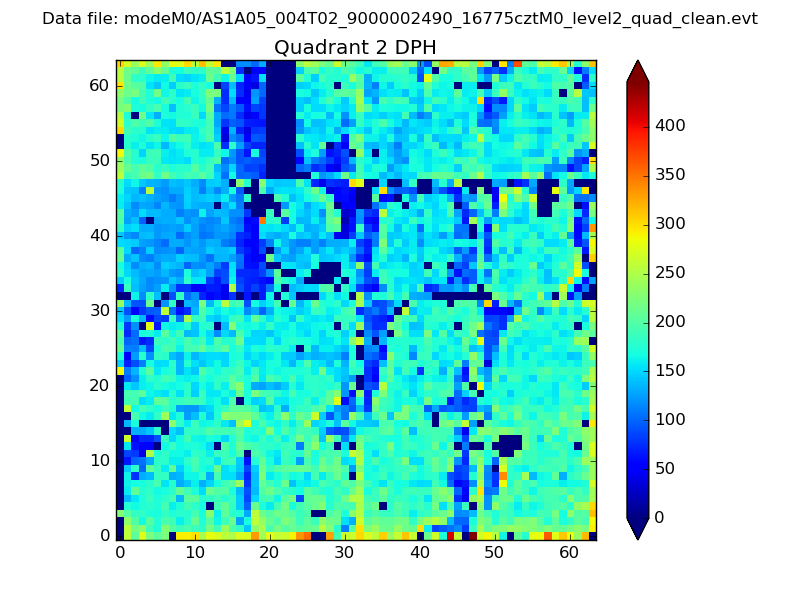 |
Quadrant C |
| Plot type | Count rate plots | Images |
|---|---|---|
| Comparison with Poisson distribution Blue bars denote a histogram of data divided into 1 sec bins. Red curve is a Poisson curve with rate = median count rate of data. |
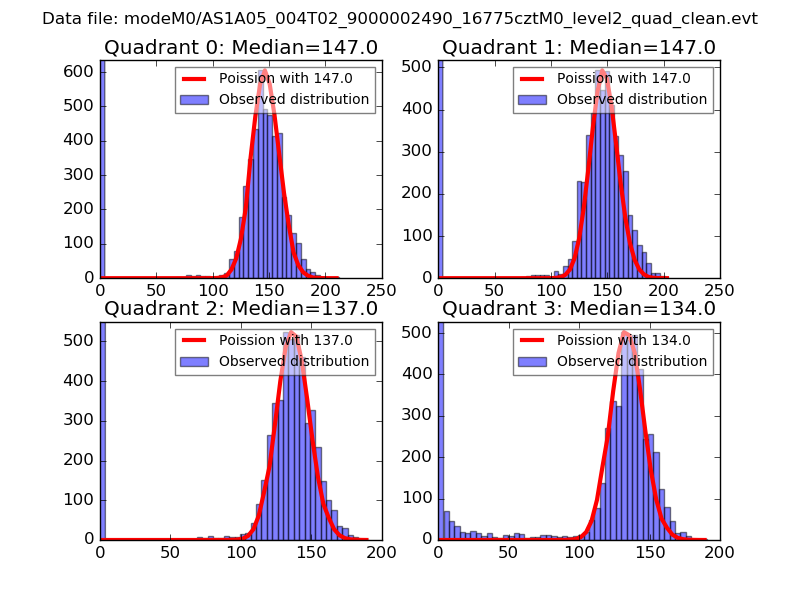 |
 |
| Quadrant-wise count rates Data is divided into 100 sec bins |
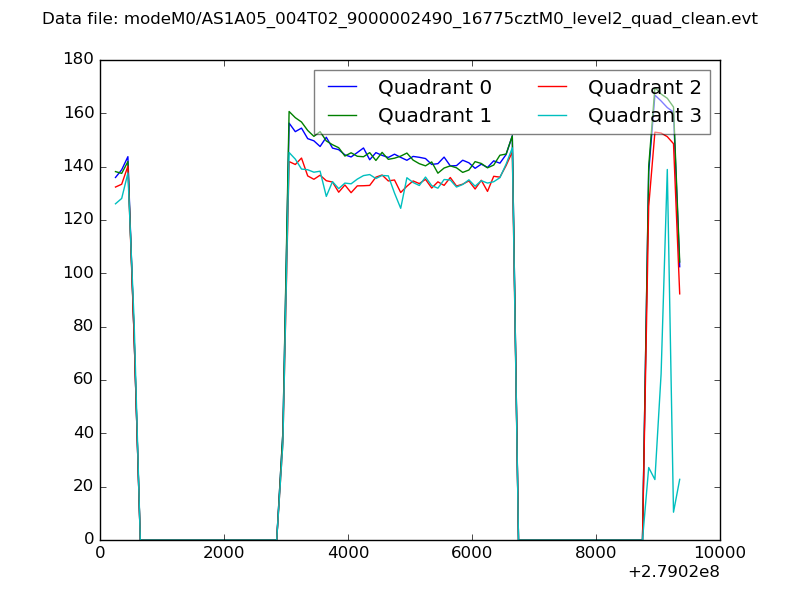 |
|
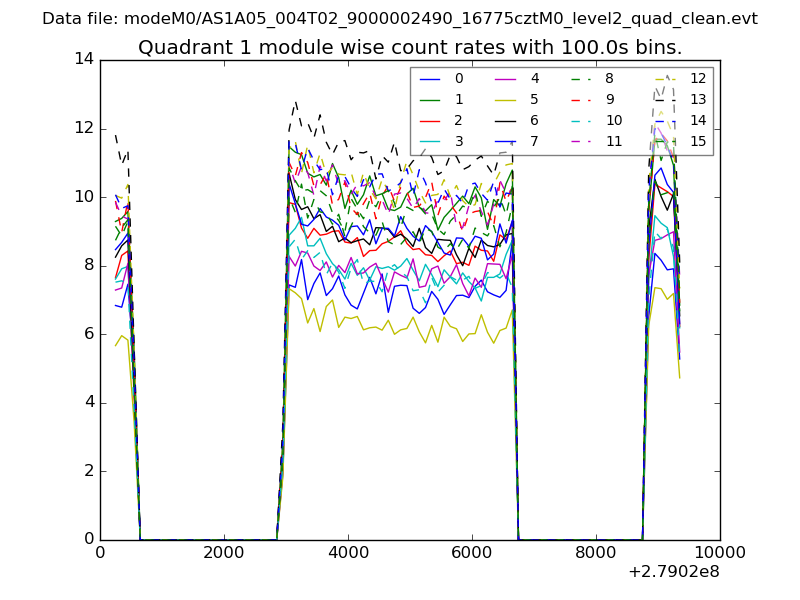
| Module-wise count rates for Quadrant A Data is divided into 100 sec bins |
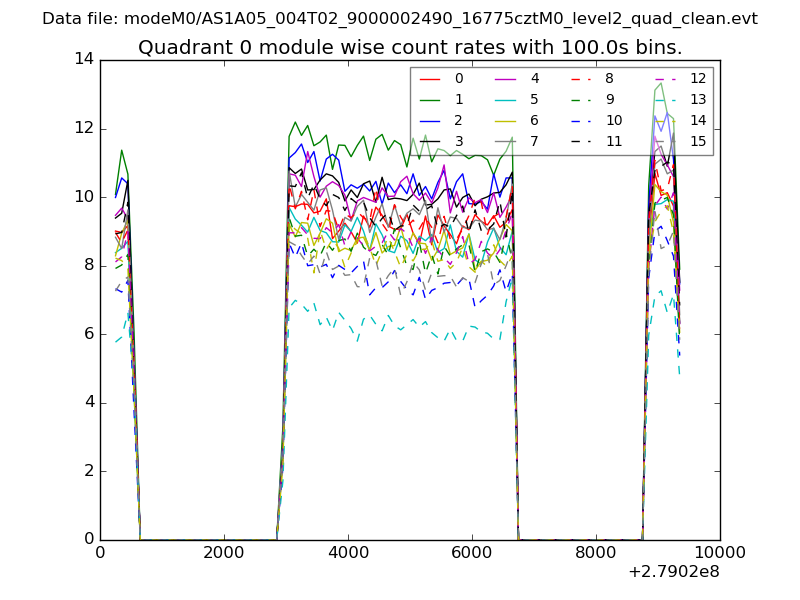 |
 |
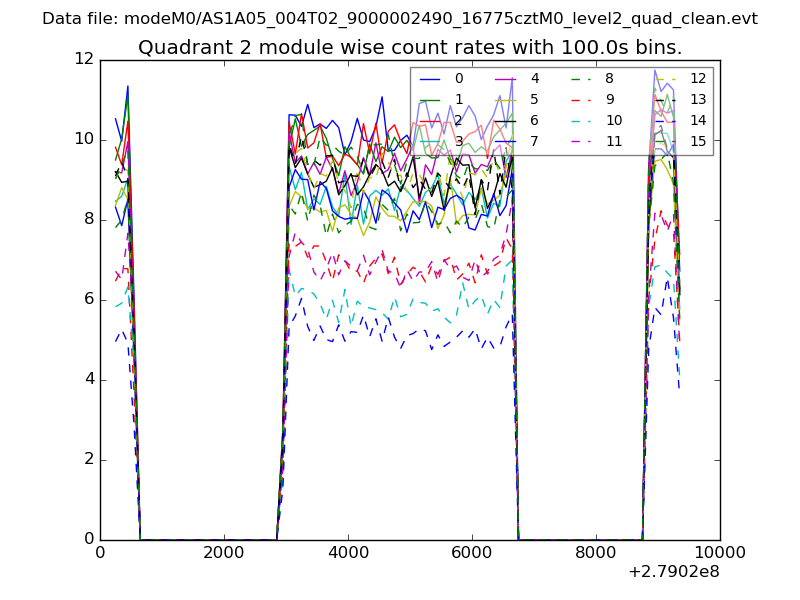
| Module-wise count rates for Quadrant B Data is divided into 100 sec bins |
 |
 |
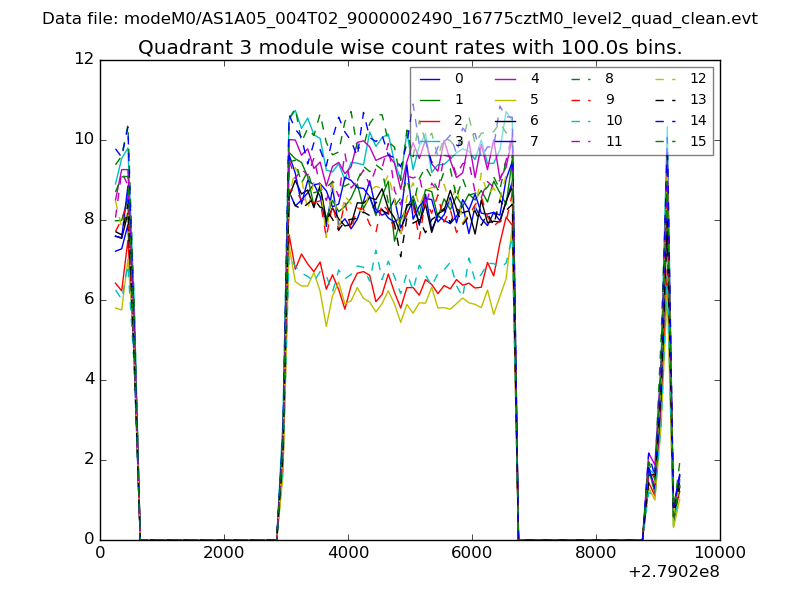
| Module-wise count rates for Quadrant C Data is divided into 100 sec bins |
 |
 |
| Module-wise count rates for Quadrant D Data is divided into 100 sec bins |
 |
 |
| Parameter | Plot |
|---|---|
| CZT HV Monitor | 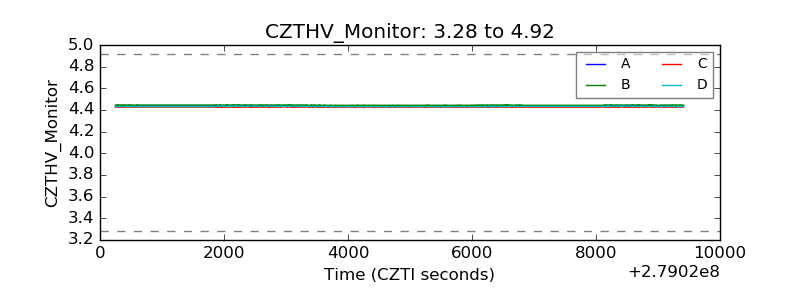 |
| D_VDD | 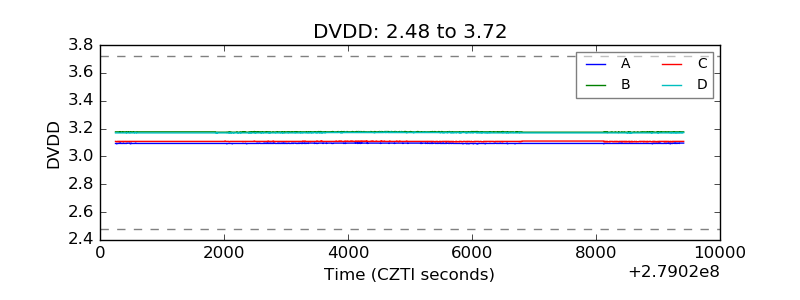 |
| Temperature 1 | 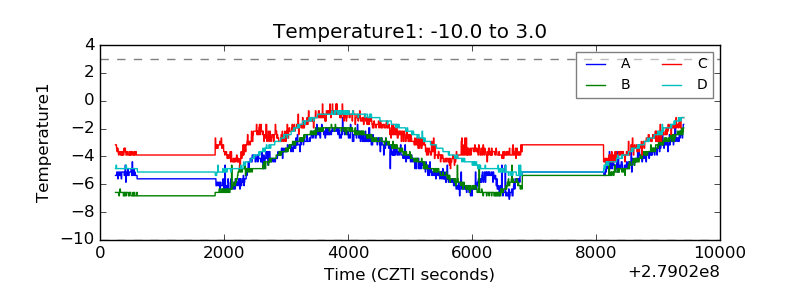 |
| Veto HV Monitor | 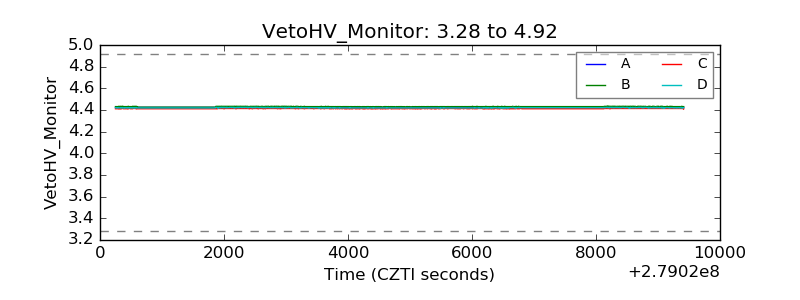 |
| Veto LLD | 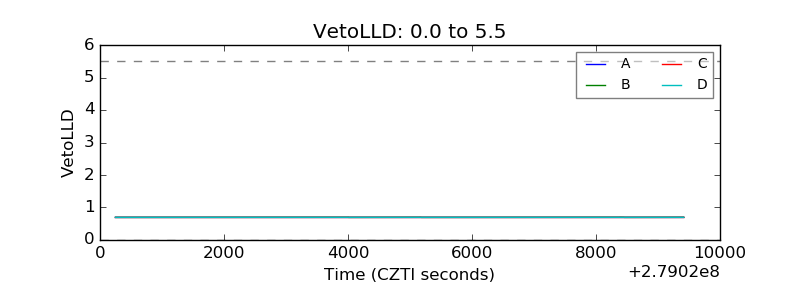 |
| Alpha Counter | 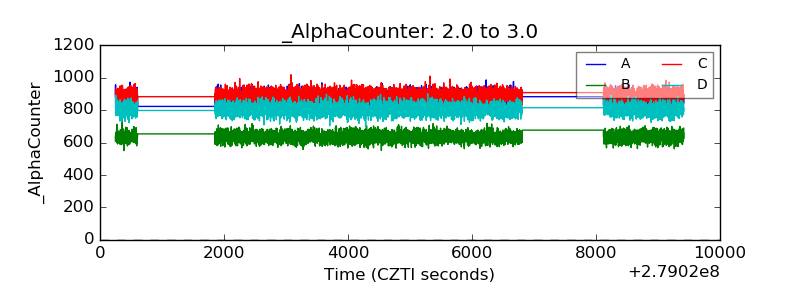 |
| _CPM_Rate |  |
| CZT Counter | 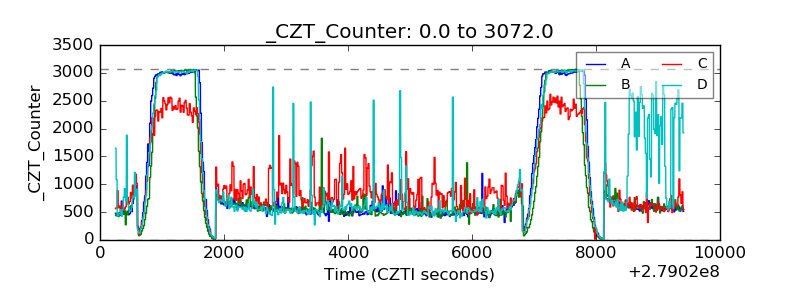 |
| +2.5 Volts monitor | 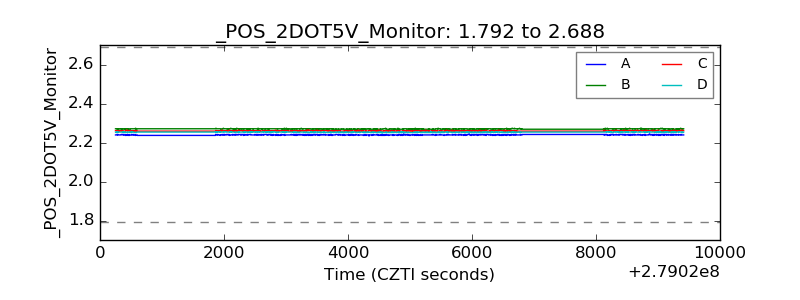 |
| +5 Volts monitor | 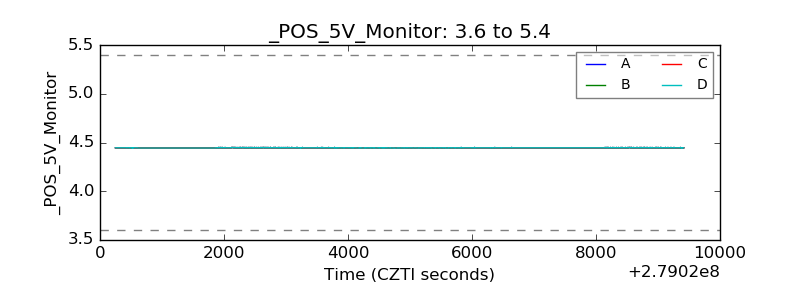 |
| _ROLL_ROT | 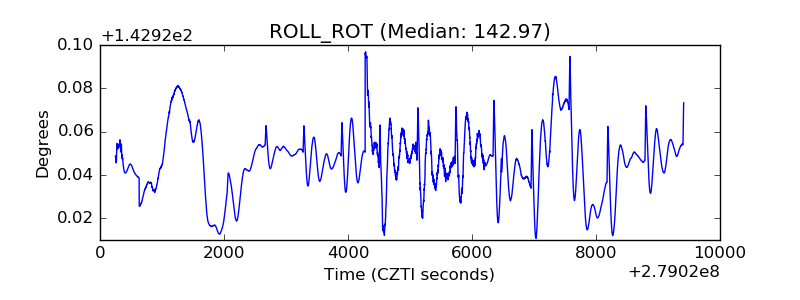 |
| _Roll_DEC | 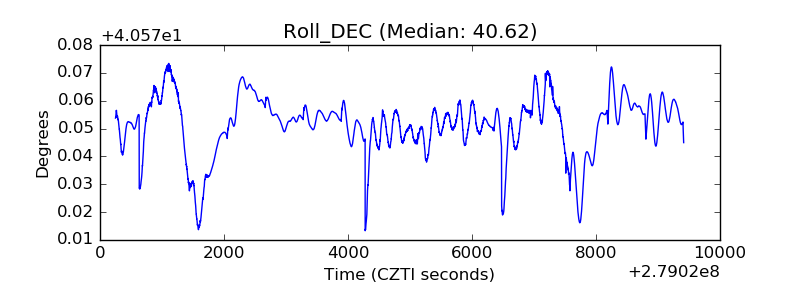 |
| _Roll_RA | 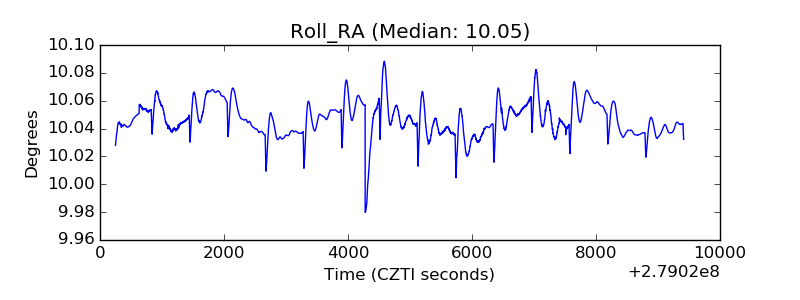 |
| Veto Counter | 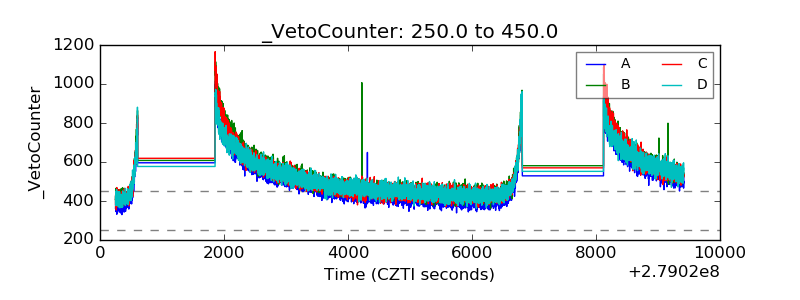 |