| Param | Original file | Final file |
|---|---|---|
| Filename | modeM0/AS1A05_004T02_9000002490_16776cztM0_level2.evt | modeM0/AS1A05_004T02_9000002490_16776cztM0_level2_quad_clean.evt |
| Size (bytes) | 826,646,400 | 93,726,720 |
| Size | 788.4 MB | 89.4 MB |
| Events in quadrant A | 3,577,358 | 745,310 |
| Events in quadrant B | 3,694,907 | 742,540 |
| Events in quadrant C | 4,009,367 | 699,616 |
| Events in quadrant D | 13,313,883 | 196,117 |
| Mode M0 | |||
|---|---|---|---|
| Quadrant | BADHDUFLAG | Total packets | Discarded packets |
| A | 0 | 14714 | 3 |
| B | 0 | 15039 | 2 |
| C | 0 | 16317 | 2 |
| D | 0 | 44042 | 2 |
| Mode SS | |||
|---|---|---|---|
| Quadrant | BADHDUFLAG | Total packets | Discarded packets |
| A | 0 | 132 | 0 |
| B | 0 | 132 | 0 |
| C | 0 | 132 | 0 |
| D | 0 | 132 | 0 |
| Mode M9 | |||
|---|---|---|---|
| Quadrant | BADHDUFLAG | Total packets | Discarded packets |
| A | 0 | 23 | 0 |
| B | 0 | 23 | 0 |
| C | 0 | 23 | 0 |
| D | 0 | 24 | 0 |
| Quadrant | Total seconds | Saturated seconds | Saturation percentage |
|---|---|---|---|
| A | 6489 | 95 | 1.464016% |
| B | 6489 | 136 | 2.095855% |
| C | 6489 | 147 | 2.265372% |
| D | 6489 | 5550 | 85.529357% |
Noise dominated data is calculated using 1-second bins in cleaned event files. If a bin has >2000 counts, and if more than 50% of those come from <1% of pixels, then it is considered to be noise-dominated and hence unusable.
| Quadrant | # 1 sec bins | Bins with >0 counts | Bins with >2000 counts | High rate bins dominated by noise | Noise dominated (total time) | Noise dominated (detector-on time) | Marked lightcurve |
|---|---|---|---|---|---|---|---|
| A | 7820 | 6491 | 1 | 1 | 0.01% | 0.02% | 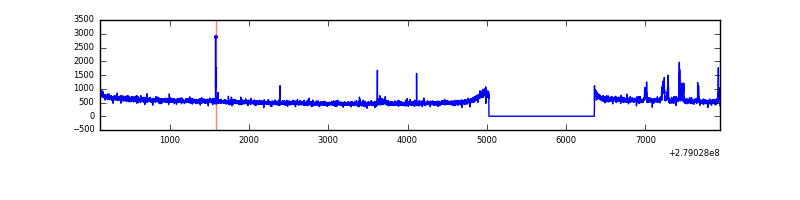 |
| B | 7820 | 6491 | 15 | 15 | 0.19% | 0.23% | 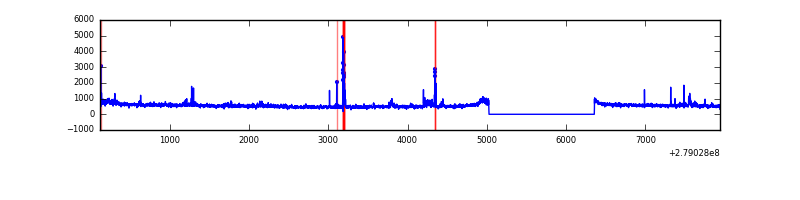 |
| C | 7820 | 6491 | 1 | 1 | 0.01% | 0.02% | 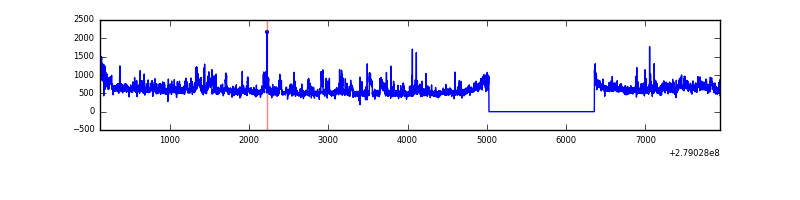 |
| D | 7819 | 6490 | 3931 | 3931 | 50.27% | 60.57% | 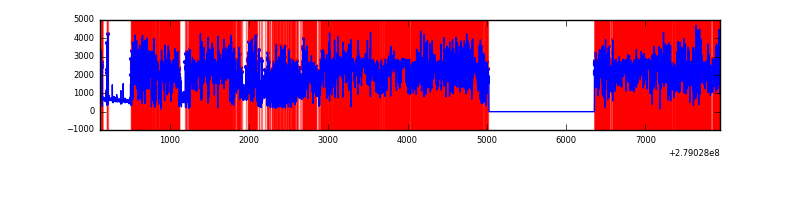 |
Top three noisy pixels from each quadrant. If the there are fewer than three noisy pixels in the level2.evt file, extra rows are filled as -1
| Pixel properties | Quadrant properties | ||||||
|---|---|---|---|---|---|---|---|
| Quadrant | DetID | PixID | Counts | Sigma | Mean | Median | Sigma |
| A | 15 | 174 | 98142 | 542.68 | 903 | 886 | 179.2 |
| A | 0 | 13 | 8208 | 40.86 | 903 | 886 | 179.2 |
| A | 0 | 226 | 7963 | 39.49 | 903 | 886 | 179.2 |
| B | 15 | 35 | 90830 | 546.91 | 885 | 866 | 164.5 |
| B | 5 | 236 | 75686 | 454.85 | 885 | 866 | 164.5 |
| B | 0 | 229 | 36491 | 216.57 | 885 | 866 | 164.5 |
| C | 3 | 233 | 472679 | 2434.72 | 843 | 850 | 193.8 |
| C | 14 | 238 | 133370 | 683.83 | 843 | 850 | 193.8 |
| C | 0 | 207 | 113348 | 580.51 | 843 | 850 | 193.8 |
| D | 1 | 52 | 11710308 | 143068.77 | 340 | 331 | 81.8 |
| D | 12 | 110 | 238987 | 2915.82 | 340 | 331 | 81.8 |
| D | 10 | 70 | 33963 | 410.91 | 340 | 331 | 81.8 |
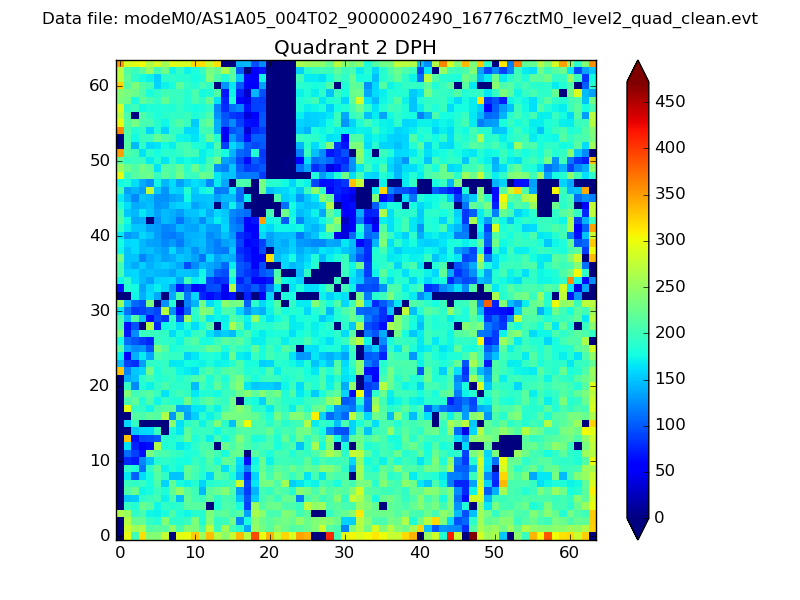
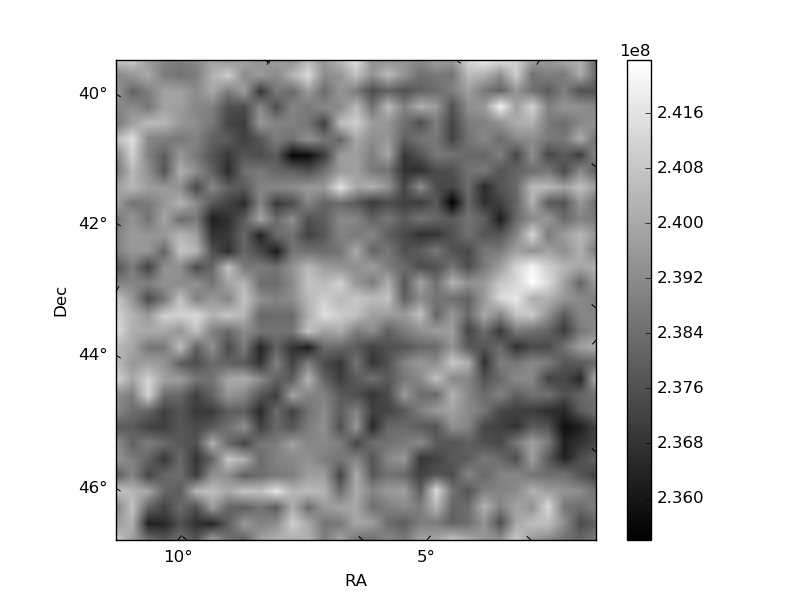
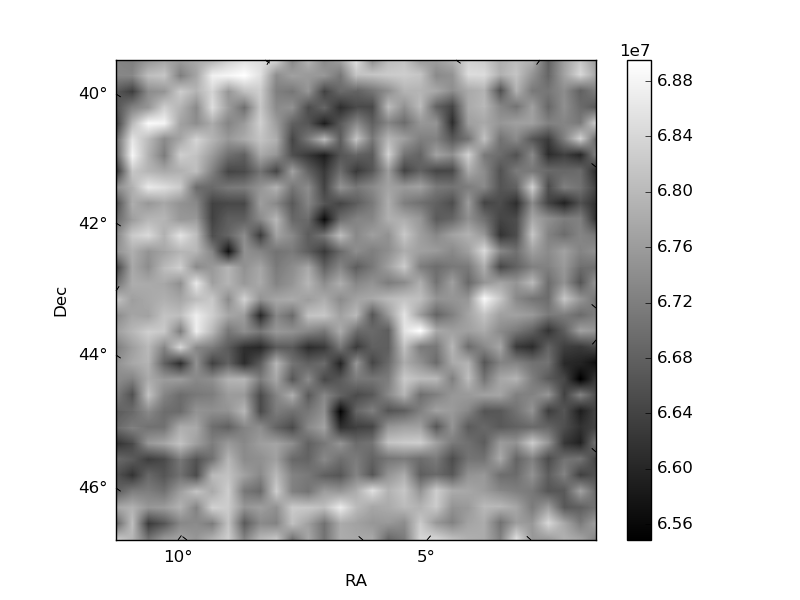
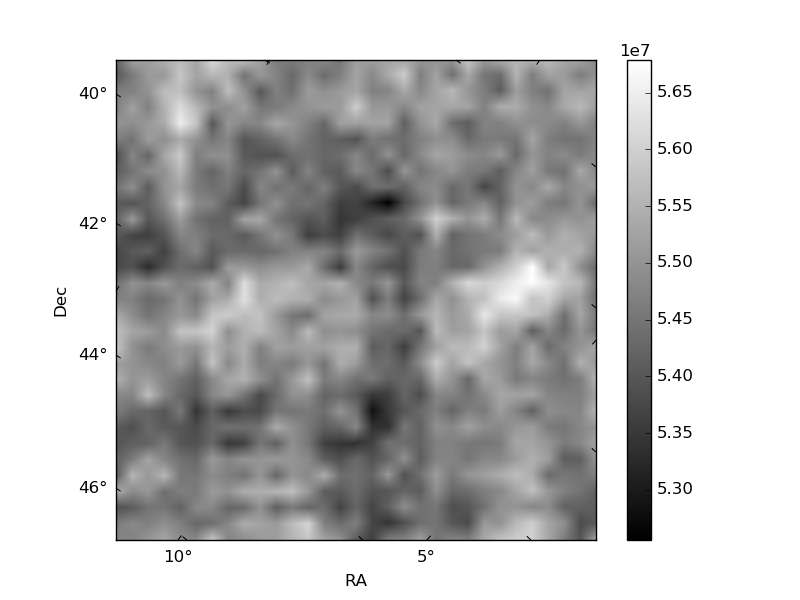
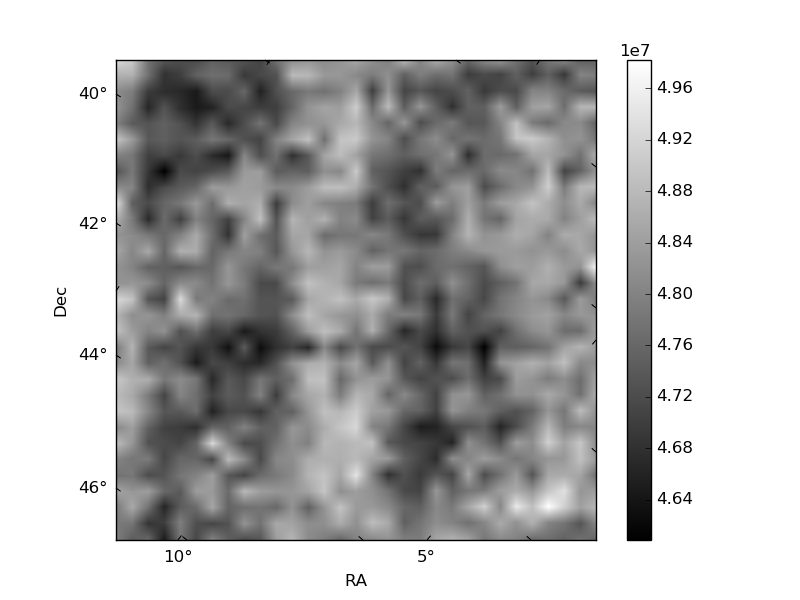
Histogram calculated using DETX and DETY for each event in the final _common_clean file
| Quadrant A | 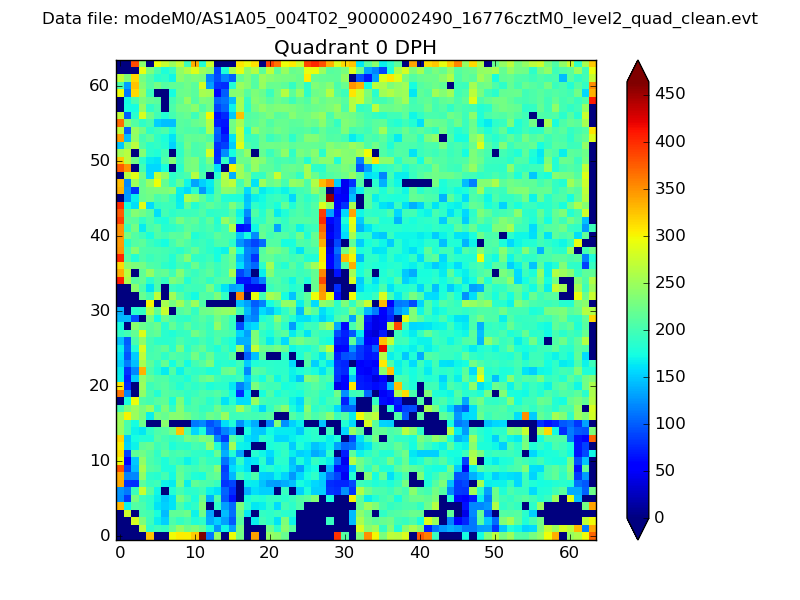 |
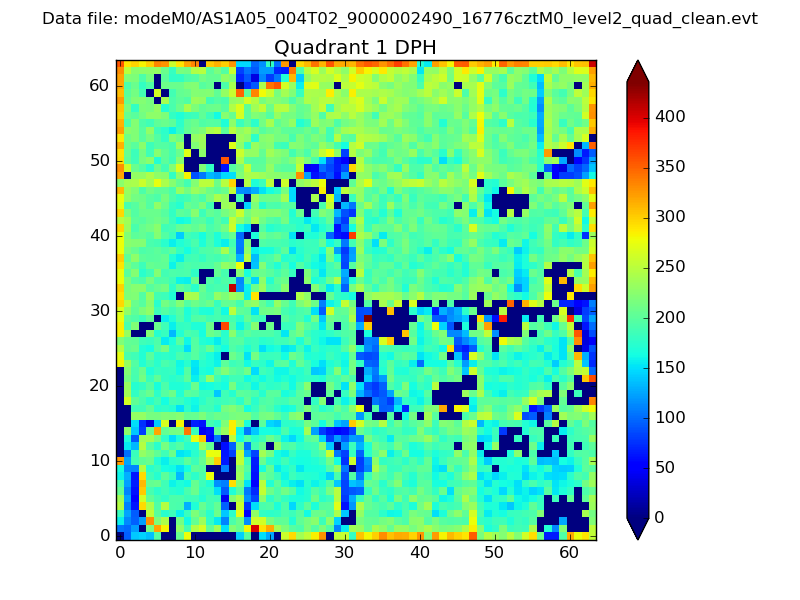 |
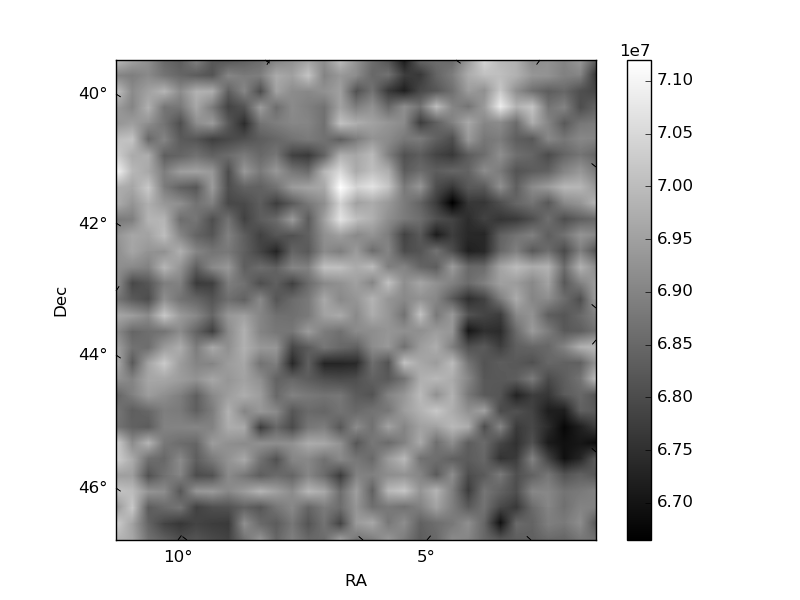
Quadrant B |
|---|---|---|---|
| Quadrant D | 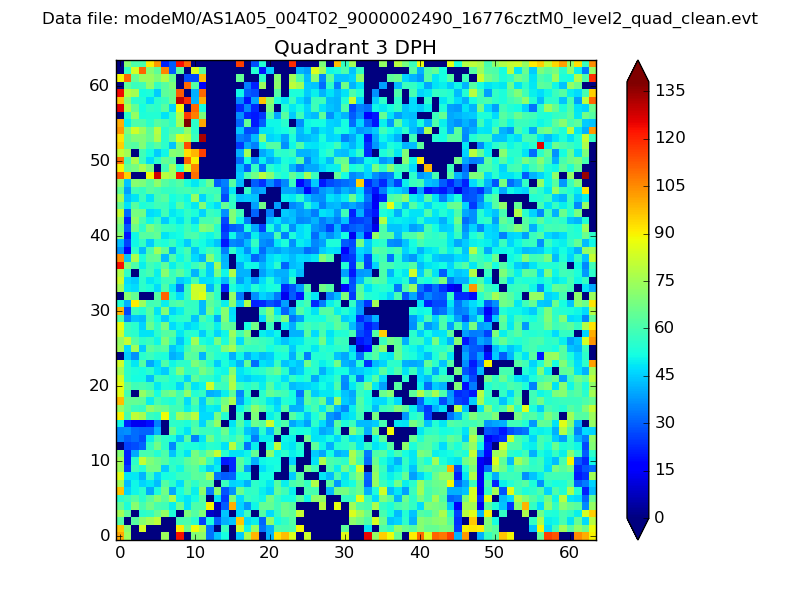 |
 |
Quadrant C |
| Plot type | Count rate plots | Images |
|---|---|---|
| Comparison with Poisson distribution Blue bars denote a histogram of data divided into 1 sec bins. Red curve is a Poisson curve with rate = median count rate of data. |
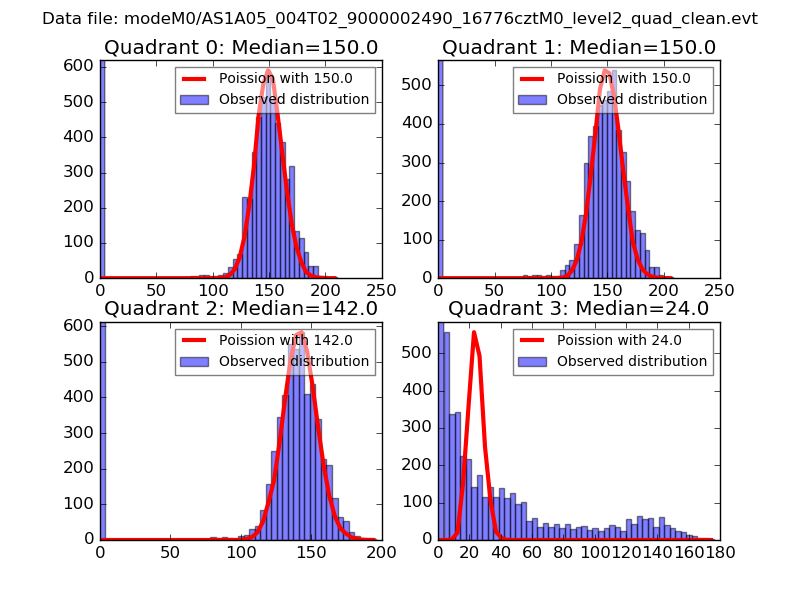 |
 |
| Quadrant-wise count rates Data is divided into 100 sec bins |
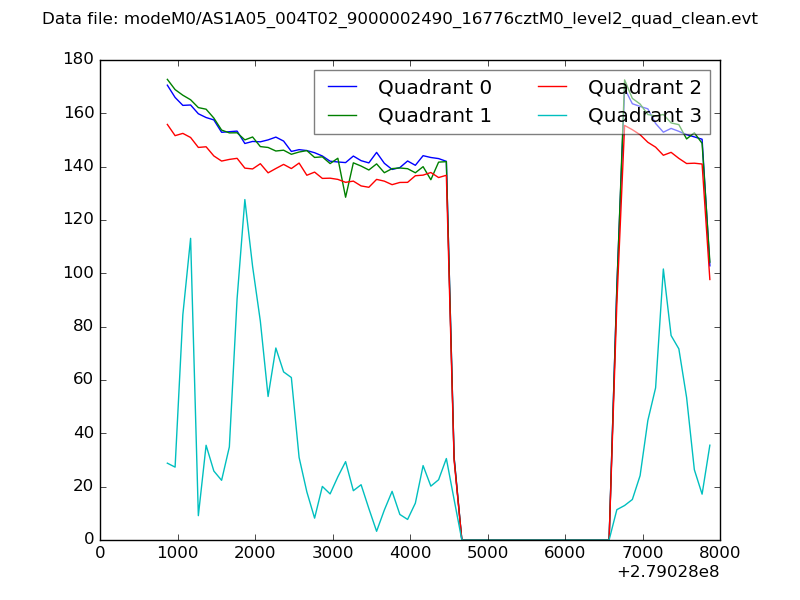 |
|
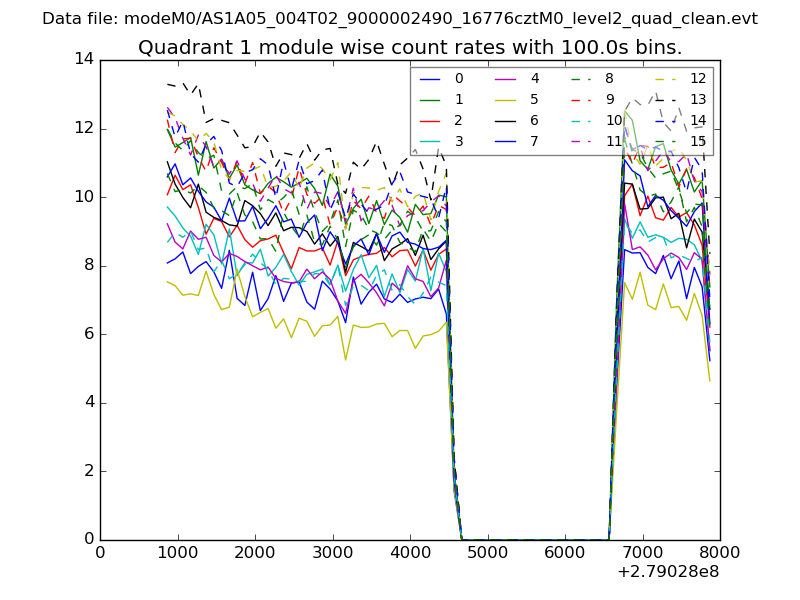
| Module-wise count rates for Quadrant A Data is divided into 100 sec bins |
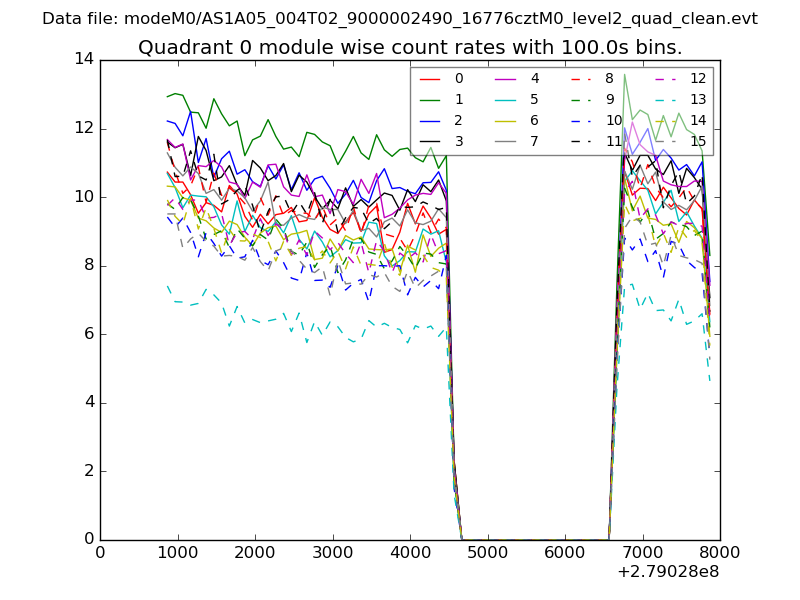 |
 |
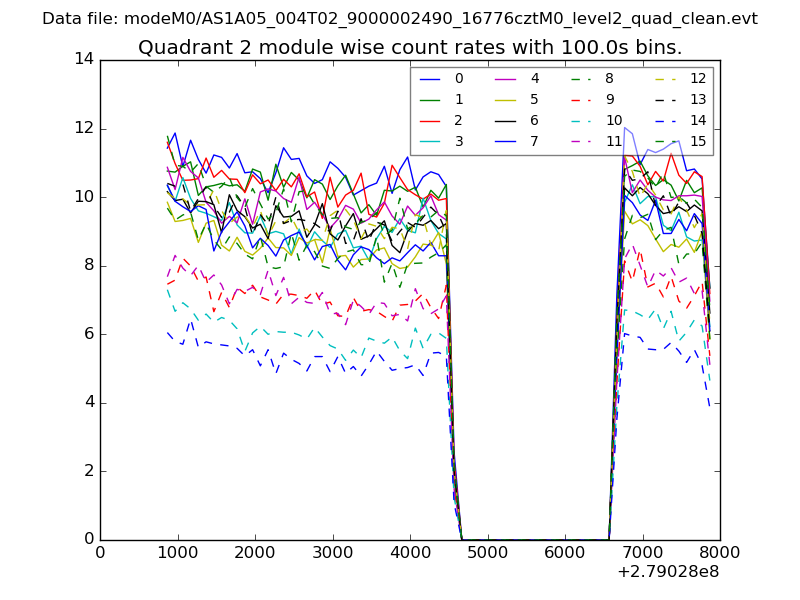
| Module-wise count rates for Quadrant B Data is divided into 100 sec bins |
 |
 |
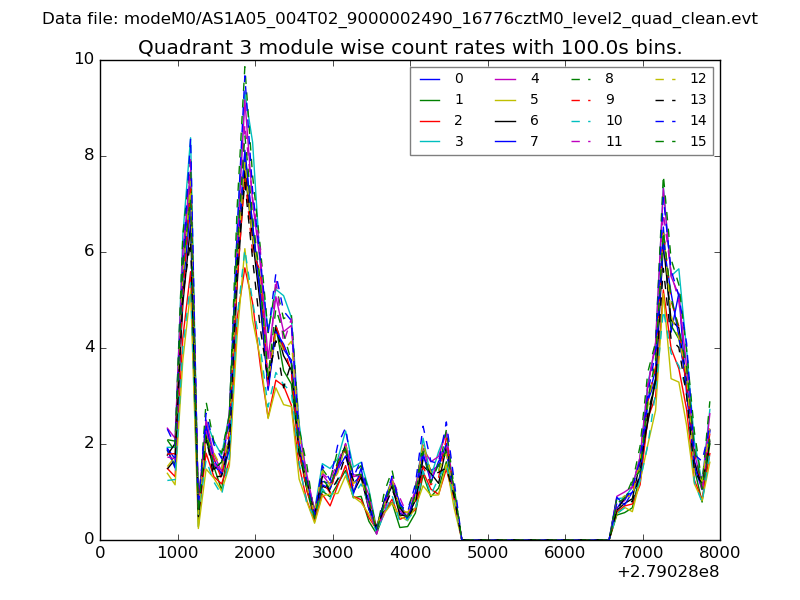
| Module-wise count rates for Quadrant C Data is divided into 100 sec bins |
 |
 |
| Module-wise count rates for Quadrant D Data is divided into 100 sec bins |
 |
 |
| Parameter | Plot |
|---|---|
| CZT HV Monitor | 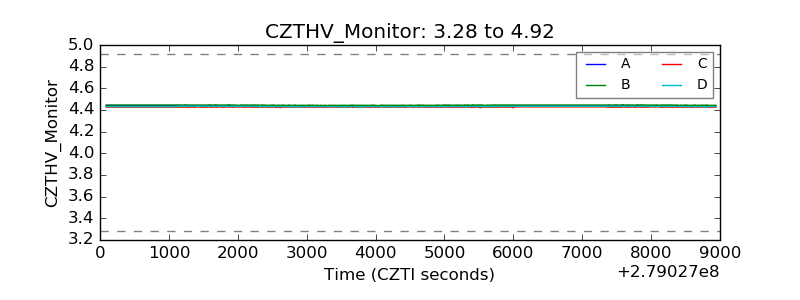 |
| D_VDD | 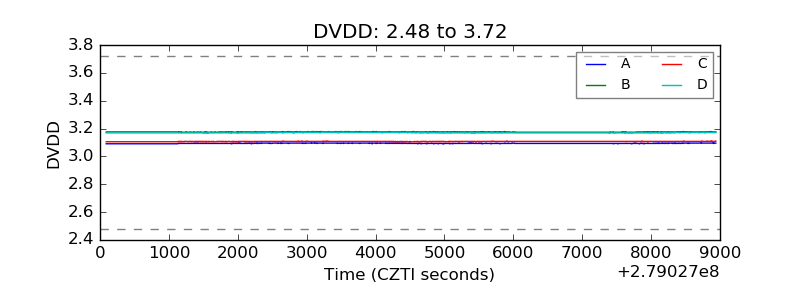 |
| Temperature 1 | 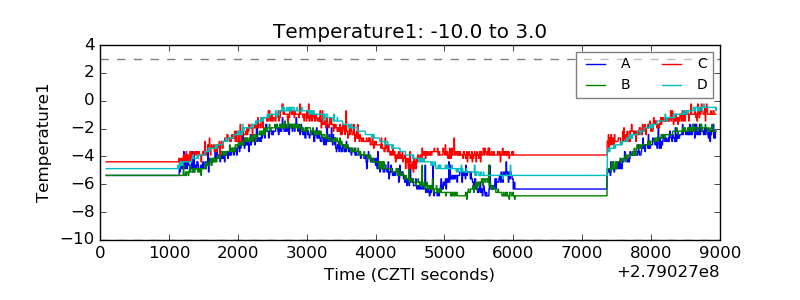 |
| Veto HV Monitor | 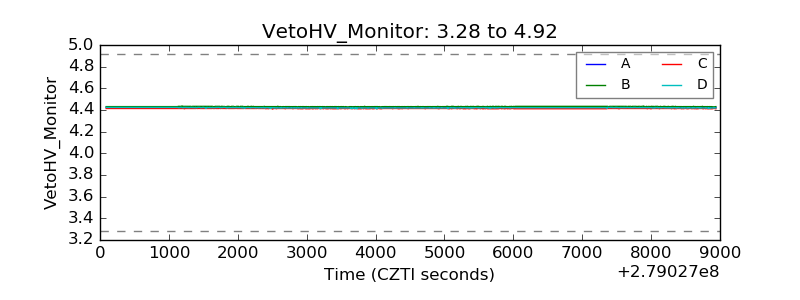 |
| Veto LLD | 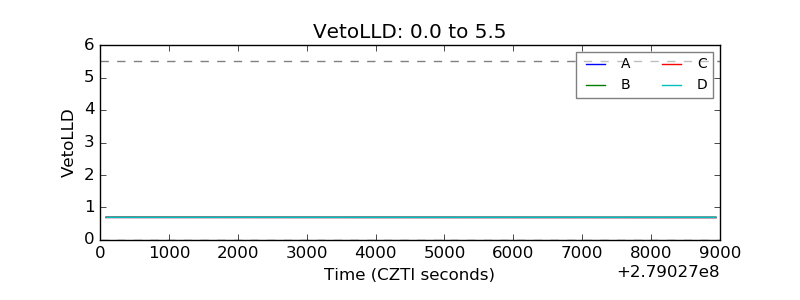 |
| Alpha Counter | 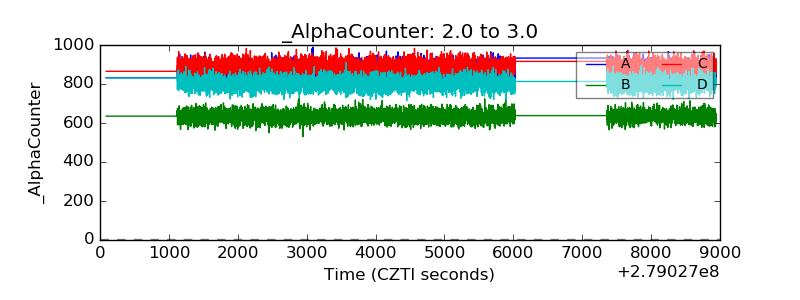 |
| _CPM_Rate | 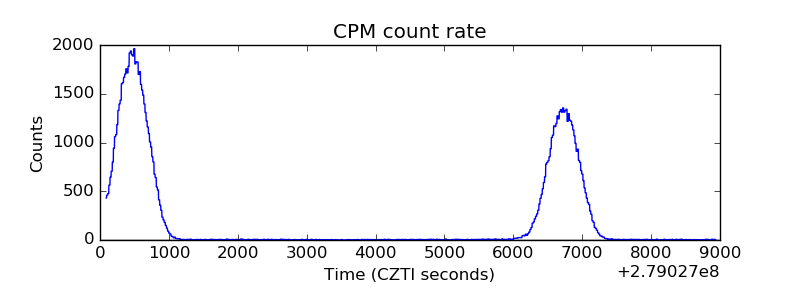 |
| CZT Counter | 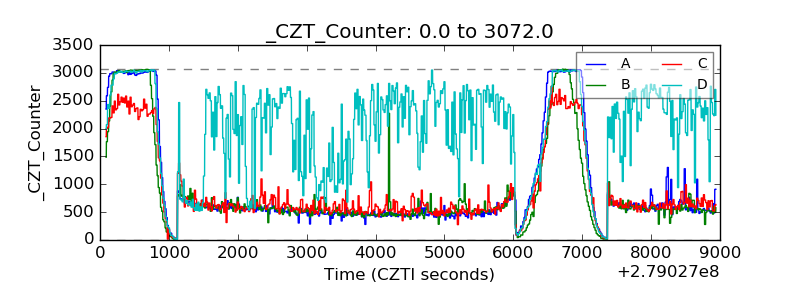 |
| +2.5 Volts monitor |  |
| +5 Volts monitor |  |
| _ROLL_ROT | 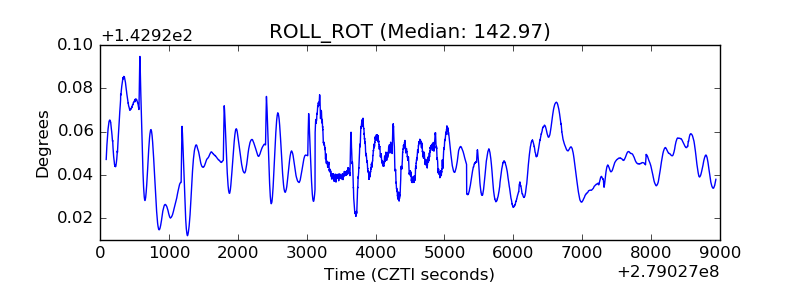 |
| _Roll_DEC | 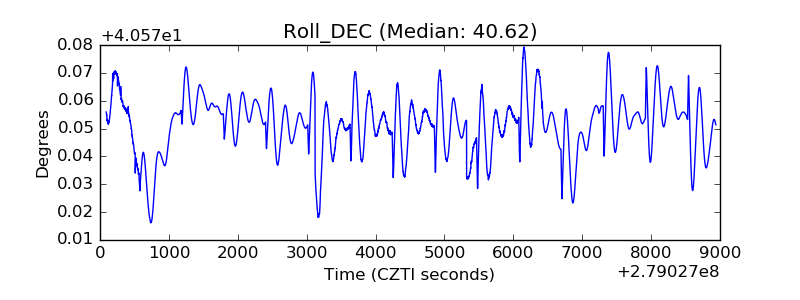 |
| _Roll_RA | 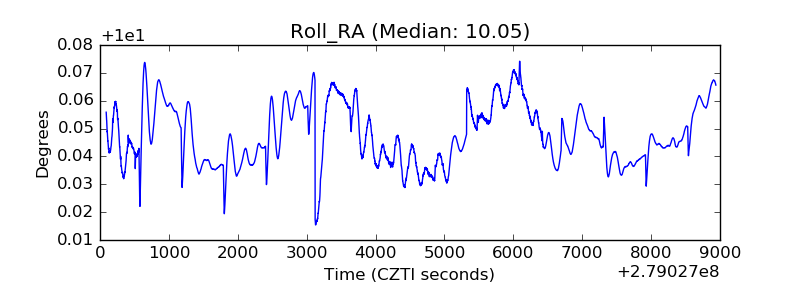 |
| Veto Counter | 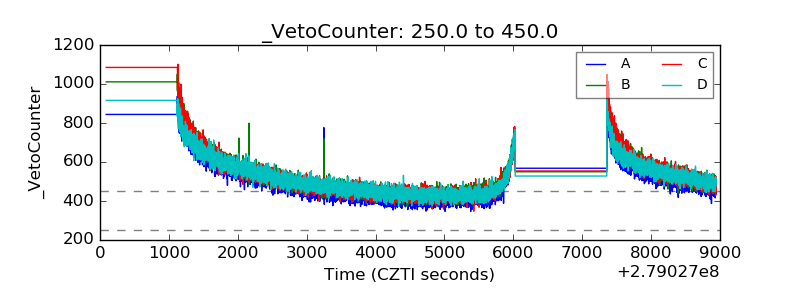 |