| Param | Original file | Final file |
|---|---|---|
| Filename | modeM0/AS1A05_004T02_9000002490_16777cztM0_level2.evt | modeM0/AS1A05_004T02_9000002490_16777cztM0_level2_quad_clean.evt |
| Size (bytes) | 741,545,280 | 92,116,800 |
| Size | 707.2 MB | 87.8 MB |
| Events in quadrant A | 5,264,097 | 664,177 |
| Events in quadrant B | 3,188,602 | 704,301 |
| Events in quadrant C | 3,622,625 | 670,230 |
| Events in quadrant D | 9,985,122 | 339,013 |
| Mode M0 | |||
|---|---|---|---|
| Quadrant | BADHDUFLAG | Total packets | Discarded packets |
| A | 0 | 19287 | 2 |
| B | 0 | 13106 | 1 |
| C | 0 | 14715 | 1 |
| D | 0 | 33774 | 1 |
| Mode SS | |||
|---|---|---|---|
| Quadrant | BADHDUFLAG | Total packets | Discarded packets |
| A | 0 | 120 | 0 |
| B | 0 | 120 | 0 |
| C | 0 | 120 | 0 |
| D | 0 | 120 | 0 |
| Mode M9 | |||
|---|---|---|---|
| Quadrant | BADHDUFLAG | Total packets | Discarded packets |
| A | 0 | 12 | 0 |
| B | 0 | 12 | 0 |
| C | 0 | 12 | 0 |
| D | 0 | 12 | 0 |
| Quadrant | Total seconds | Saturated seconds | Saturation percentage |
|---|---|---|---|
| A | 5867 | 768 | 13.090165% |
| B | 5867 | 149 | 2.539628% |
| C | 5867 | 192 | 3.272541% |
| D | 5867 | 3630 | 61.871485% |
Noise dominated data is calculated using 1-second bins in cleaned event files. If a bin has >2000 counts, and if more than 50% of those come from <1% of pixels, then it is considered to be noise-dominated and hence unusable.
| Quadrant | # 1 sec bins | Bins with >0 counts | Bins with >2000 counts | High rate bins dominated by noise | Noise dominated (total time) | Noise dominated (detector-on time) | Marked lightcurve |
|---|---|---|---|---|---|---|---|
| A | 7063 | 5868 | 471 | 471 | 6.67% | 8.03% | 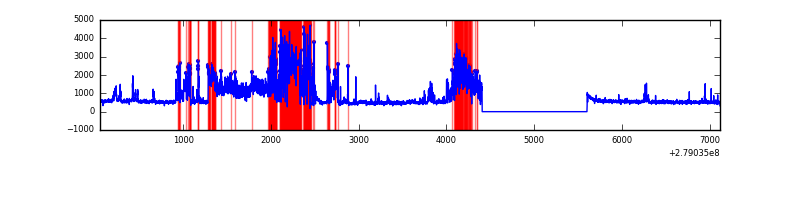 |
| B | 7063 | 5868 | 5 | 5 | 0.07% | 0.09% | 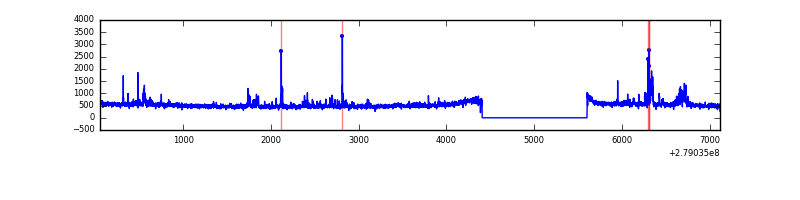 |
| C | 7063 | 5869 | 10 | 10 | 0.14% | 0.17% | 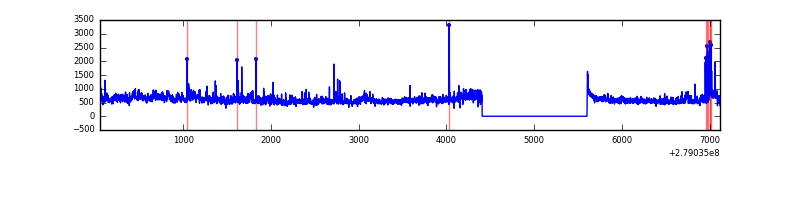 |
| D | 7062 | 5868 | 2365 | 2365 | 33.49% | 40.30% | 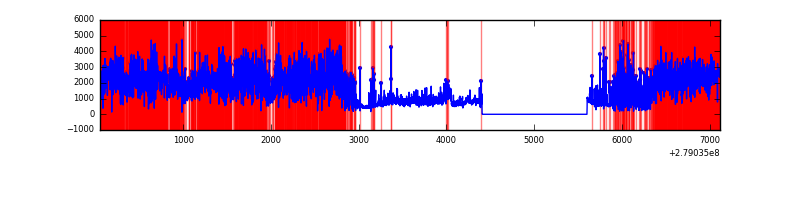 |
Top three noisy pixels from each quadrant. If the there are fewer than three noisy pixels in the level2.evt file, extra rows are filled as -1
| Pixel properties | Quadrant properties | ||||||
|---|---|---|---|---|---|---|---|
| Quadrant | DetID | PixID | Counts | Sigma | Mean | Median | Sigma |
| A | 15 | 174 | 2467127 | 17113.56 | 719 | 707 | 144.1 |
| A | 8 | 144 | 16928 | 112.55 | 719 | 707 | 144.1 |
| A | 0 | 13 | 10389 | 67.18 | 719 | 707 | 144.1 |
| B | 15 | 35 | 147849 | 1036.36 | 752 | 733 | 142.0 |
| B | 3 | 209 | 43117 | 298.57 | 752 | 733 | 142.0 |
| B | 0 | 189 | 26768 | 183.4 | 752 | 733 | 142.0 |
| C | 3 | 233 | 549668 | 3239.78 | 726 | 731 | 169.4 |
| C | 0 | 207 | 129406 | 759.43 | 726 | 731 | 169.4 |
| C | 14 | 238 | 111837 | 655.74 | 726 | 731 | 169.4 |
| D | 1 | 52 | 7162479 | 62436.37 | 478 | 465 | 114.7 |
| D | 12 | 110 | 914769 | 7970.64 | 478 | 465 | 114.7 |
| D | 12 | 218 | 58364 | 504.75 | 478 | 465 | 114.7 |
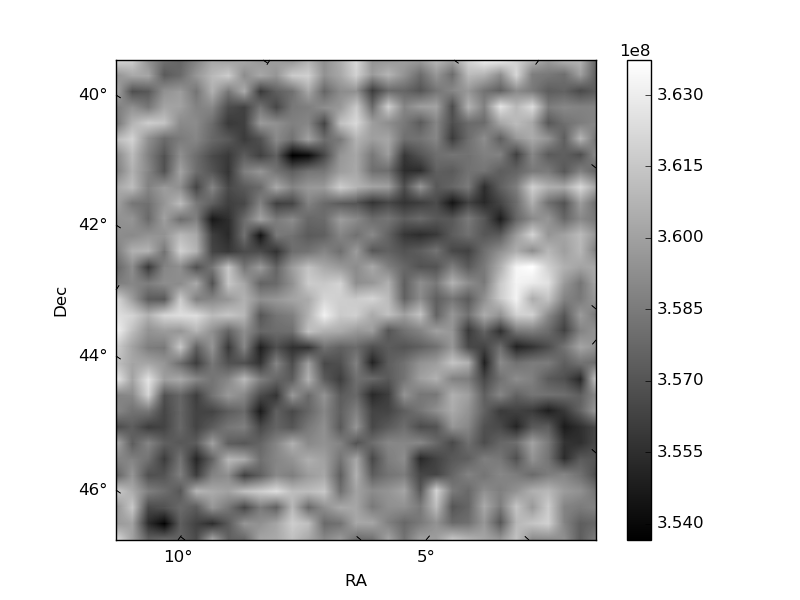
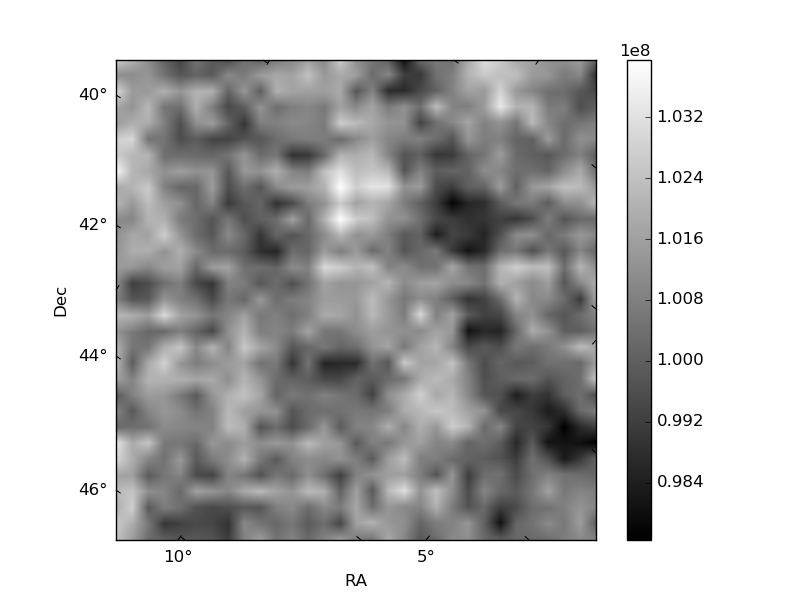
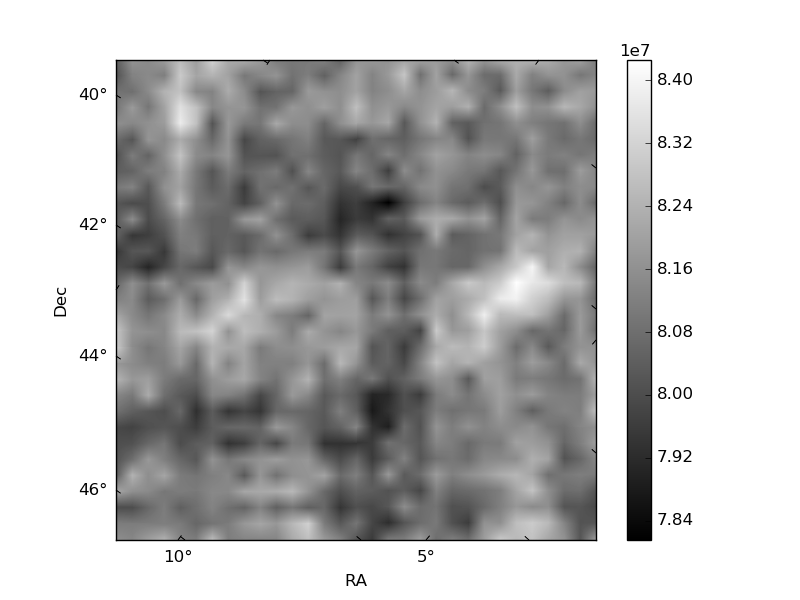
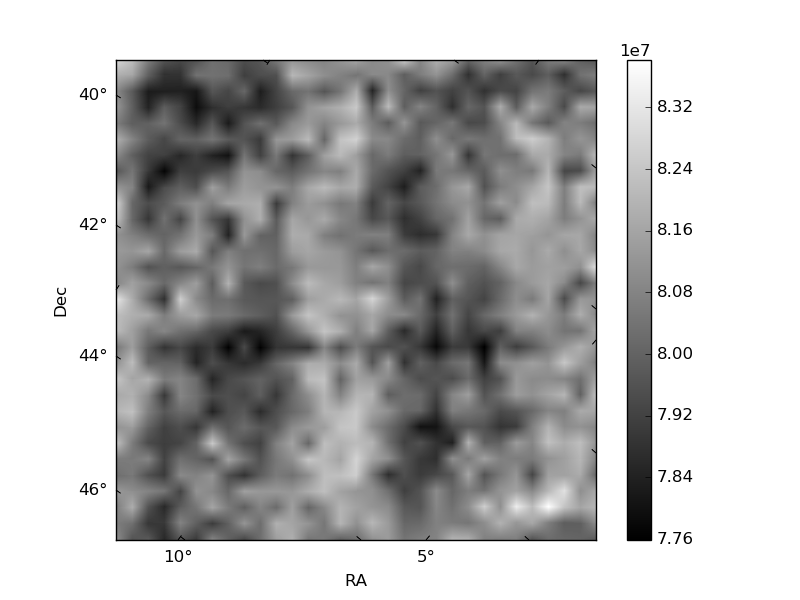
Histogram calculated using DETX and DETY for each event in the final _common_clean file
| Quadrant A | 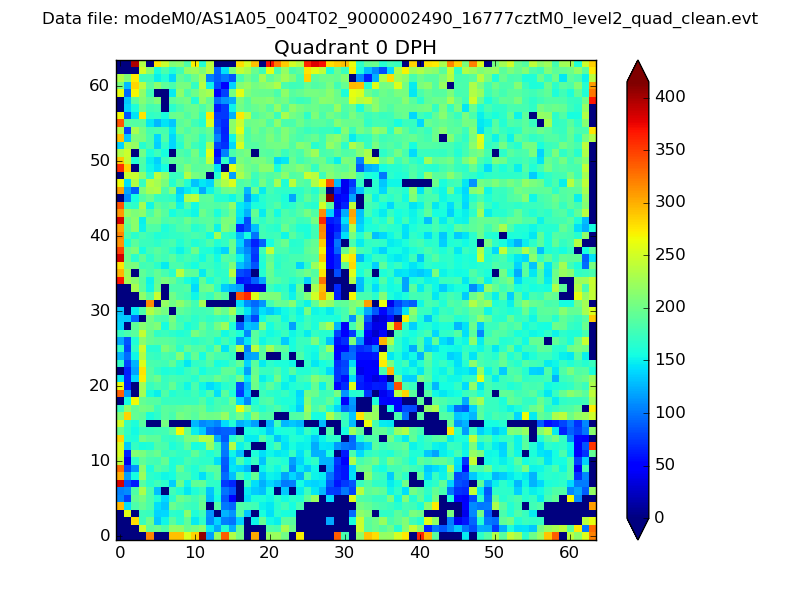 |
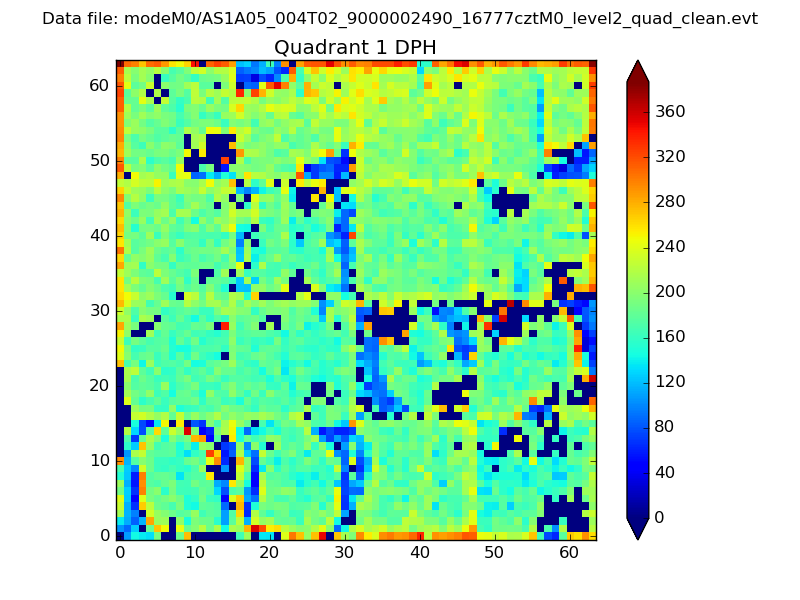 |
Quadrant B |
|---|---|---|---|
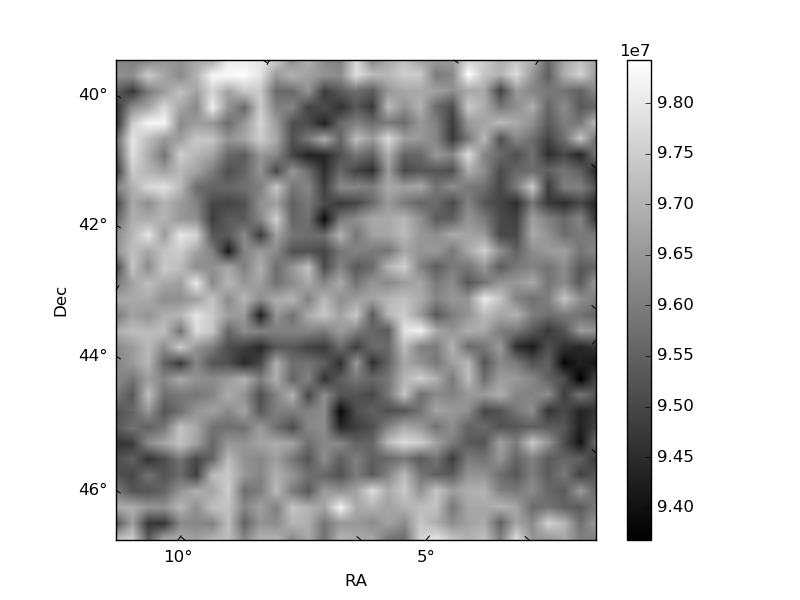
| Quadrant D |  |
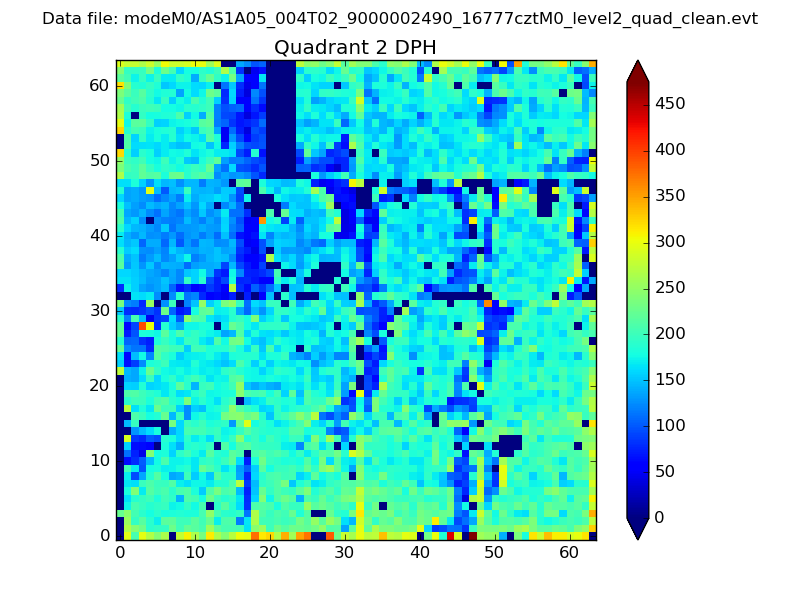 |
Quadrant C |
| Plot type | Count rate plots | Images |
|---|---|---|
| Comparison with Poisson distribution Blue bars denote a histogram of data divided into 1 sec bins. Red curve is a Poisson curve with rate = median count rate of data. |
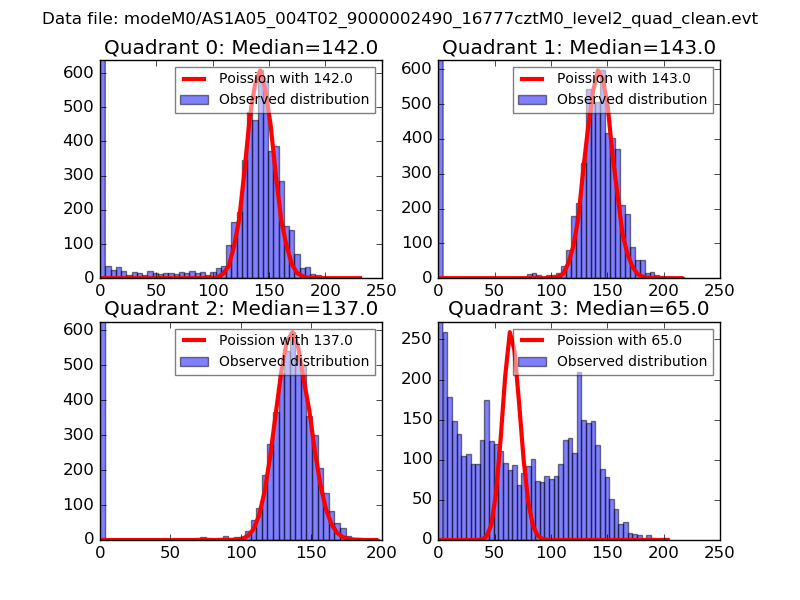 |
 |
| Quadrant-wise count rates Data is divided into 100 sec bins |
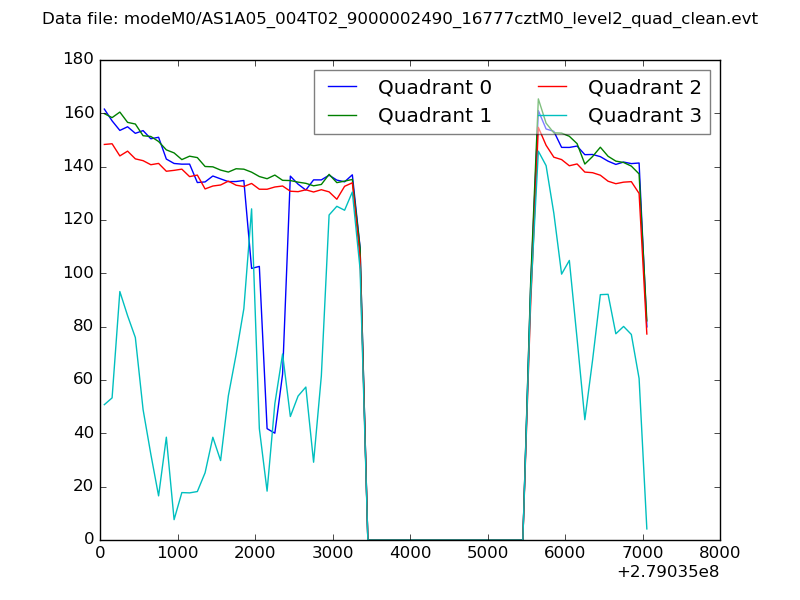 |
|
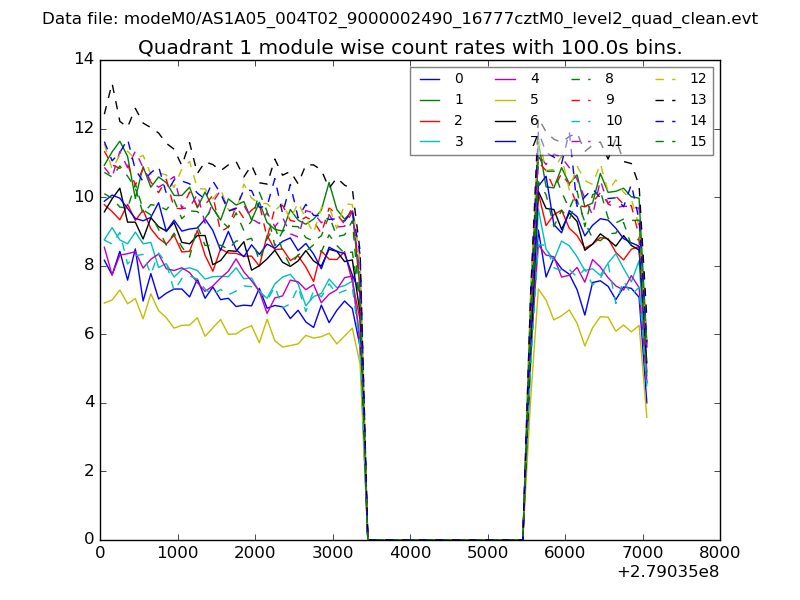
| Module-wise count rates for Quadrant A Data is divided into 100 sec bins |
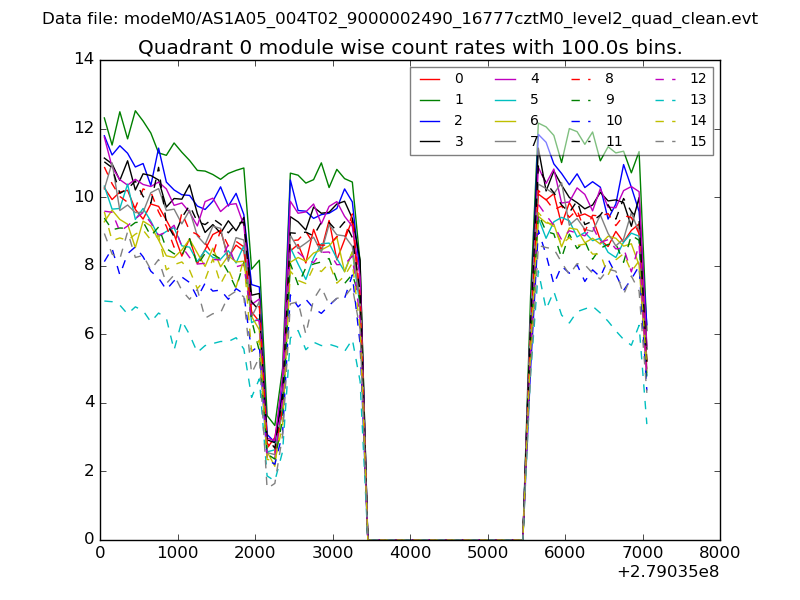 |
 |
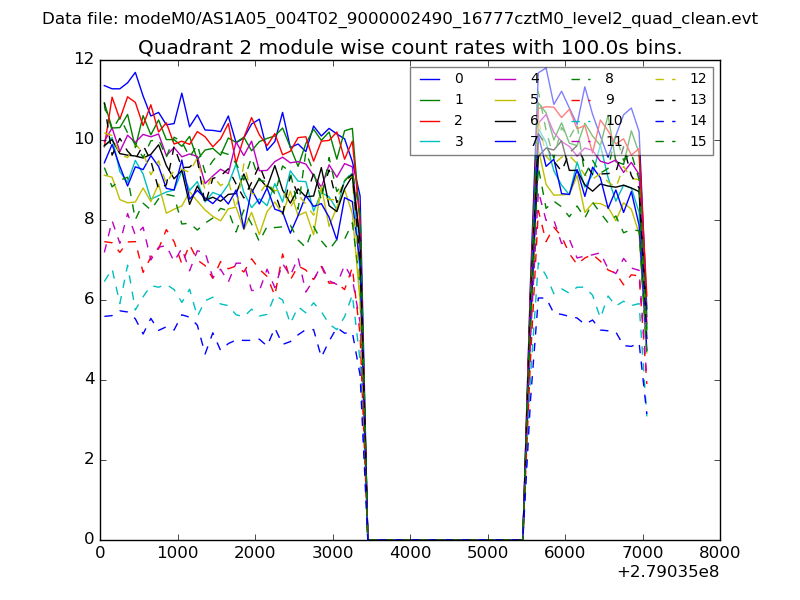
| Module-wise count rates for Quadrant B Data is divided into 100 sec bins |
 |
 |
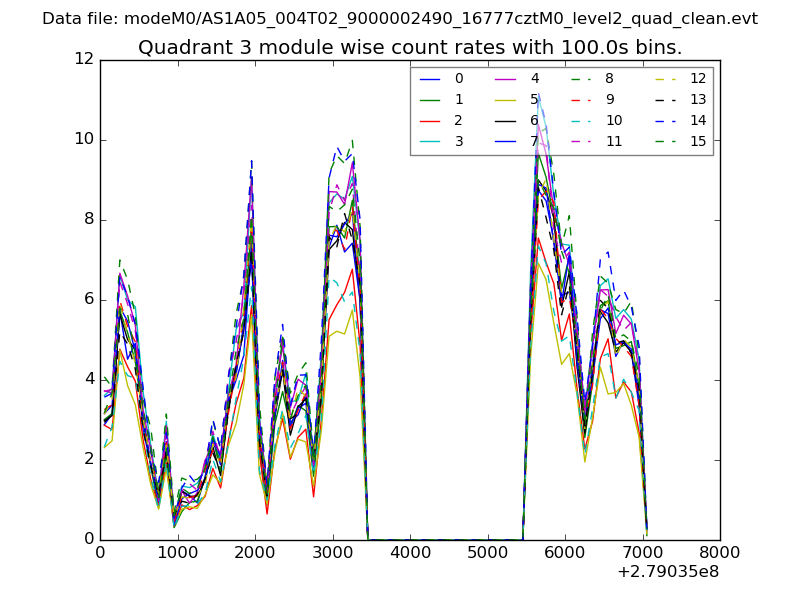
| Module-wise count rates for Quadrant C Data is divided into 100 sec bins |
 |
 |
| Module-wise count rates for Quadrant D Data is divided into 100 sec bins |
 |
 |
| Parameter | Plot |
|---|---|
| CZT HV Monitor | 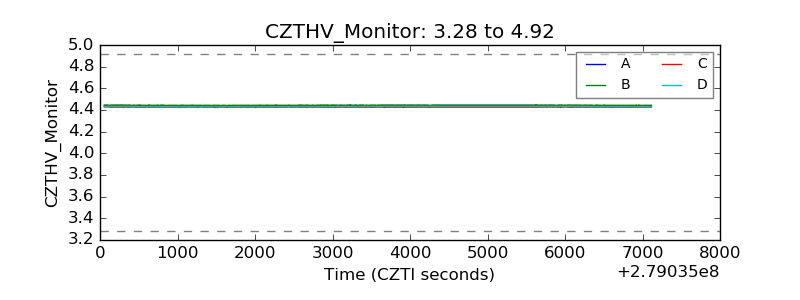 |
| D_VDD | 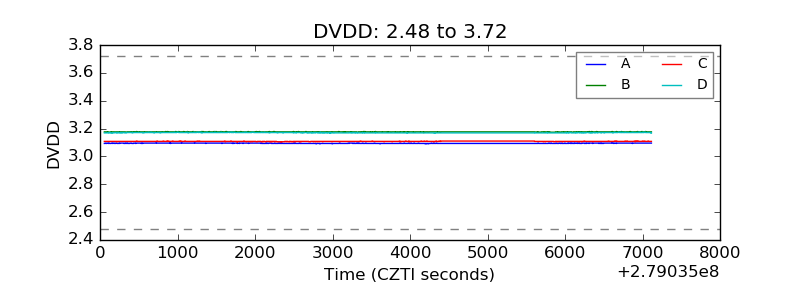 |
| Temperature 1 | 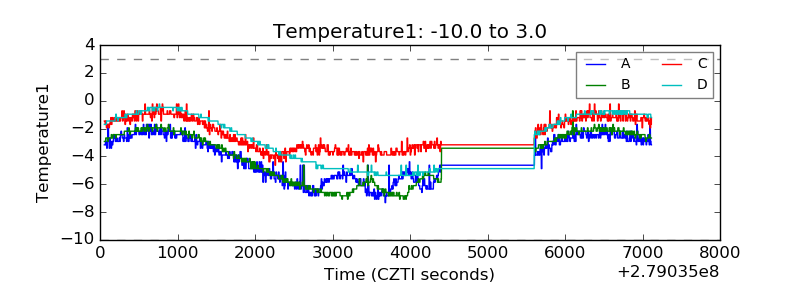 |
| Veto HV Monitor |  |
| Veto LLD | 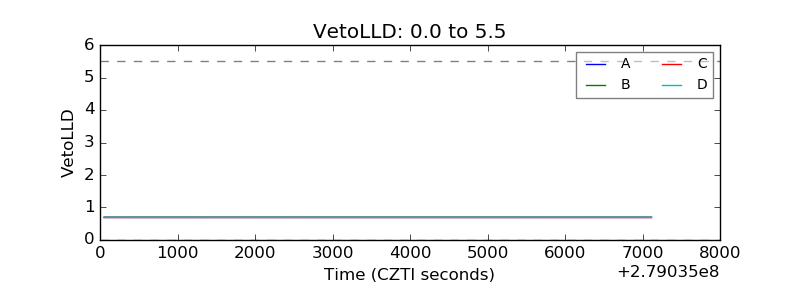 |
| Alpha Counter | 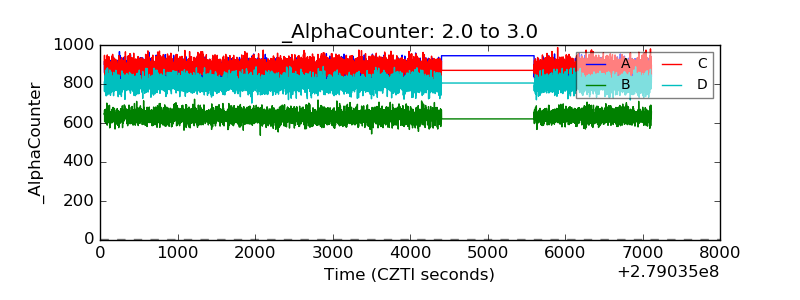 |
| _CPM_Rate |  |
| CZT Counter | 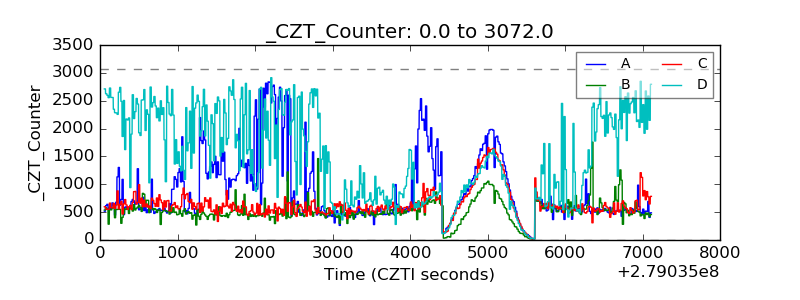 |
| +2.5 Volts monitor |  |
| +5 Volts monitor |  |
| _ROLL_ROT | 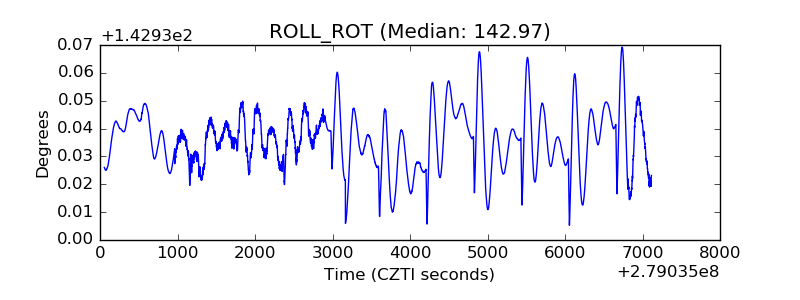 |
| _Roll_DEC | 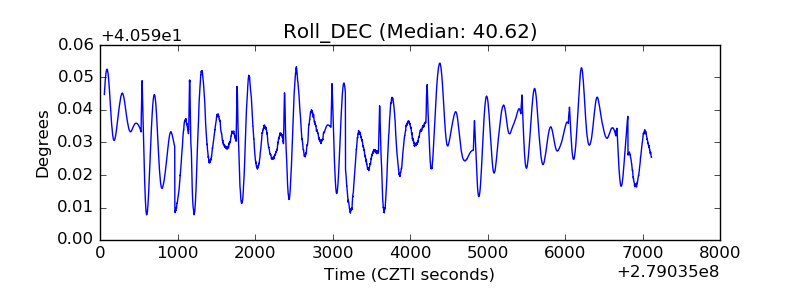 |
| _Roll_RA | 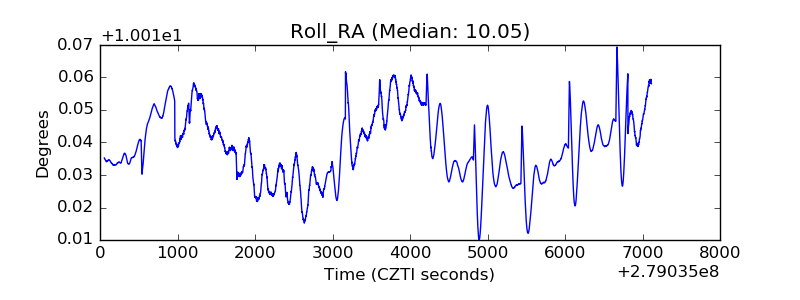 |
| Veto Counter | 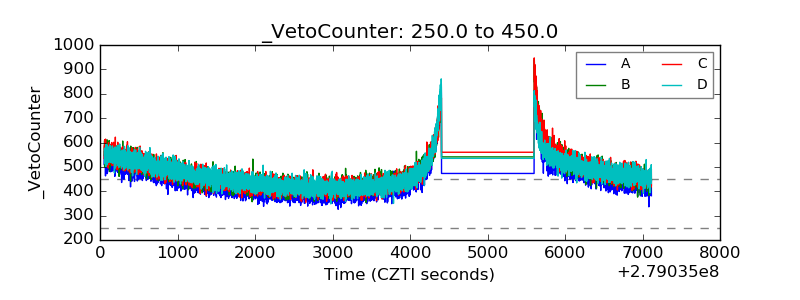 |