| Param | Original file | Final file |
|---|---|---|
| Filename | modeM0/AS1A05_004T02_9000002490_16778cztM0_level2.evt | modeM0/AS1A05_004T02_9000002490_16778cztM0_level2_quad_clean.evt |
| Size (bytes) | 792,889,920 | 84,306,240 |
| Size | 756.2 MB | 80.4 MB |
| Events in quadrant A | 3,257,422 | 634,901 |
| Events in quadrant B | 3,366,974 | 633,900 |
| Events in quadrant C | 3,919,851 | 607,470 |
| Events in quadrant D | 13,041,267 | 234,495 |
| Mode M0 | |||
|---|---|---|---|
| Quadrant | BADHDUFLAG | Total packets | Discarded packets |
| A | 0 | 13613 | 2 |
| B | 0 | 13892 | 1 |
| C | 0 | 15749 | 1 |
| D | 0 | 43080 | 1 |
| Mode SS | |||
|---|---|---|---|
| Quadrant | BADHDUFLAG | Total packets | Discarded packets |
| A | 0 | 130 | 0 |
| B | 0 | 130 | 0 |
| C | 0 | 130 | 0 |
| D | 0 | 130 | 0 |
| Mode M9 | |||
|---|---|---|---|
| Quadrant | BADHDUFLAG | Total packets | Discarded packets |
| A | 0 | 9 | 0 |
| B | 0 | 9 | 0 |
| C | 0 | 9 | 0 |
| D | 0 | 9 | 0 |
| Quadrant | Total seconds | Saturated seconds | Saturation percentage |
|---|---|---|---|
| A | 6304 | 104 | 1.649746% |
| B | 6304 | 102 | 1.618020% |
| C | 6304 | 170 | 2.696701% |
| D | 6304 | 5001 | 79.330584% |
Noise dominated data is calculated using 1-second bins in cleaned event files. If a bin has >2000 counts, and if more than 50% of those come from <1% of pixels, then it is considered to be noise-dominated and hence unusable.
| Quadrant | # 1 sec bins | Bins with >0 counts | Bins with >2000 counts | High rate bins dominated by noise | Noise dominated (total time) | Noise dominated (detector-on time) | Marked lightcurve |
|---|---|---|---|---|---|---|---|
| A | 7245 | 6306 | 17 | 17 | 0.23% | 0.27% | 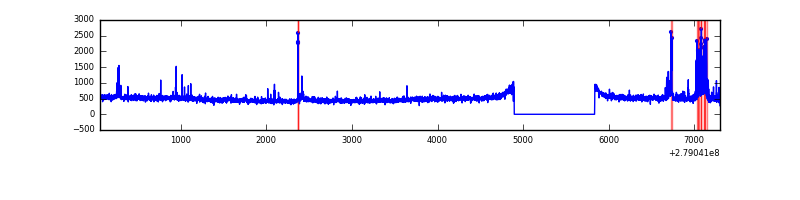 |
| B | 7245 | 6306 | 5 | 5 | 0.07% | 0.08% | 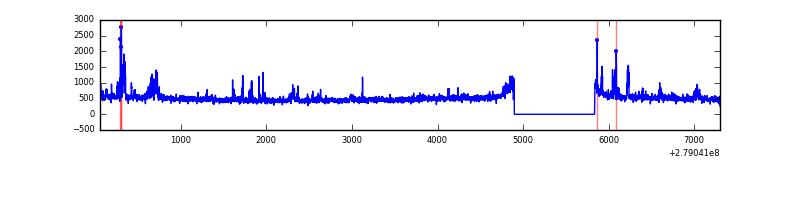 |
| C | 7245 | 6306 | 6 | 6 | 0.08% | 0.10% | 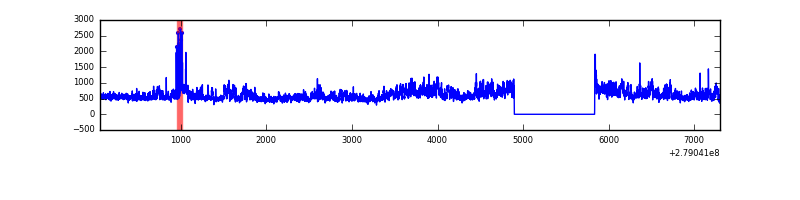 |
| D | 7244 | 6304 | 3672 | 3672 | 50.69% | 58.25% | 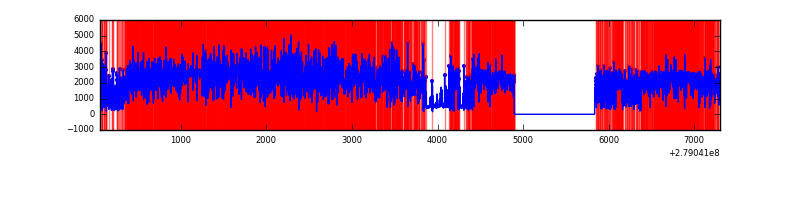 |
Top three noisy pixels from each quadrant. If the there are fewer than three noisy pixels in the level2.evt file, extra rows are filled as -1
| Pixel properties | Quadrant properties | ||||||
|---|---|---|---|---|---|---|---|
| Quadrant | DetID | PixID | Counts | Sigma | Mean | Median | Sigma |
| A | 15 | 174 | 209818 | 1310.95 | 788 | 771 | 159.5 |
| A | 0 | 13 | 18593 | 111.76 | 788 | 771 | 159.5 |
| A | 0 | 226 | 7091 | 39.63 | 788 | 771 | 159.5 |
| B | 15 | 35 | 212730 | 1435.56 | 778 | 759 | 147.7 |
| B | 0 | 229 | 34130 | 226.0 | 778 | 759 | 147.7 |
| B | 3 | 209 | 33473 | 221.55 | 778 | 759 | 147.7 |
| C | 3 | 233 | 784219 | 4446.54 | 753 | 757 | 176.2 |
| C | 14 | 238 | 115701 | 652.36 | 753 | 757 | 176.2 |
| C | 0 | 207 | 83930 | 472.05 | 753 | 757 | 176.2 |
| D | 1 | 52 | 11476236 | 129500.66 | 369 | 358 | 88.6 |
| D | 12 | 110 | 52094 | 583.82 | 369 | 358 | 88.6 |
| D | 11 | 176 | 43888 | 491.22 | 369 | 358 | 88.6 |
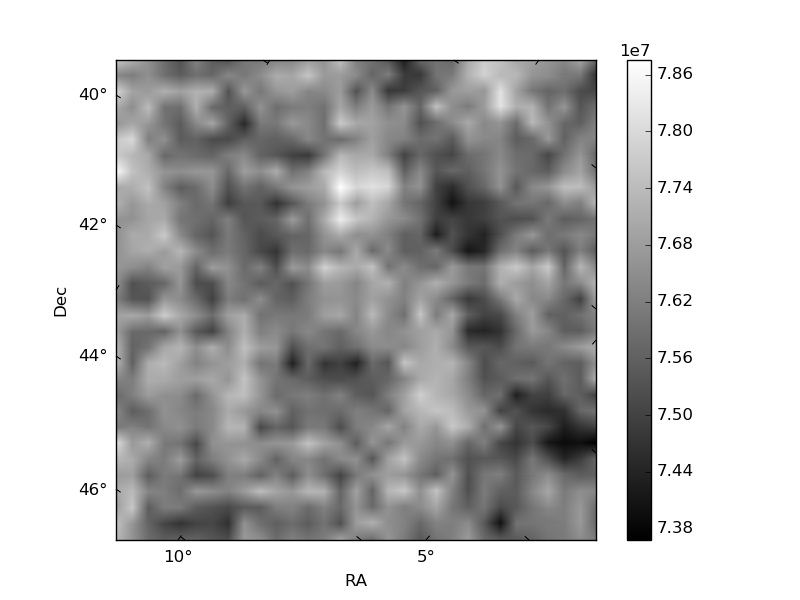
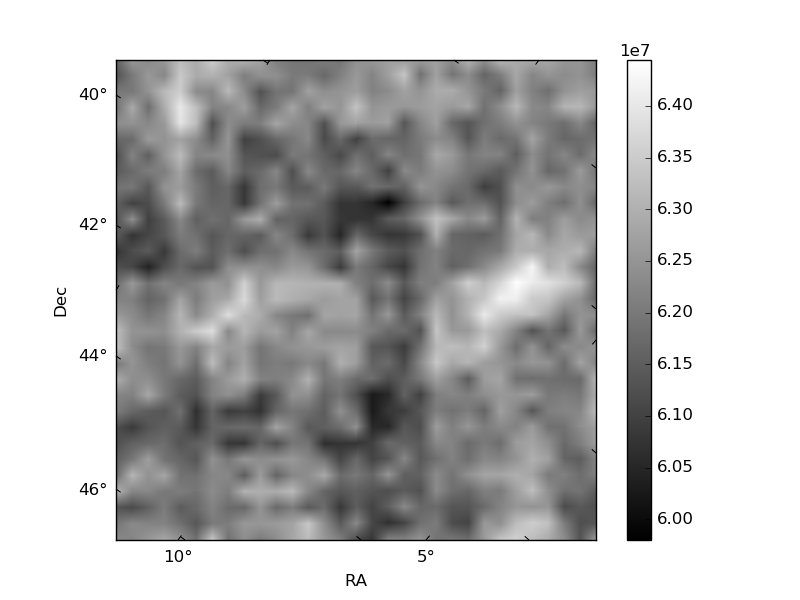
Histogram calculated using DETX and DETY for each event in the final _common_clean file
| Quadrant A |  |
 |
Quadrant B |
|---|---|---|---|
| Quadrant D |  |
 |
Quadrant C |
| Plot type | Count rate plots | Images |
|---|---|---|
| Comparison with Poisson distribution Blue bars denote a histogram of data divided into 1 sec bins. Red curve is a Poisson curve with rate = median count rate of data. |
 |
 |
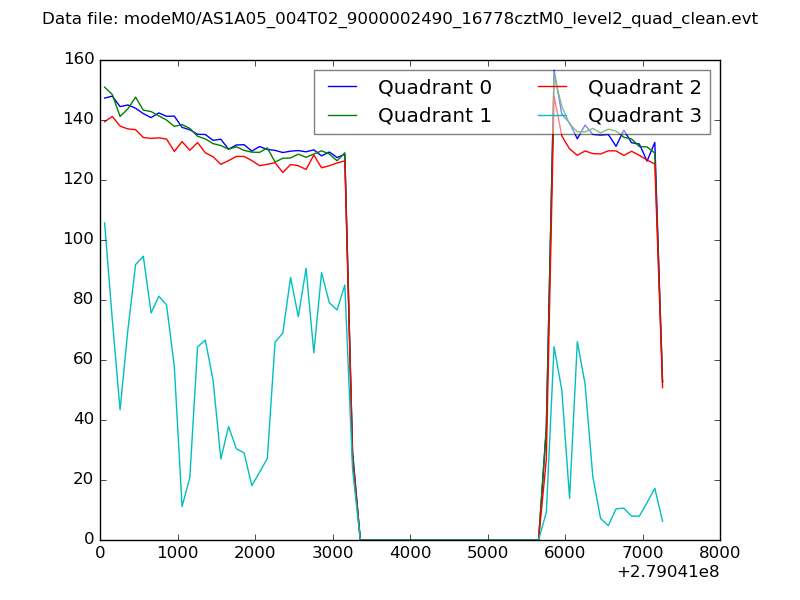
| Quadrant-wise count rates Data is divided into 100 sec bins |
 |
|
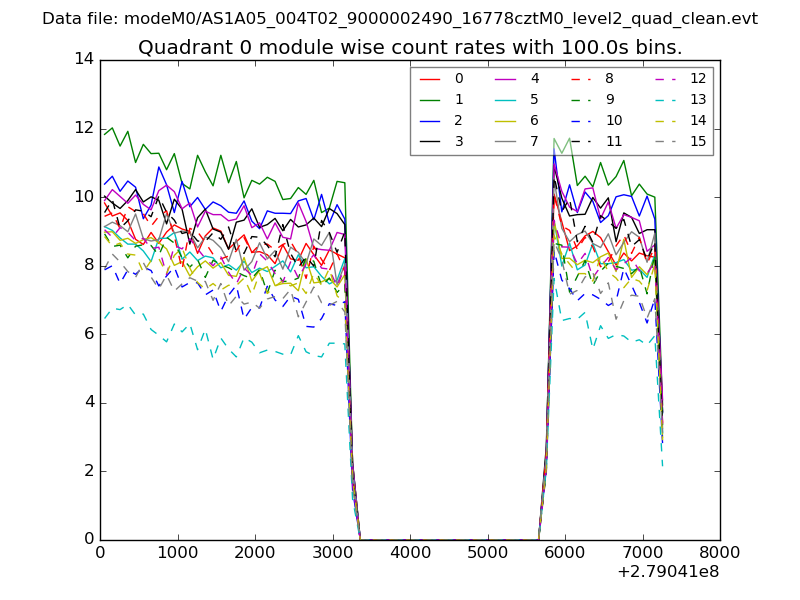
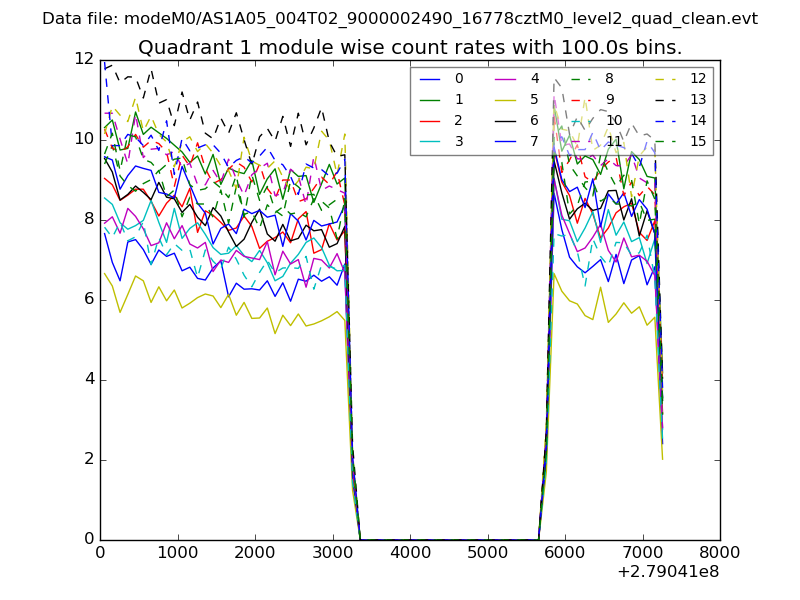
| Module-wise count rates for Quadrant A Data is divided into 100 sec bins |
 |
 |
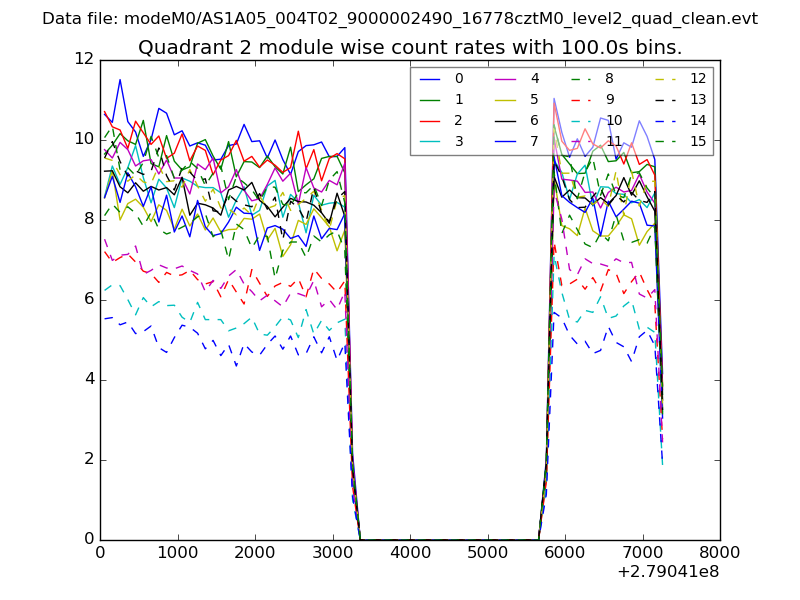
| Module-wise count rates for Quadrant B Data is divided into 100 sec bins |
 |
 |
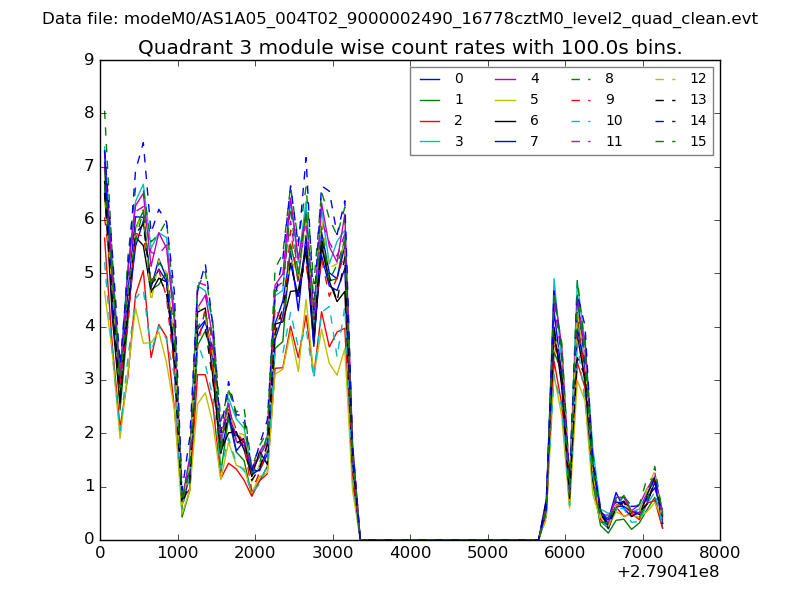
| Module-wise count rates for Quadrant C Data is divided into 100 sec bins |
 |
 |
| Module-wise count rates for Quadrant D Data is divided into 100 sec bins |
 |
 |
| Parameter | Plot |
|---|---|
| CZT HV Monitor | 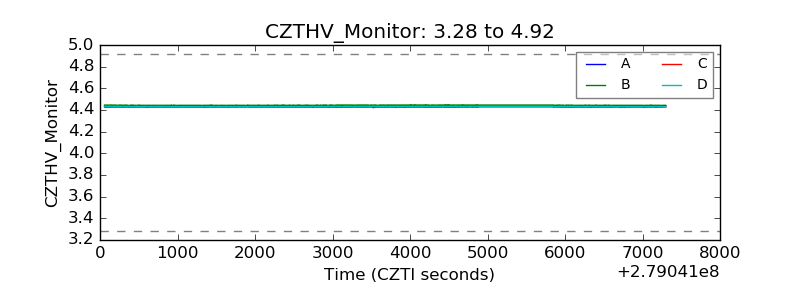 |
| D_VDD | 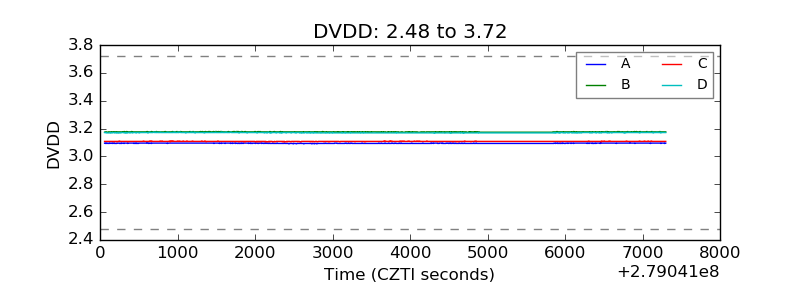 |
| Temperature 1 | 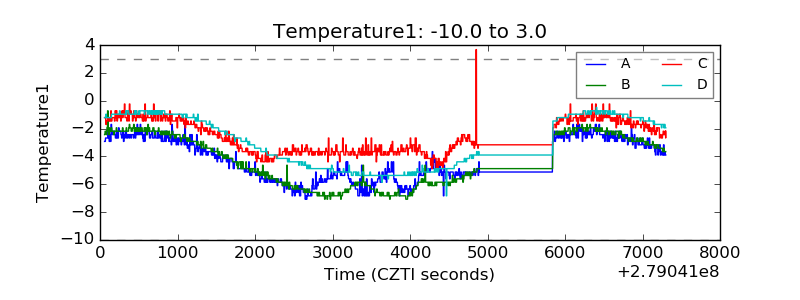 |
| Veto HV Monitor |  |
| Veto LLD | 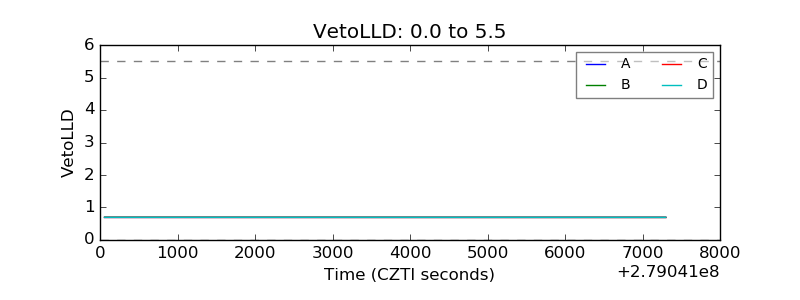 |
| Alpha Counter | 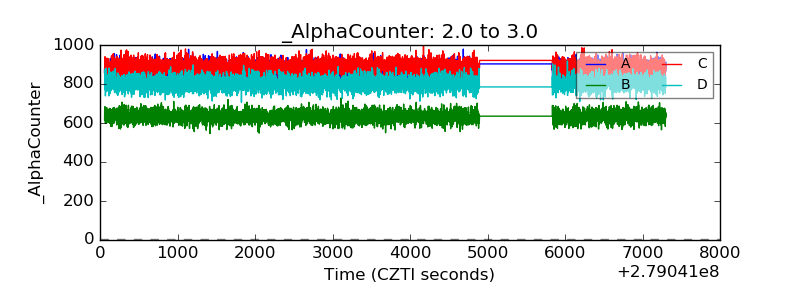 |
| _CPM_Rate | 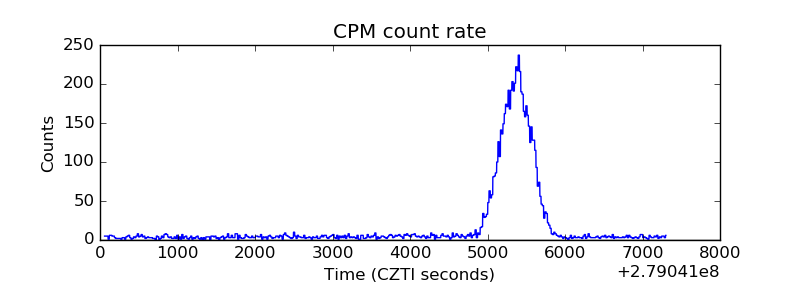 |
| CZT Counter | 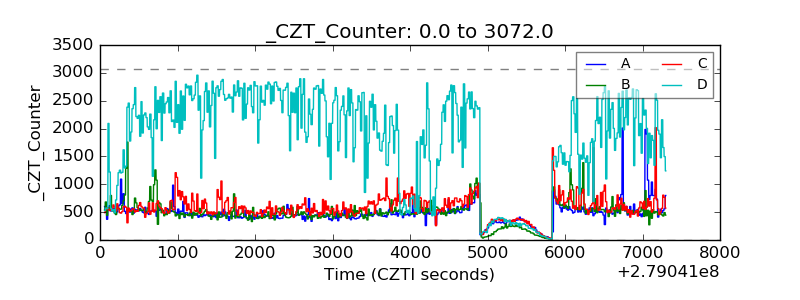 |
| +2.5 Volts monitor |  |
| +5 Volts monitor | 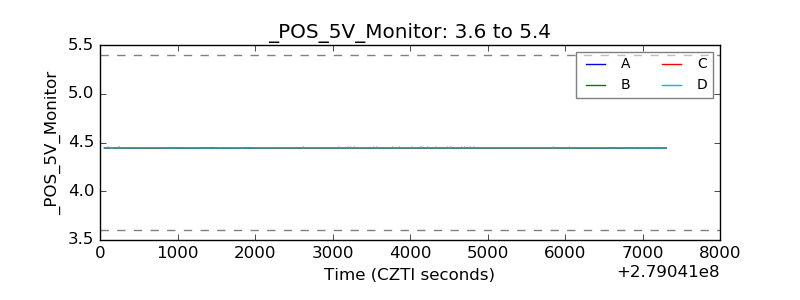 |
| _ROLL_ROT | 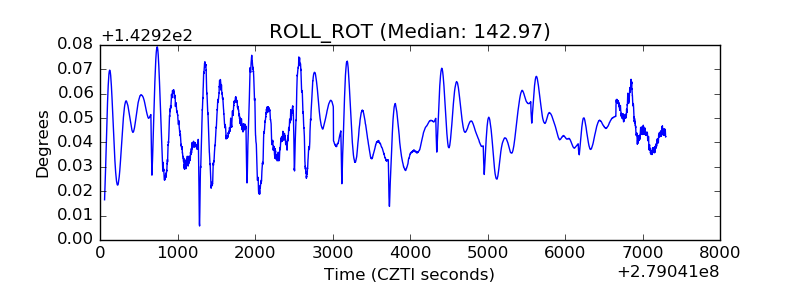 |
| _Roll_DEC | 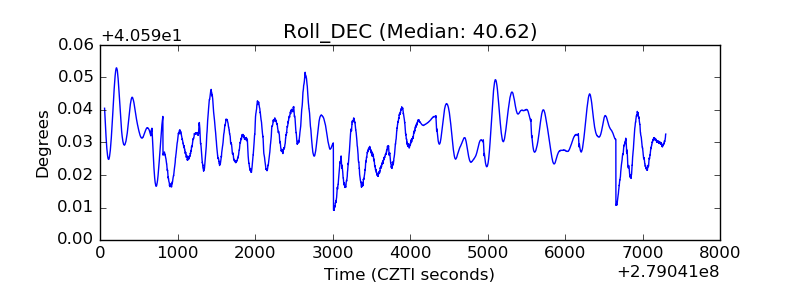 |
| _Roll_RA | 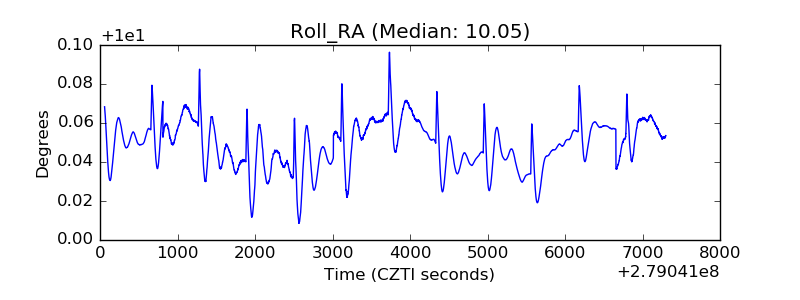 |
| Veto Counter | 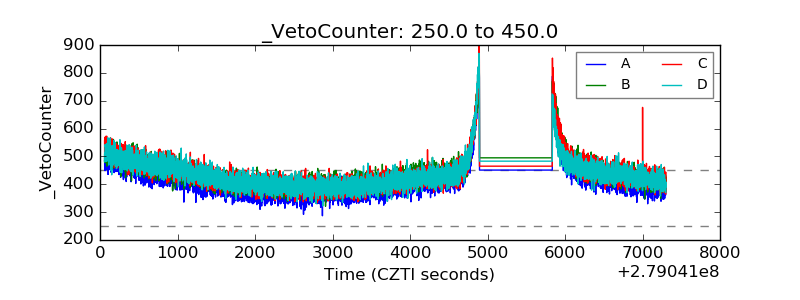 |