| Param | Original file | Final file |
|---|---|---|
| Filename | modeM0/AS1A05_004T02_9000002490_16780cztM0_level2.evt | modeM0/AS1A05_004T02_9000002490_16780cztM0_level2_quad_clean.evt |
| Size (bytes) | 949,786,560 | 100,152,000 |
| Size | 905.8 MB | 95.5 MB |
| Events in quadrant A | 7,566,234 | 603,689 |
| Events in quadrant B | 3,912,686 | 701,222 |
| Events in quadrant C | 5,397,786 | 662,651 |
| Events in quadrant D | 11,378,018 | 537,943 |
| Mode M0 | |||
|---|---|---|---|
| Quadrant | BADHDUFLAG | Total packets | Discarded packets |
| A | 0 | 27634 | 3 |
| B | 0 | 16465 | 2 |
| C | 0 | 21168 | 2 |
| D | 0 | 39055 | 2 |
| Mode SS | |||
|---|---|---|---|
| Quadrant | BADHDUFLAG | Total packets | Discarded packets |
| A | 0 | 154 | 0 |
| B | 0 | 154 | 0 |
| C | 0 | 154 | 0 |
| D | 0 | 154 | 0 |
| Mode M9 | |||
|---|---|---|---|
| Quadrant | BADHDUFLAG | Total packets | Discarded packets |
| A | 0 | 3 | 0 |
| B | 0 | 3 | 0 |
| C | 0 | 3 | 0 |
| D | 0 | 4 | 0 |
| Quadrant | Total seconds | Saturated seconds | Saturation percentage |
|---|---|---|---|
| A | 7557 | 1586 | 20.987164% |
| B | 7557 | 105 | 1.389440% |
| C | 7557 | 435 | 5.756252% |
| D | 7557 | 2734 | 36.178378% |
Noise dominated data is calculated using 1-second bins in cleaned event files. If a bin has >2000 counts, and if more than 50% of those come from <1% of pixels, then it is considered to be noise-dominated and hence unusable.
| Quadrant | # 1 sec bins | Bins with >0 counts | Bins with >2000 counts | High rate bins dominated by noise | Noise dominated (total time) | Noise dominated (detector-on time) | Marked lightcurve |
|---|---|---|---|---|---|---|---|
| A | 7818 | 7559 | 1319 | 1319 | 16.87% | 17.45% | 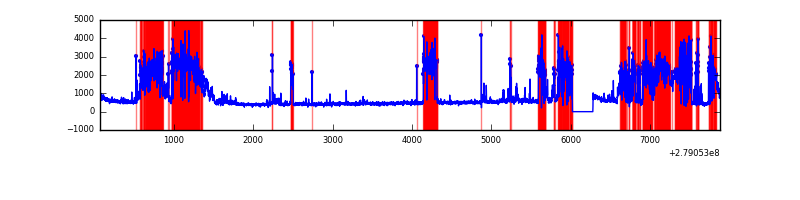 |
| B | 7818 | 7559 | 2 | 2 | 0.03% | 0.03% | 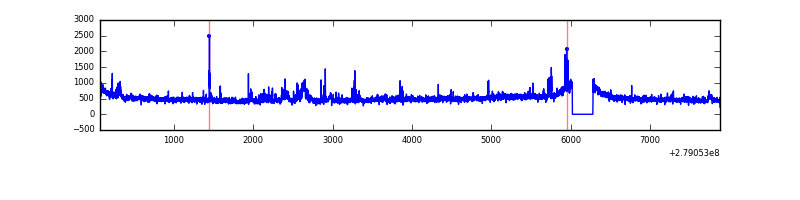 |
| C | 7818 | 7559 | 49 | 49 | 0.63% | 0.65% | 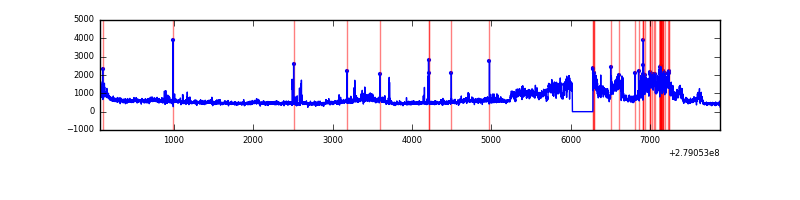 |
| D | 7818 | 7558 | 2117 | 2117 | 27.08% | 28.01% | 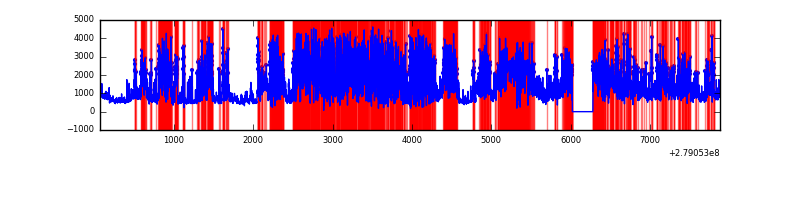 |
Top three noisy pixels from each quadrant. If the there are fewer than three noisy pixels in the level2.evt file, extra rows are filled as -1
| Pixel properties | Quadrant properties | ||||||
|---|---|---|---|---|---|---|---|
| Quadrant | DetID | PixID | Counts | Sigma | Mean | Median | Sigma |
| A | 15 | 174 | 4360205 | 25775.99 | 834 | 814 | 169.1 |
| A | 0 | 226 | 7399 | 38.94 | 834 | 814 | 169.1 |
| A | 12 | 194 | 6239 | 32.08 | 834 | 814 | 169.1 |
| B | 15 | 35 | 139785 | 779.0 | 923 | 899 | 178.3 |
| B | 0 | 229 | 45641 | 250.96 | 923 | 899 | 178.3 |
| B | 3 | 209 | 28534 | 155.0 | 923 | 899 | 178.3 |
| C | 3 | 233 | 1710954 | 8314.61 | 878 | 884 | 205.7 |
| C | 14 | 238 | 133231 | 643.49 | 878 | 884 | 205.7 |
| C | 0 | 207 | 129355 | 624.64 | 878 | 884 | 205.7 |
| D | 1 | 52 | 7812335 | 42813.44 | 741 | 721 | 182.5 |
| D | 12 | 218 | 340795 | 1863.86 | 741 | 721 | 182.5 |
| D | 11 | 176 | 302658 | 1654.84 | 741 | 721 | 182.5 |
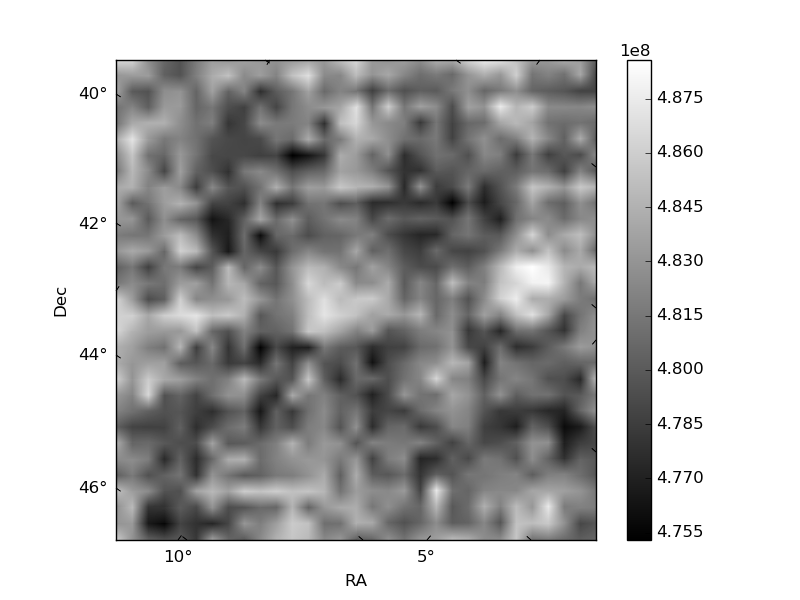
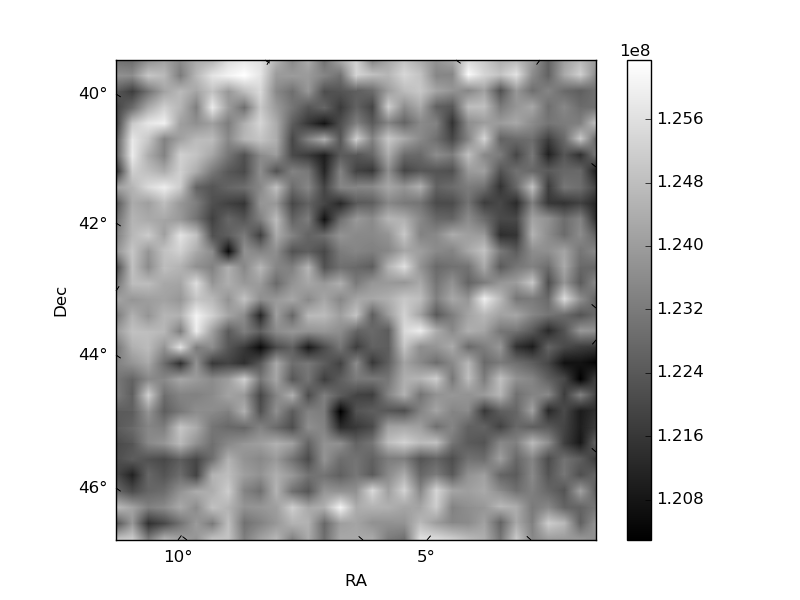
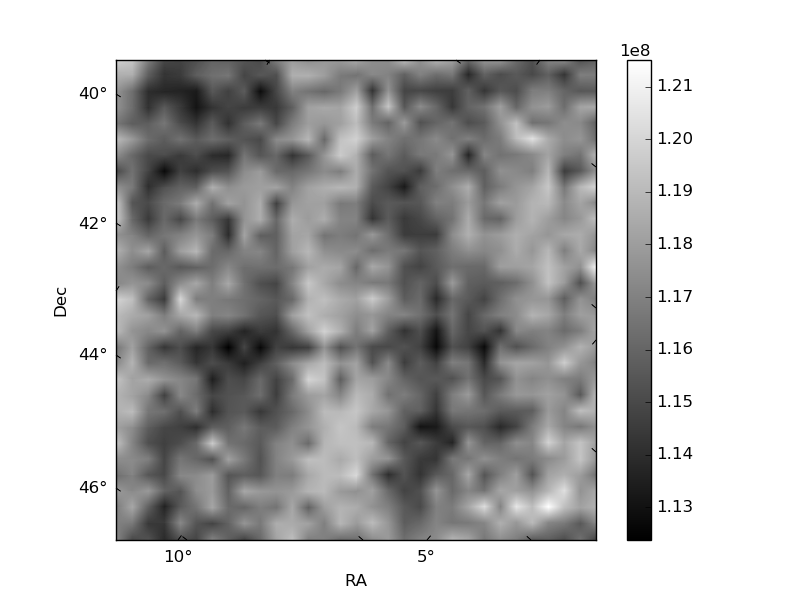
Histogram calculated using DETX and DETY for each event in the final _common_clean file
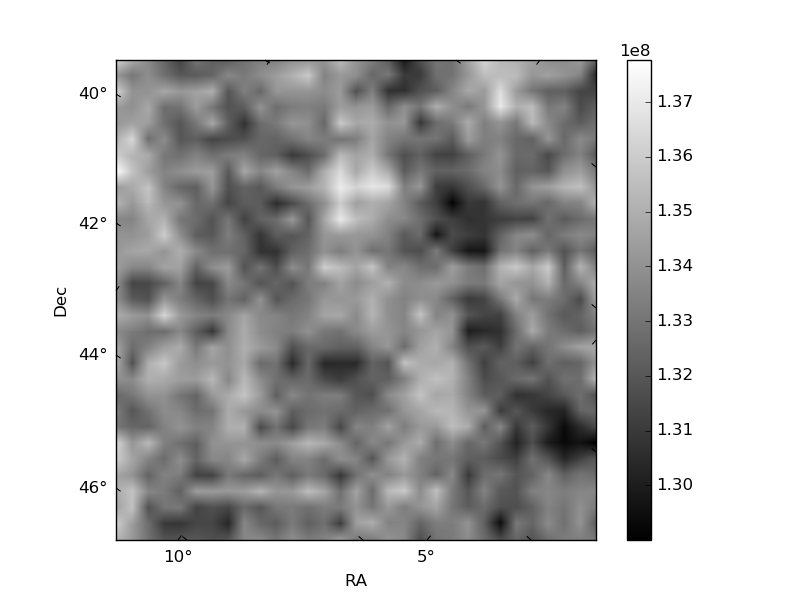
| Quadrant A | 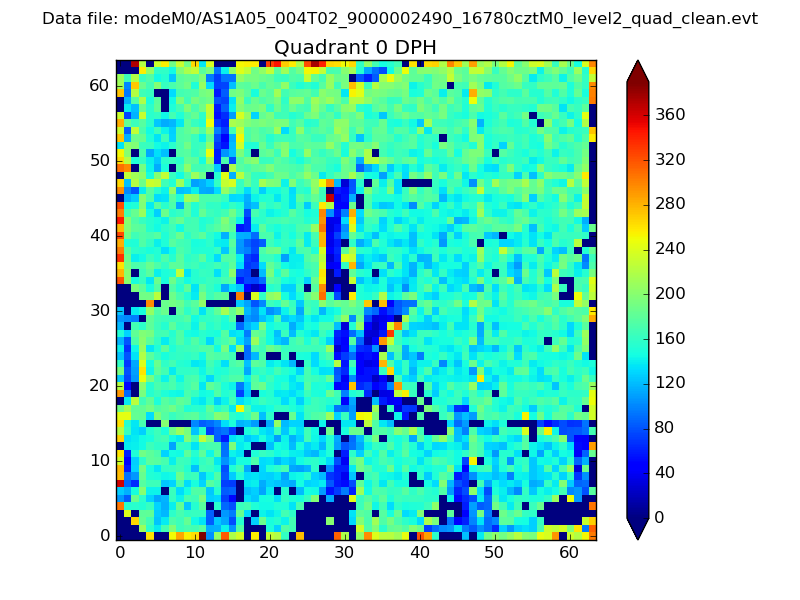 |
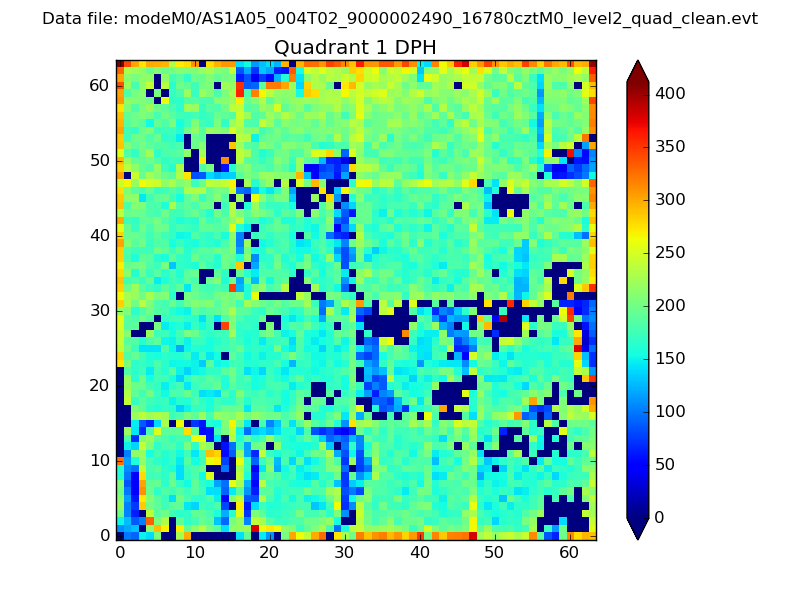 |
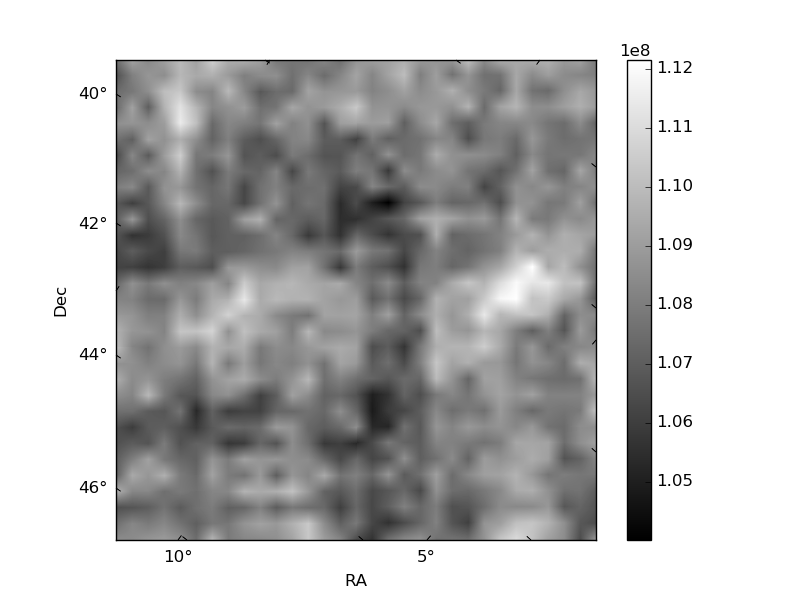
Quadrant B |
|---|---|---|---|
| Quadrant D |  |
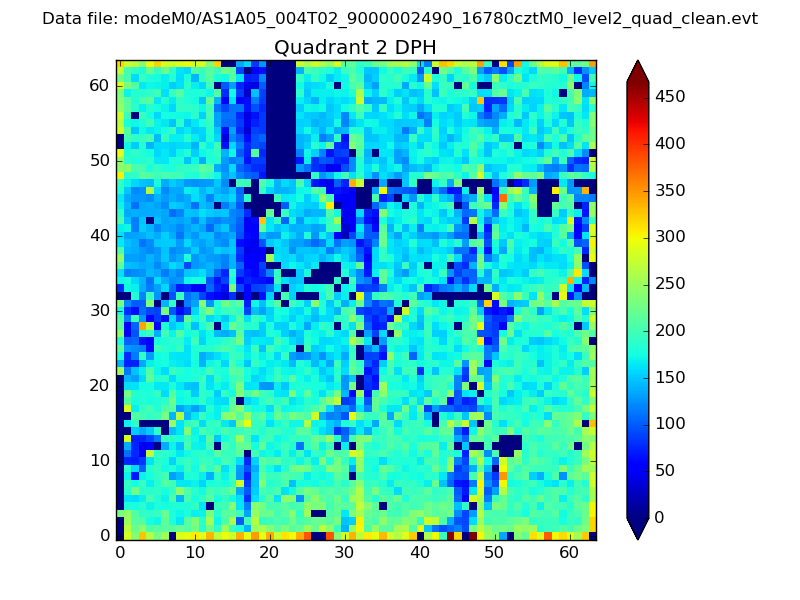 |
Quadrant C |
| Plot type | Count rate plots | Images |
|---|---|---|
| Comparison with Poisson distribution Blue bars denote a histogram of data divided into 1 sec bins. Red curve is a Poisson curve with rate = median count rate of data. |
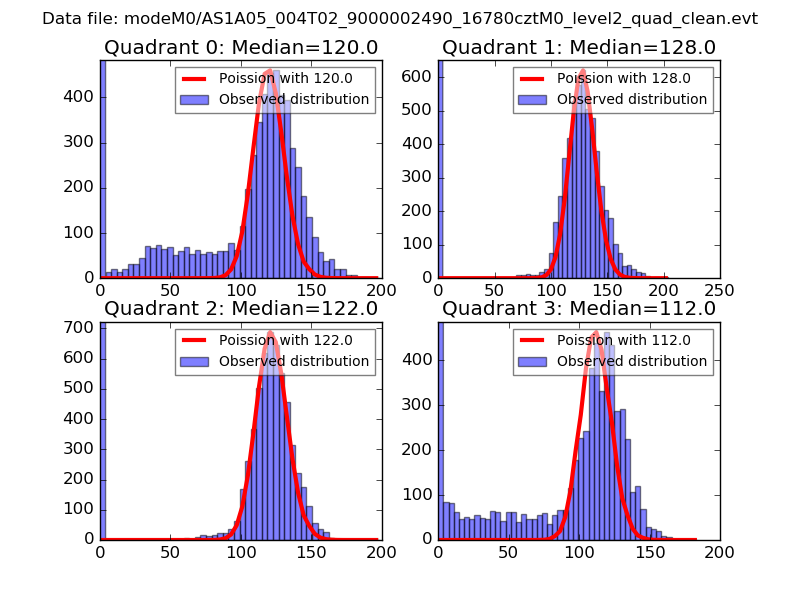 |
 |
| Quadrant-wise count rates Data is divided into 100 sec bins |
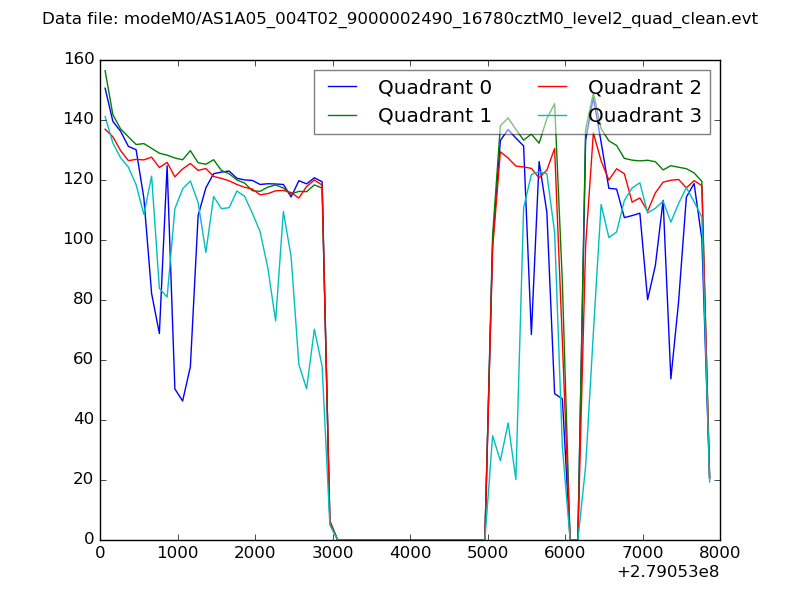 |
|
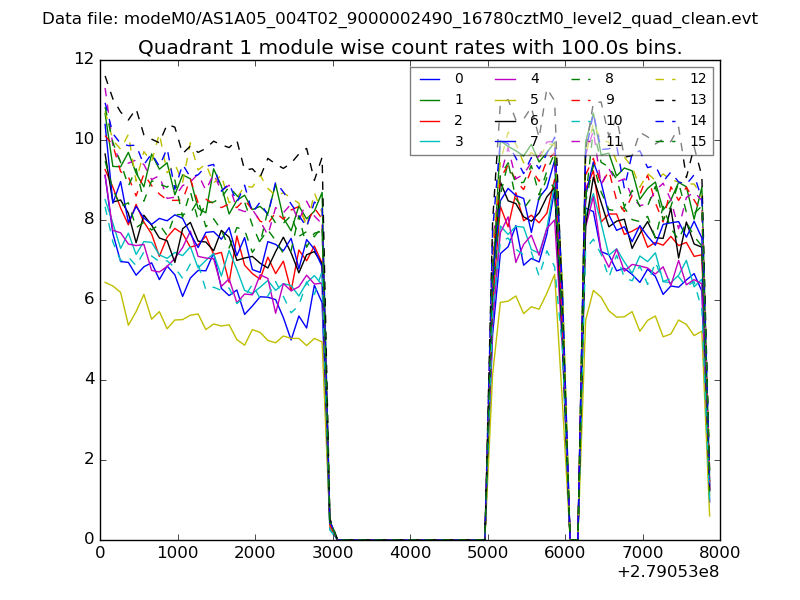
| Module-wise count rates for Quadrant A Data is divided into 100 sec bins |
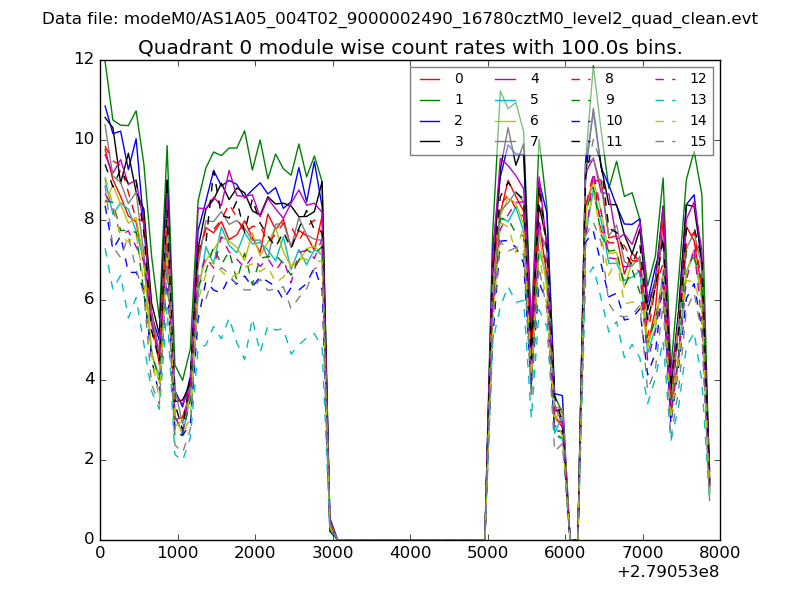 |
 |
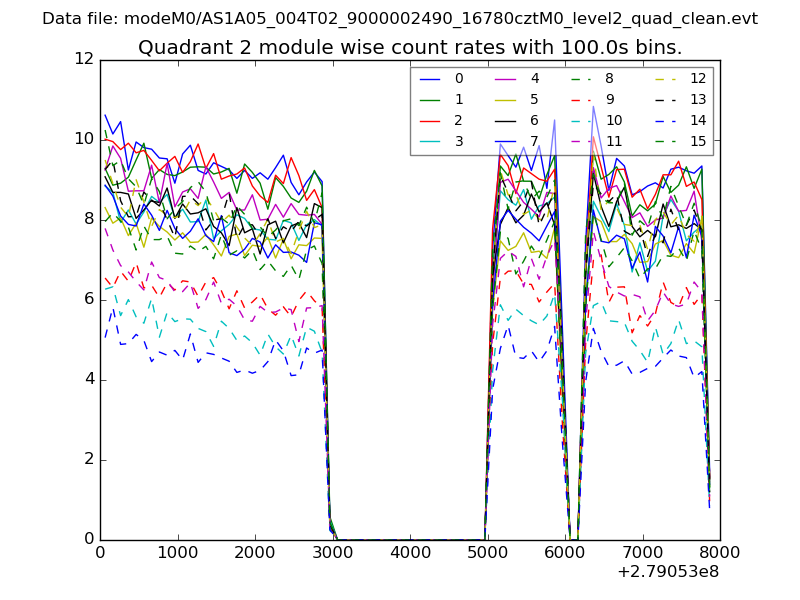
| Module-wise count rates for Quadrant B Data is divided into 100 sec bins |
 |
 |
| Module-wise count rates for Quadrant C Data is divided into 100 sec bins |
 |
 |
| Module-wise count rates for Quadrant D Data is divided into 100 sec bins |
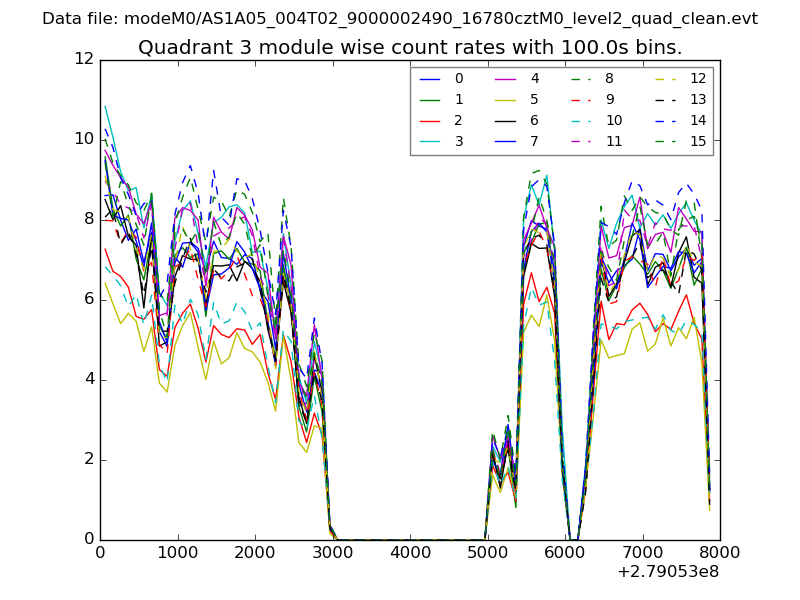 |
 |
| Parameter | Plot |
|---|---|
| CZT HV Monitor | 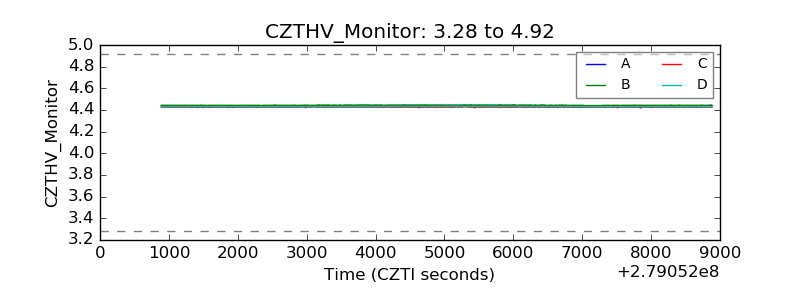 |
| D_VDD | 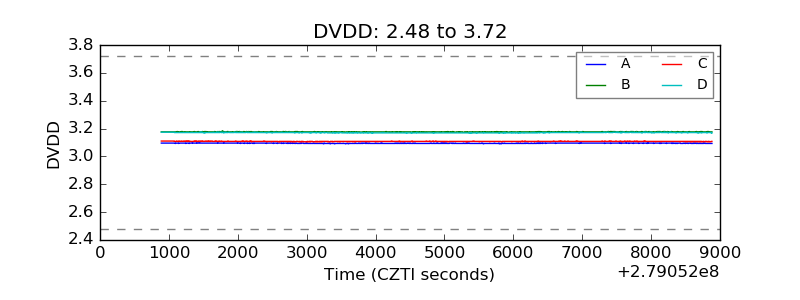 |
| Temperature 1 | 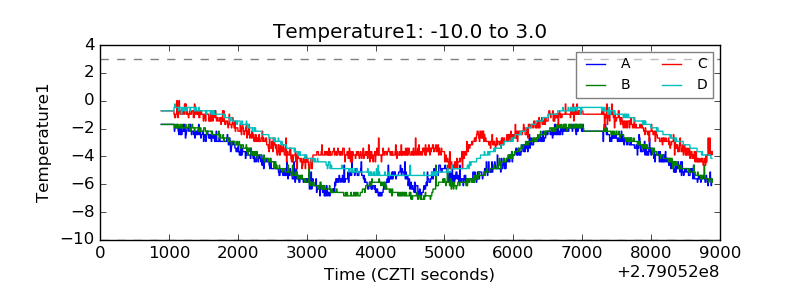 |
| Veto HV Monitor | 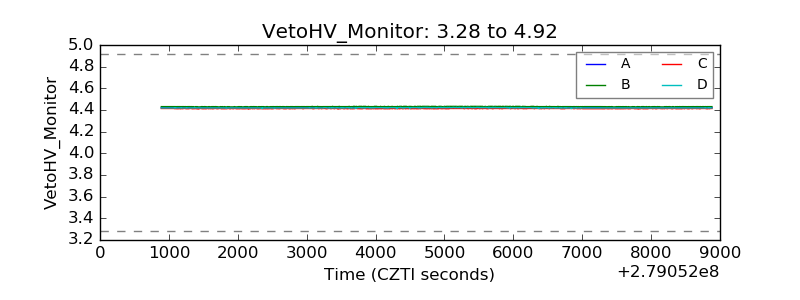 |
| Veto LLD | 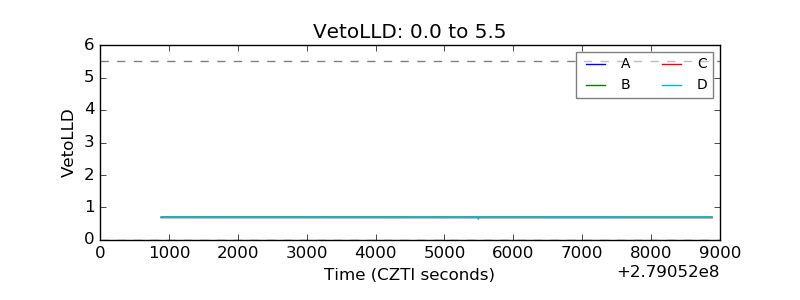 |
| Alpha Counter | 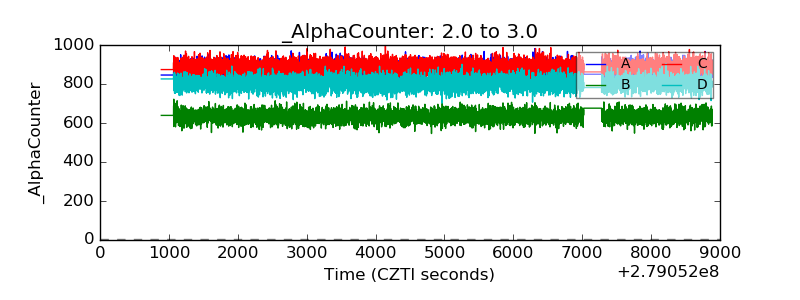 |
| _CPM_Rate | 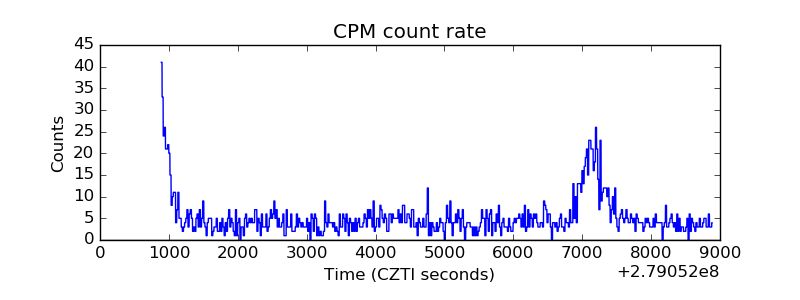 |
| CZT Counter | 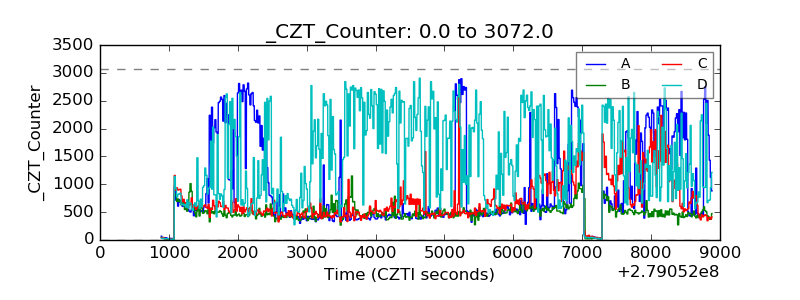 |
| +2.5 Volts monitor |  |
| +5 Volts monitor |  |
| _ROLL_ROT | 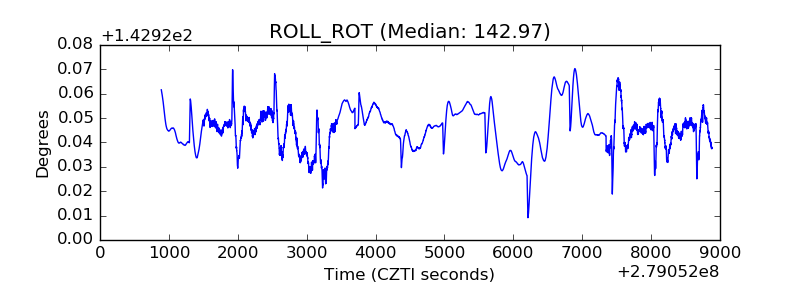 |
| _Roll_DEC | 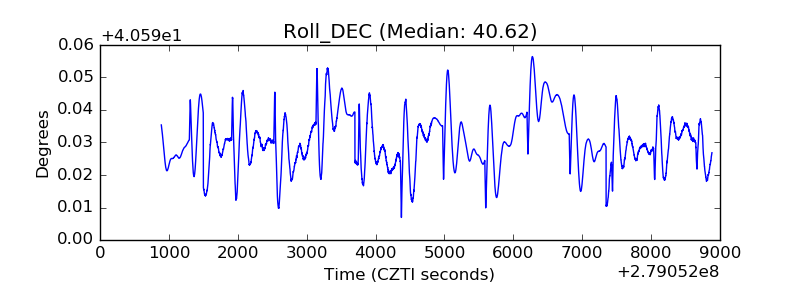 |
| _Roll_RA | 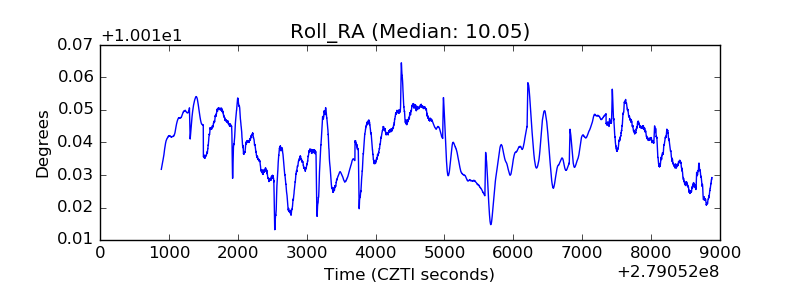 |
| Veto Counter | 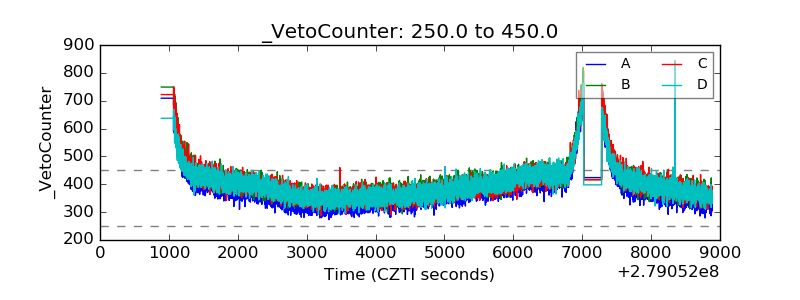 |