| Param | Original file | Final file |
|---|---|---|
| Filename | modeM0/AS1A05_004T02_9000002490_16781cztM0_level2.evt | modeM0/AS1A05_004T02_9000002490_16781cztM0_level2_quad_clean.evt |
| Size (bytes) | 727,018,560 | 98,216,640 |
| Size | 693.3 MB | 93.7 MB |
| Events in quadrant A | 5,891,865 | 602,440 |
| Events in quadrant B | 3,586,159 | 647,843 |
| Events in quadrant C | 4,176,484 | 625,617 |
| Events in quadrant D | 7,873,981 | 593,300 |
| Mode M0 | |||
|---|---|---|---|
| Quadrant | BADHDUFLAG | Total packets | Discarded packets |
| A | 0 | 22478 | 2 |
| B | 0 | 15396 | 1 |
| C | 0 | 17351 | 1 |
| D | 0 | 28483 | 1 |
| Mode SS | |||
|---|---|---|---|
| Quadrant | BADHDUFLAG | Total packets | Discarded packets |
| A | 0 | 148 | 0 |
| B | 0 | 148 | 0 |
| C | 0 | 148 | 0 |
| D | 0 | 148 | 0 |
| Mode M9 | |||
|---|---|---|---|
| Quadrant | BADHDUFLAG | Total packets | Discarded packets |
| A | 0 | 2 | 0 |
| B | 0 | 2 | 0 |
| C | 0 | 2 | 0 |
| D | 0 | 2 | 0 |
| Quadrant | Total seconds | Saturated seconds | Saturation percentage |
|---|---|---|---|
| A | 7243 | 784 | 10.824244% |
| B | 7243 | 63 | 0.869805% |
| C | 7243 | 209 | 2.885545% |
| D | 7243 | 702 | 9.692117% |
Noise dominated data is calculated using 1-second bins in cleaned event files. If a bin has >2000 counts, and if more than 50% of those come from <1% of pixels, then it is considered to be noise-dominated and hence unusable.
| Quadrant | # 1 sec bins | Bins with >0 counts | Bins with >2000 counts | High rate bins dominated by noise | Noise dominated (total time) | Noise dominated (detector-on time) | Marked lightcurve |
|---|---|---|---|---|---|---|---|
| A | 7524 | 7245 | 546 | 546 | 7.26% | 7.54% | 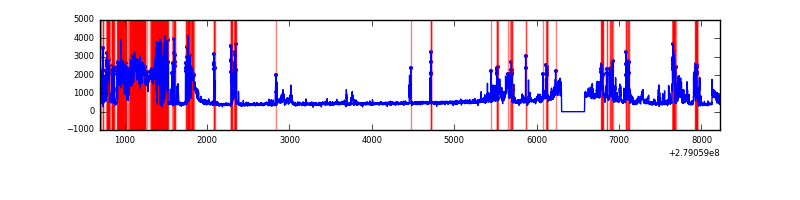 |
| B | 7524 | 7245 | 2 | 2 | 0.03% | 0.03% | 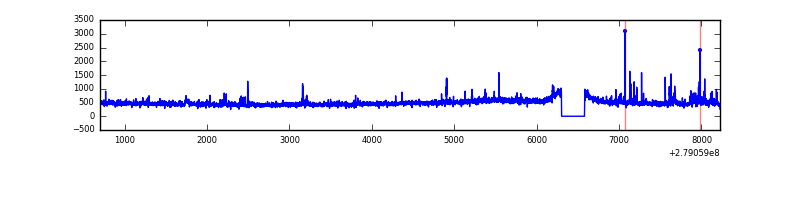 |
| C | 7524 | 7245 | 41 | 41 | 0.54% | 0.57% | 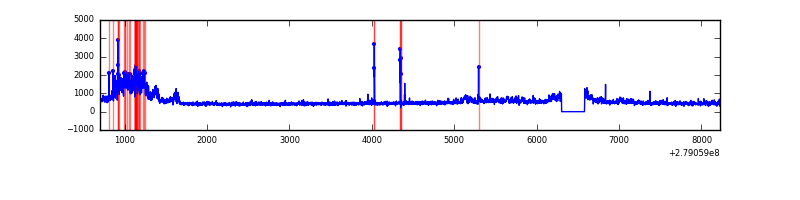 |
| D | 7524 | 7245 | 684 | 684 | 9.09% | 9.44% | 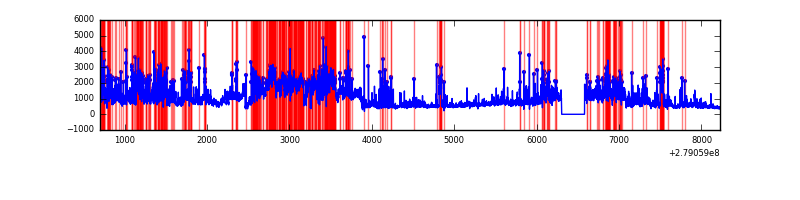 |
Top three noisy pixels from each quadrant. If the there are fewer than three noisy pixels in the level2.evt file, extra rows are filled as -1
| Pixel properties | Quadrant properties | ||||||
|---|---|---|---|---|---|---|---|
| Quadrant | DetID | PixID | Counts | Sigma | Mean | Median | Sigma |
| A | 15 | 174 | 2676607 | 15980.76 | 830 | 810 | 167.4 |
| A | 15 | 190 | 12693 | 70.97 | 830 | 810 | 167.4 |
| A | 0 | 226 | 7255 | 38.49 | 830 | 810 | 167.4 |
| B | 0 | 229 | 64201 | 383.94 | 859 | 834 | 165.0 |
| B | 15 | 35 | 48674 | 289.86 | 859 | 834 | 165.0 |
| B | 0 | 189 | 37849 | 224.27 | 859 | 834 | 165.0 |
| C | 3 | 233 | 742924 | 3816.52 | 829 | 833 | 194.4 |
| C | 14 | 238 | 125868 | 643.05 | 829 | 833 | 194.4 |
| C | 0 | 207 | 75369 | 383.33 | 829 | 833 | 194.4 |
| D | 1 | 52 | 4154238 | 20531.82 | 823 | 798 | 202.3 |
| D | 12 | 218 | 244633 | 1205.36 | 823 | 798 | 202.3 |
| D | 11 | 176 | 196890 | 969.35 | 823 | 798 | 202.3 |
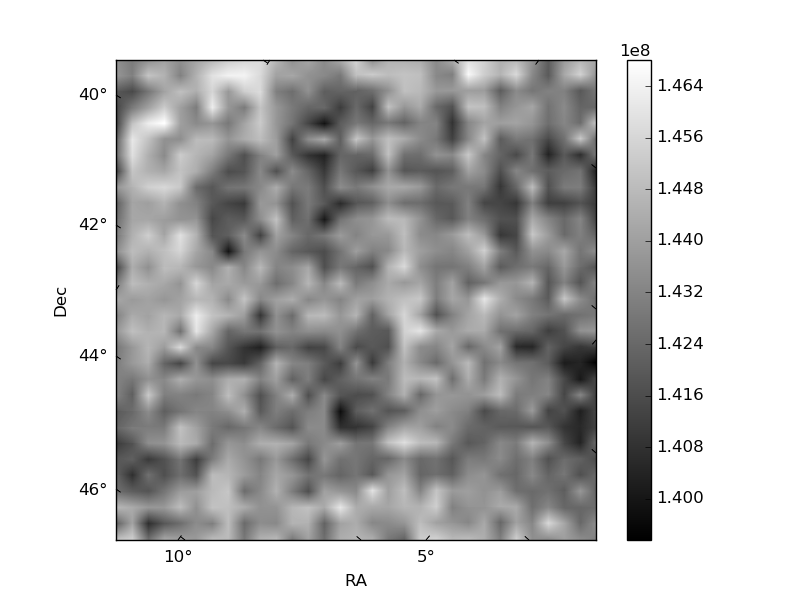
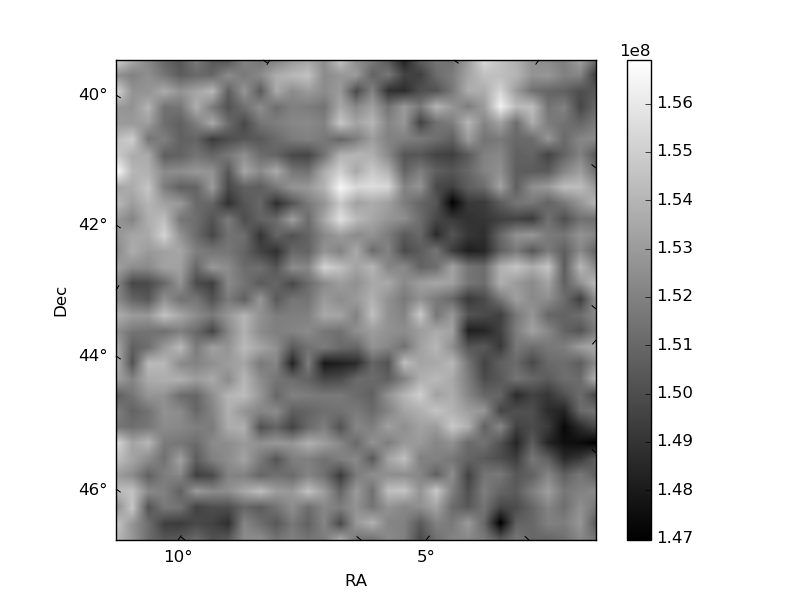
Histogram calculated using DETX and DETY for each event in the final _common_clean file
| Quadrant A | 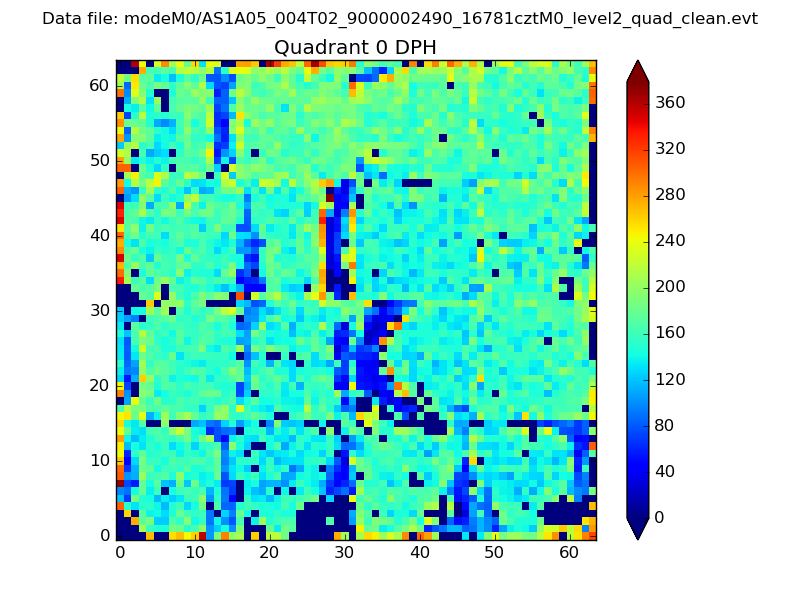 |
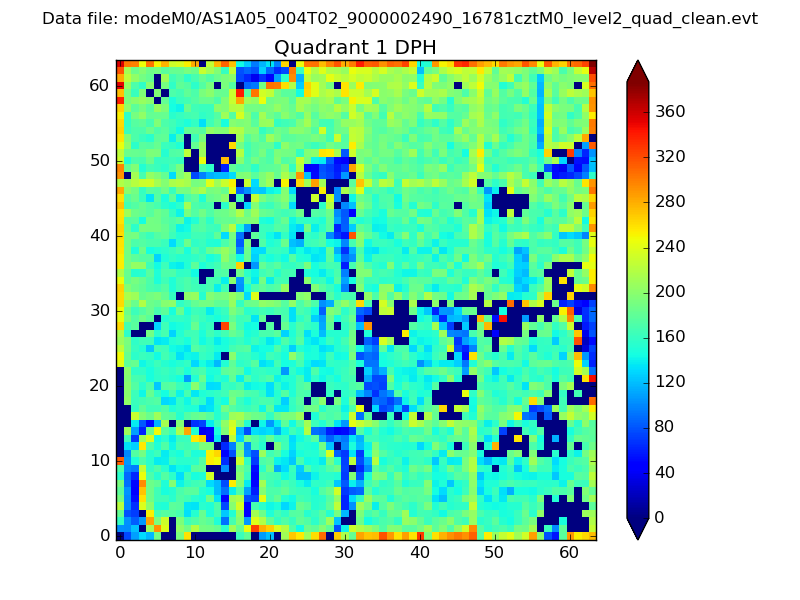 |
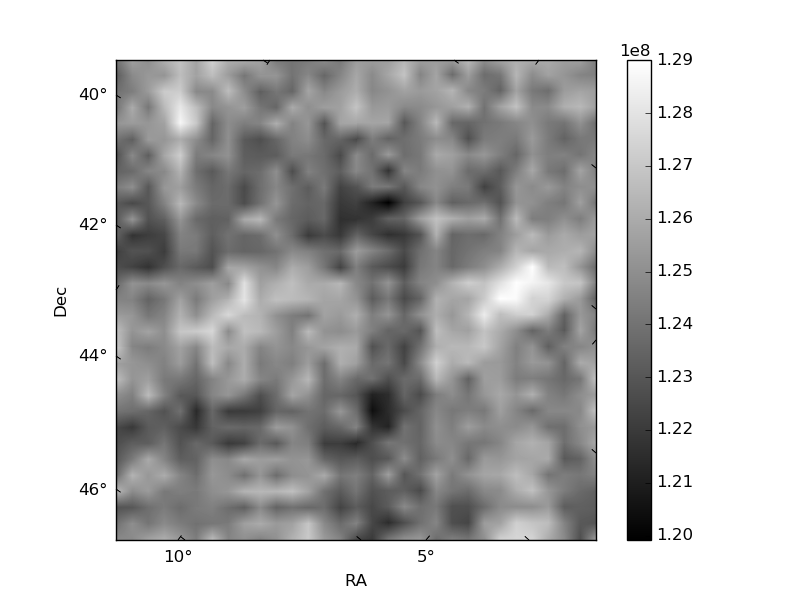
Quadrant B |
|---|---|---|---|
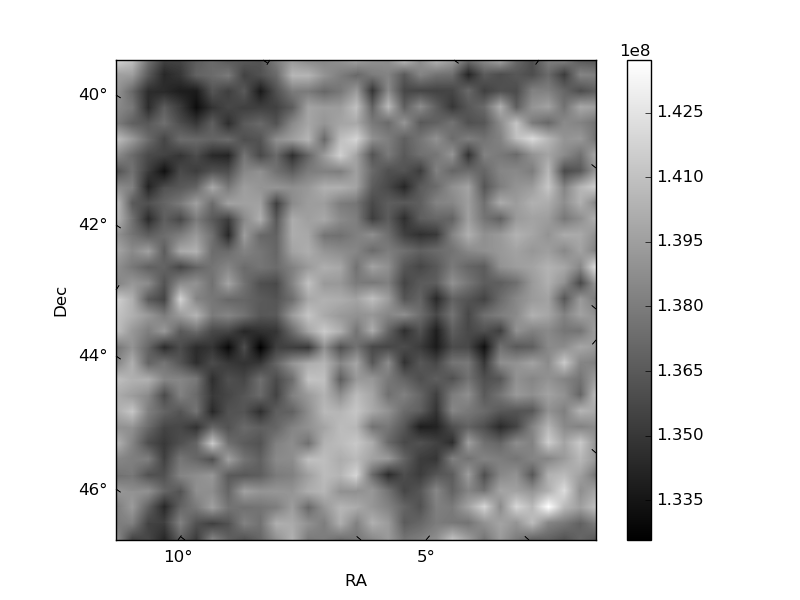
| Quadrant D | 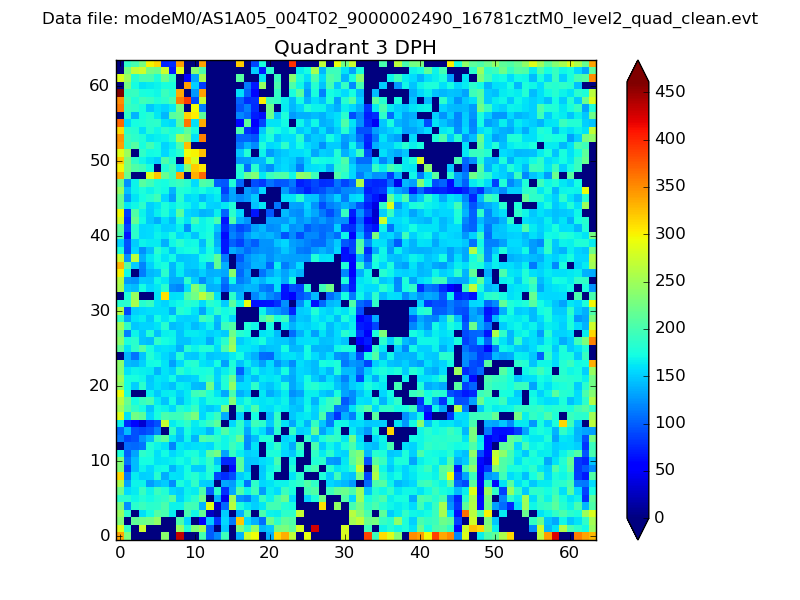 |
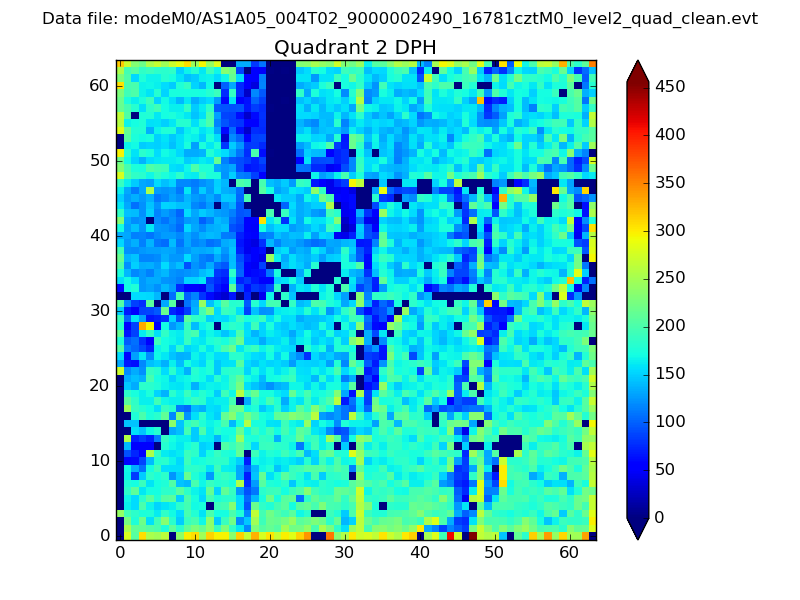 |
Quadrant C |
| Plot type | Count rate plots | Images |
|---|---|---|
| Comparison with Poisson distribution Blue bars denote a histogram of data divided into 1 sec bins. Red curve is a Poisson curve with rate = median count rate of data. |
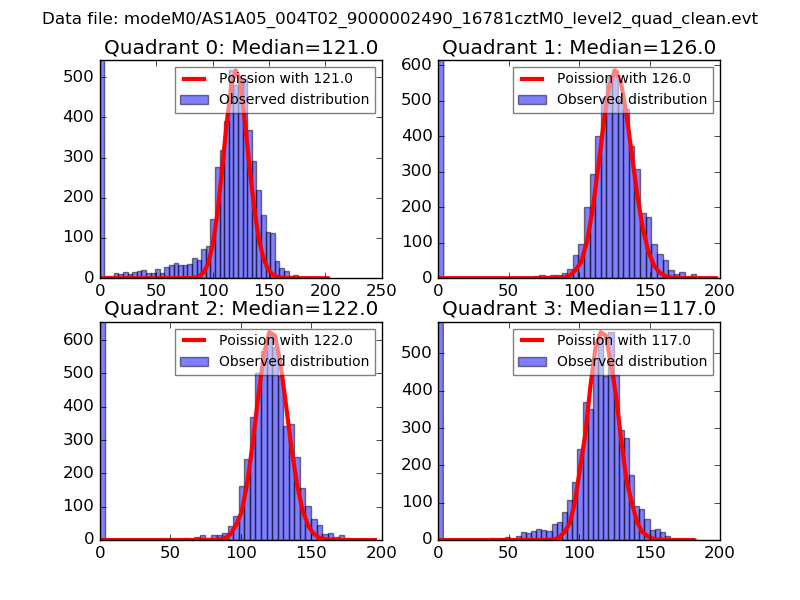 |
 |
| Quadrant-wise count rates Data is divided into 100 sec bins |
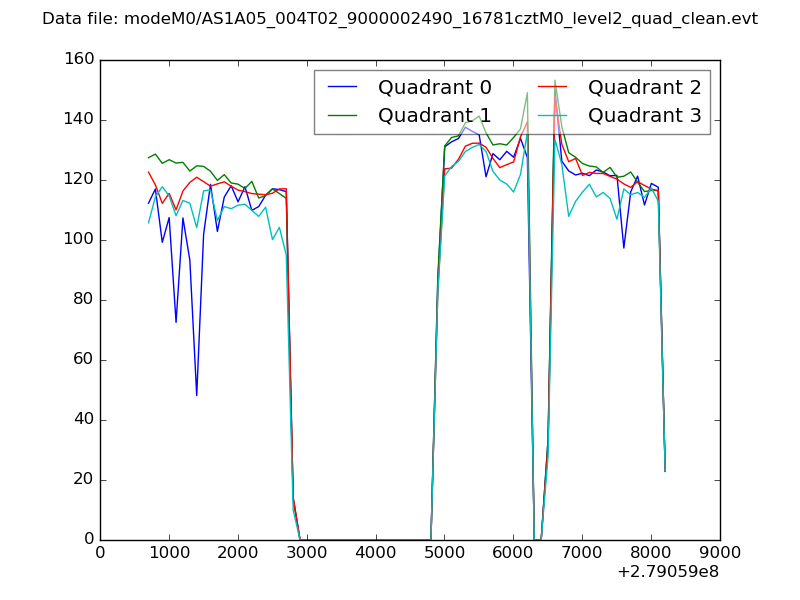 |
|
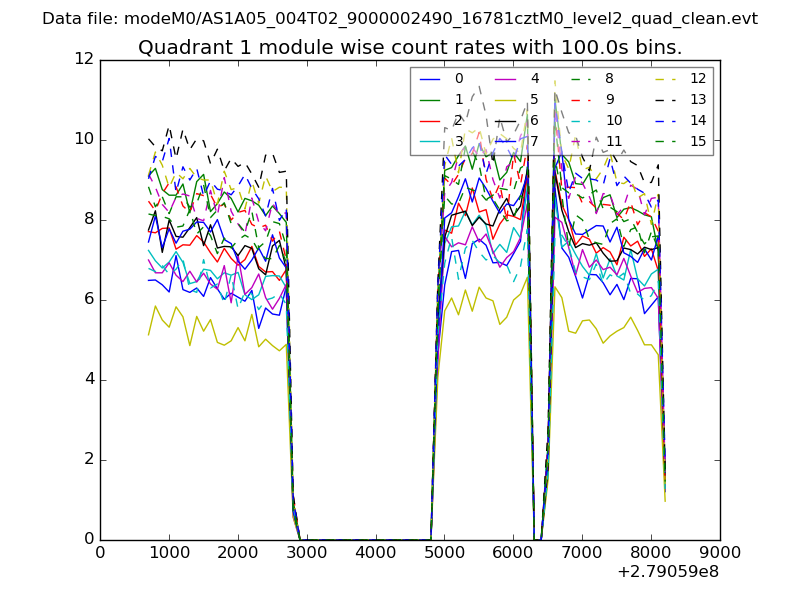
| Module-wise count rates for Quadrant A Data is divided into 100 sec bins |
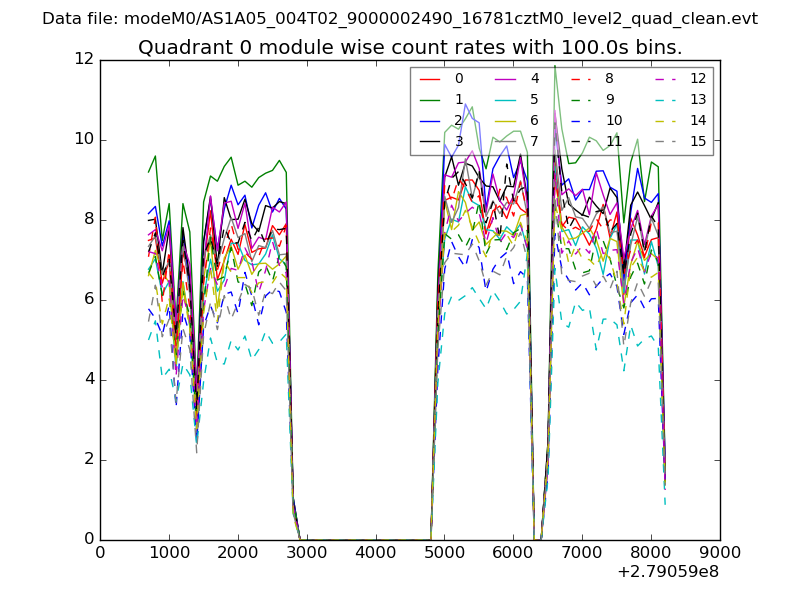 |
 |
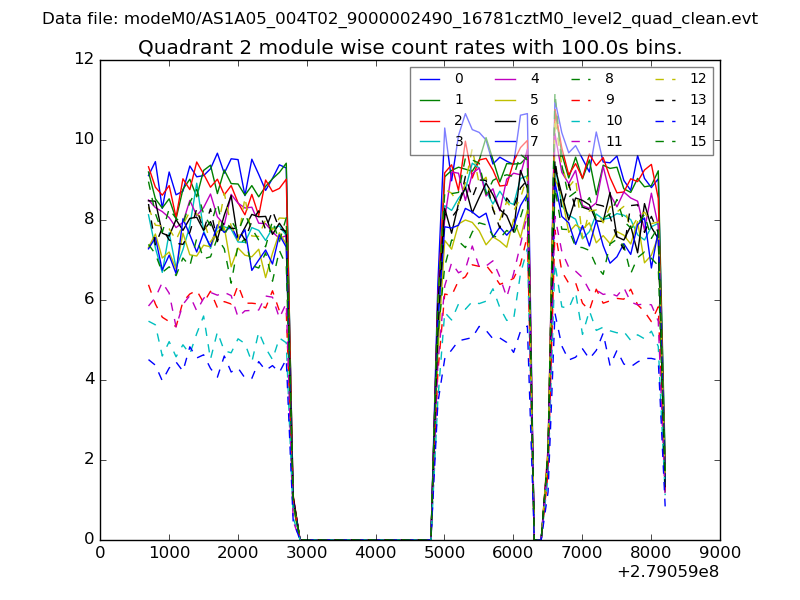
| Module-wise count rates for Quadrant B Data is divided into 100 sec bins |
 |
 |
| Module-wise count rates for Quadrant C Data is divided into 100 sec bins |
 |
 |
| Module-wise count rates for Quadrant D Data is divided into 100 sec bins |
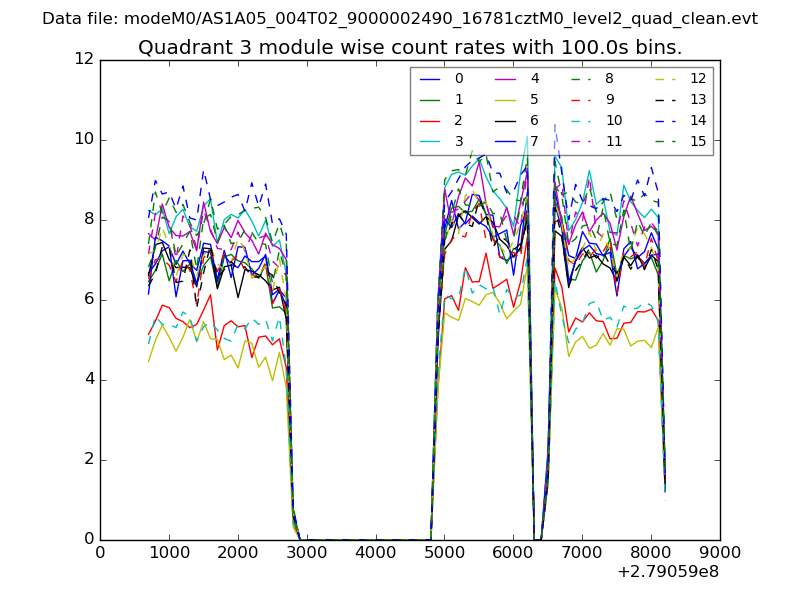 |
 |
| Parameter | Plot |
|---|---|
| CZT HV Monitor | 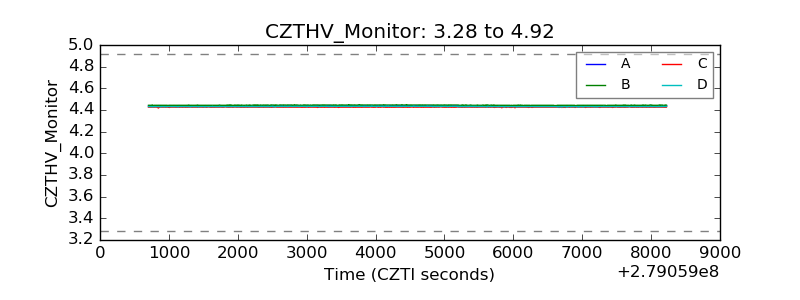 |
| D_VDD | 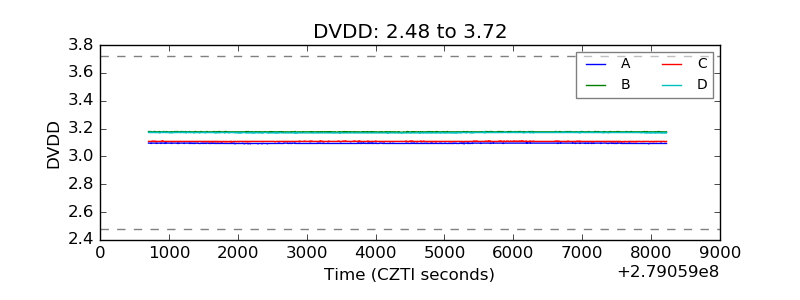 |
| Temperature 1 | 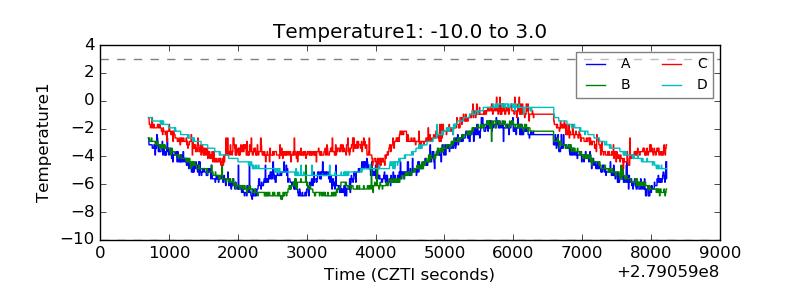 |
| Veto HV Monitor | 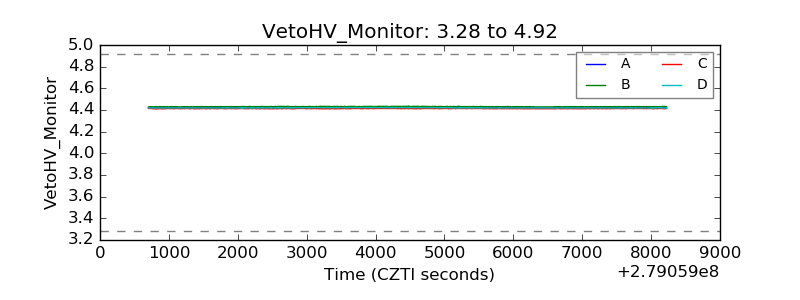 |
| Veto LLD | 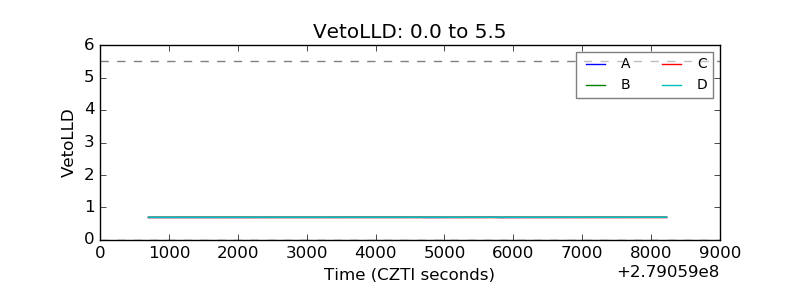 |
| Alpha Counter | 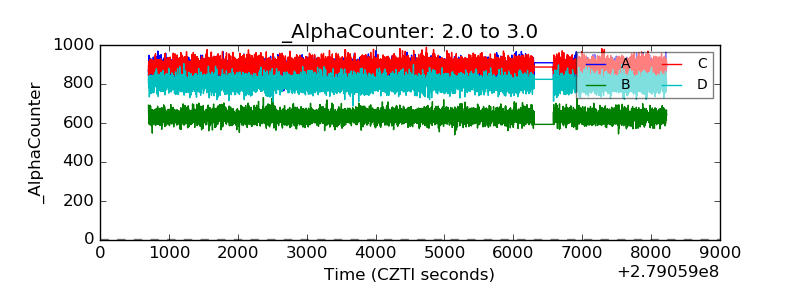 |
| _CPM_Rate |  |
| CZT Counter |  |
| +2.5 Volts monitor |  |
| +5 Volts monitor |  |
| _ROLL_ROT | 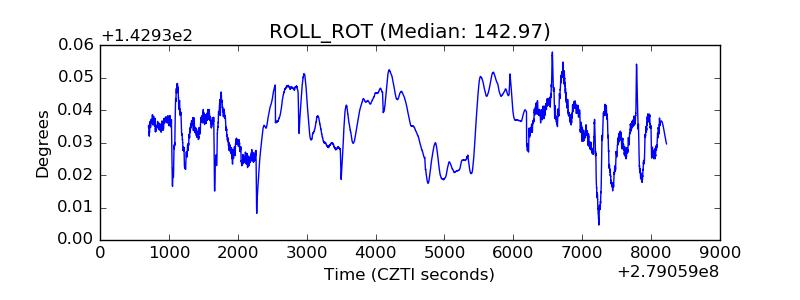 |
| _Roll_DEC | 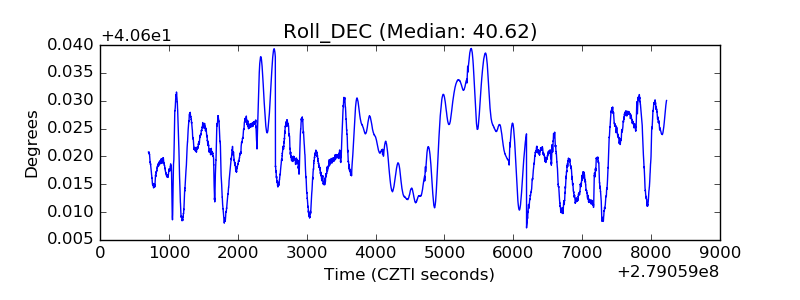 |
| _Roll_RA |  |
| Veto Counter | 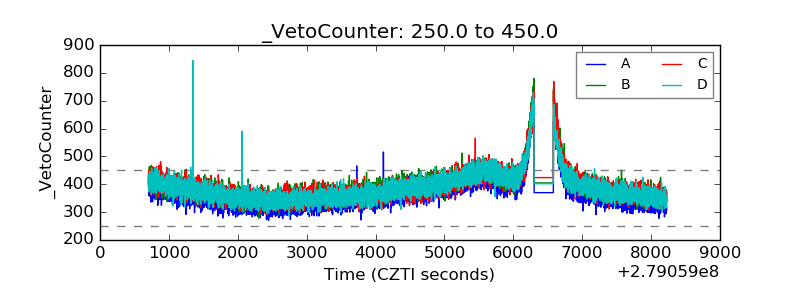 |