| Param | Original file | Final file |
|---|---|---|
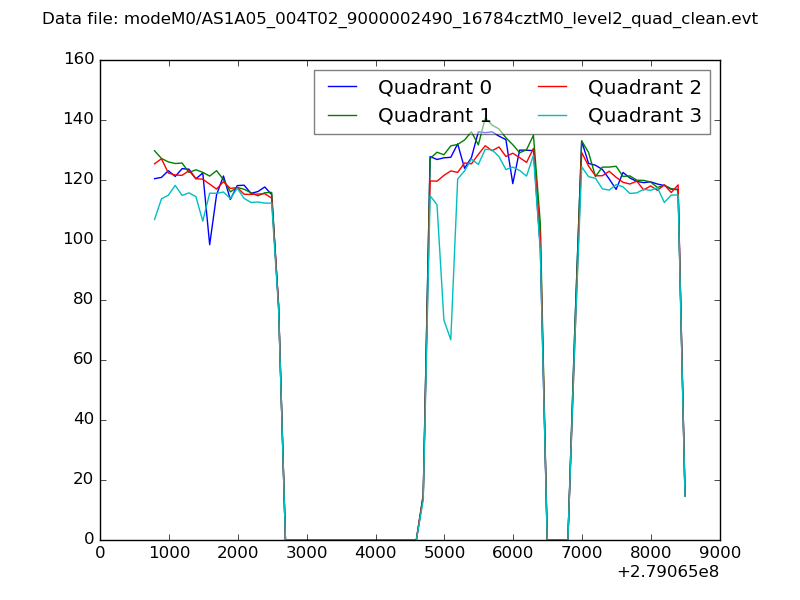
| Filename | modeM0/AS1A05_004T02_9000002490_16784cztM0_level2.evt | modeM0/AS1A05_004T02_9000002490_16784cztM0_level2_quad_clean.evt |
| Size (bytes) | 618,652,800 | 99,141,120 |
| Size | 590.0 MB | 94.5 MB |
| Events in quadrant A | 4,732,628 | 629,391 |
| Events in quadrant B | 3,682,876 | 641,624 |
| Events in quadrant C | 3,812,322 | 624,097 |
| Events in quadrant D | 6,009,614 | 594,560 |
| Mode M0 | |||
|---|---|---|---|
| Quadrant | BADHDUFLAG | Total packets | Discarded packets |
| A | 0 | 19065 | 1 |
| B | 0 | 15859 | 1 |
| C | 0 | 16125 | 1 |
| D | 0 | 23051 | 1 |
| Mode SS | |||
|---|---|---|---|
| Quadrant | BADHDUFLAG | Total packets | Discarded packets |
| A | 0 | 148 | 0 |
| B | 0 | 148 | 0 |
| C | 0 | 148 | 0 |
| D | 0 | 148 | 0 |
| Mode M9 | |||
|---|---|---|---|
| Quadrant | BADHDUFLAG | Total packets | Discarded packets |
| A | 0 | 5 | 0 |
| B | 0 | 5 | 0 |
| C | 0 | 5 | 0 |
| D | 0 | 5 | 0 |
| Quadrant | Total seconds | Saturated seconds | Saturation percentage |
|---|---|---|---|
| A | 7368 | 205 | 2.782302% |
| B | 7368 | 66 | 0.895765% |
| C | 7368 | 95 | 1.289359% |
| D | 7368 | 381 | 5.171010% |
Noise dominated data is calculated using 1-second bins in cleaned event files. If a bin has >2000 counts, and if more than 50% of those come from <1% of pixels, then it is considered to be noise-dominated and hence unusable.
| Quadrant | # 1 sec bins | Bins with >0 counts | Bins with >2000 counts | High rate bins dominated by noise | Noise dominated (total time) | Noise dominated (detector-on time) | Marked lightcurve |
|---|---|---|---|---|---|---|---|
| A | 7849 | 7370 | 111 | 111 | 1.41% | 1.51% | 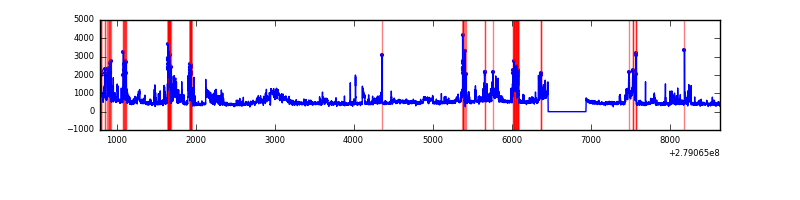 |
| B | 7849 | 7370 | 12 | 12 | 0.15% | 0.16% | 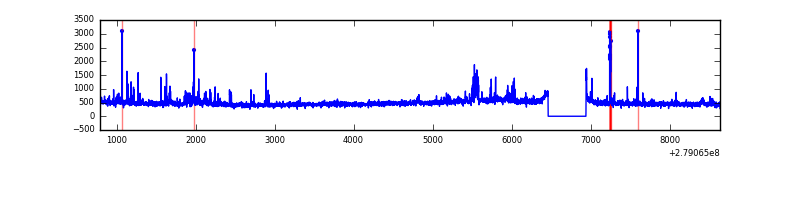 |
| C | 7849 | 7370 | 9 | 9 | 0.11% | 0.12% | 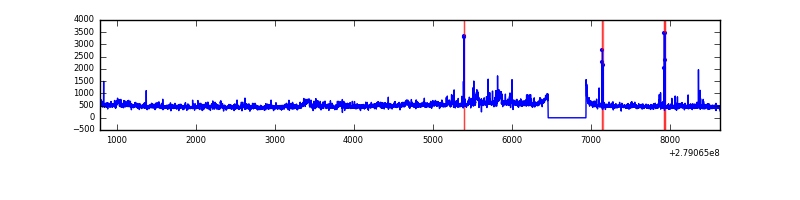 |
| D | 7849 | 7370 | 289 | 289 | 3.68% | 3.92% | 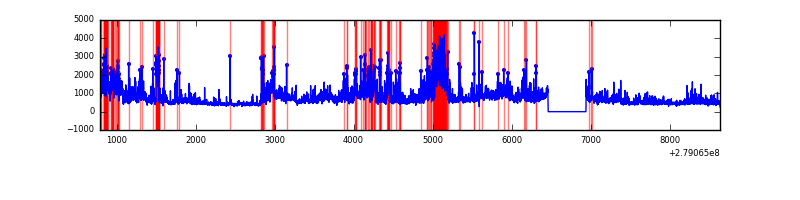 |
Top three noisy pixels from each quadrant. If the there are fewer than three noisy pixels in the level2.evt file, extra rows are filled as -1
| Pixel properties | Quadrant properties | ||||||
|---|---|---|---|---|---|---|---|
| Quadrant | DetID | PixID | Counts | Sigma | Mean | Median | Sigma |
| A | 15 | 174 | 1454996 | 8435.69 | 852 | 833 | 172.4 |
| A | 0 | 226 | 7484 | 38.58 | 852 | 833 | 172.4 |
| A | 12 | 194 | 6244 | 31.39 | 852 | 833 | 172.4 |
| B | 15 | 35 | 131131 | 793.67 | 859 | 837 | 164.2 |
| B | 0 | 229 | 89225 | 538.41 | 859 | 837 | 164.2 |
| B | 0 | 189 | 34022 | 202.14 | 859 | 837 | 164.2 |
| C | 3 | 233 | 341547 | 1733.52 | 833 | 839 | 196.5 |
| C | 14 | 238 | 127617 | 645.05 | 833 | 839 | 196.5 |
| C | 0 | 207 | 91540 | 461.49 | 833 | 839 | 196.5 |
| D | 1 | 52 | 2554971 | 12506.2 | 827 | 800 | 204.2 |
| D | 11 | 176 | 131534 | 640.12 | 827 | 800 | 204.2 |
| D | 12 | 218 | 75870 | 367.57 | 827 | 800 | 204.2 |
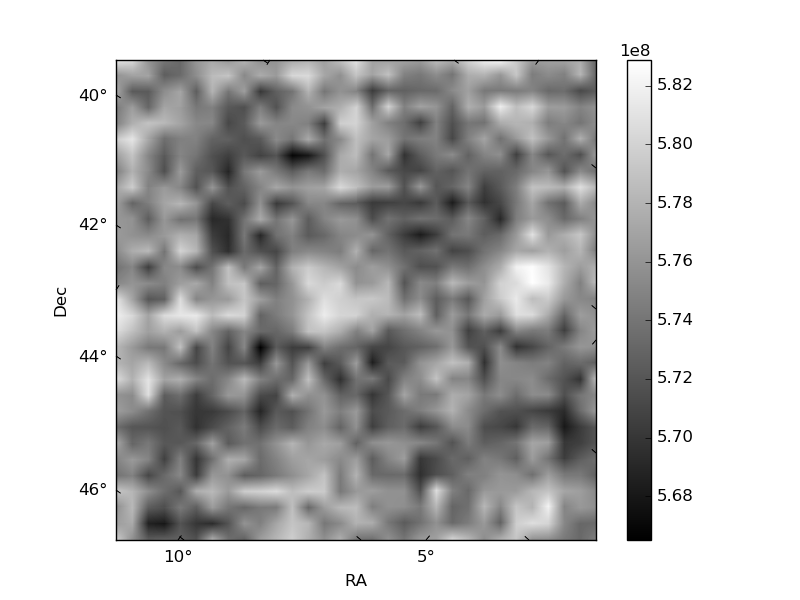
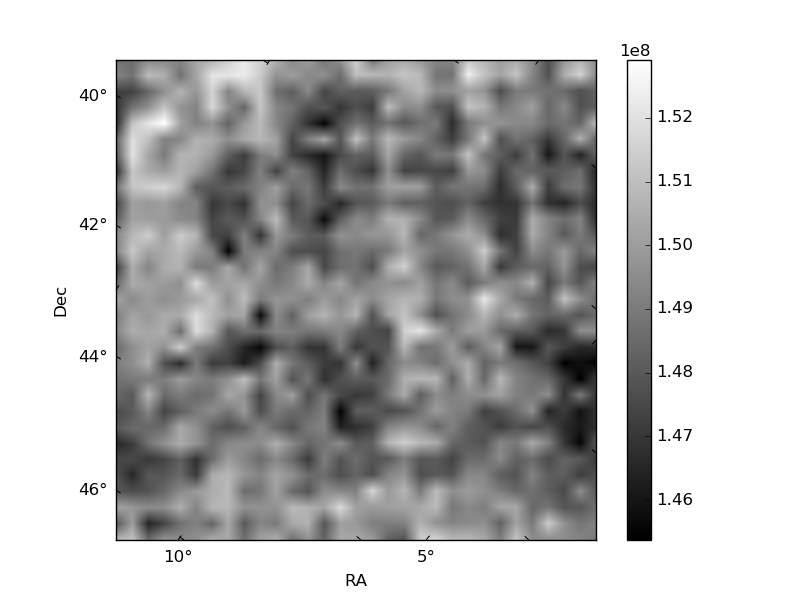
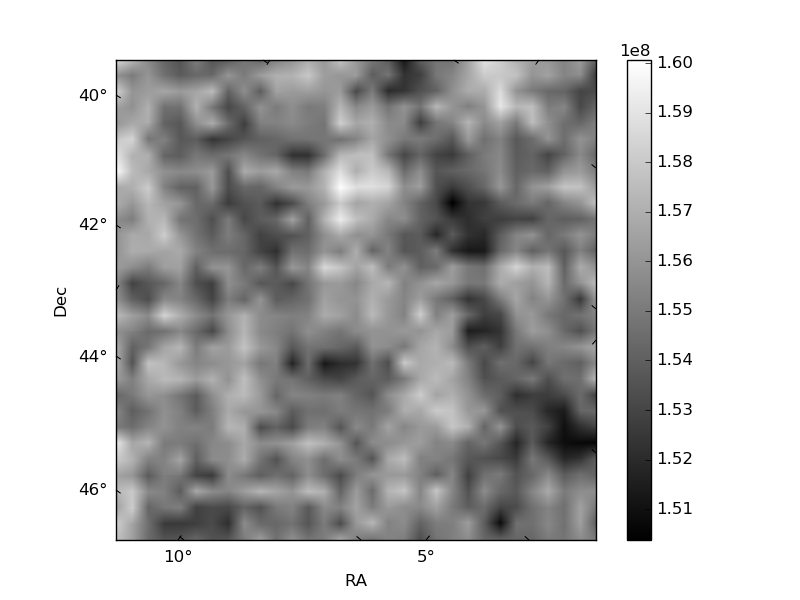
Histogram calculated using DETX and DETY for each event in the final _common_clean file
| Quadrant A | 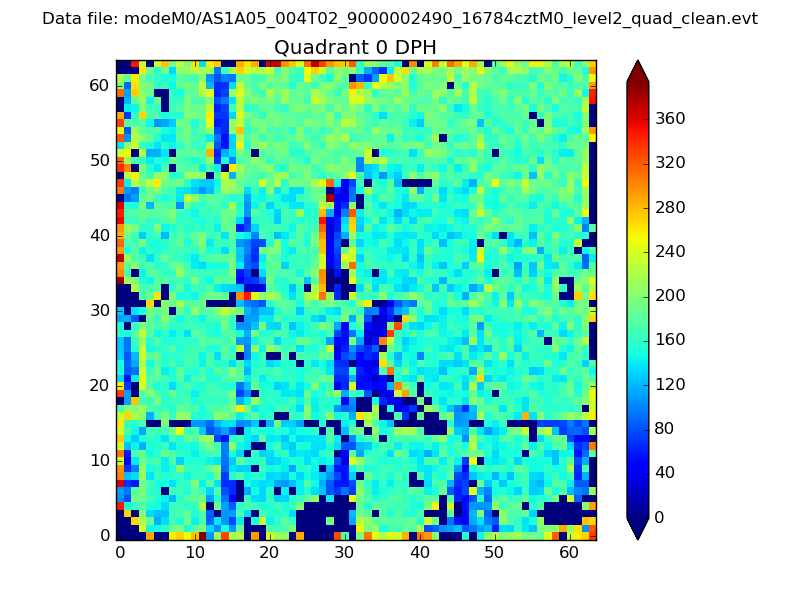 |
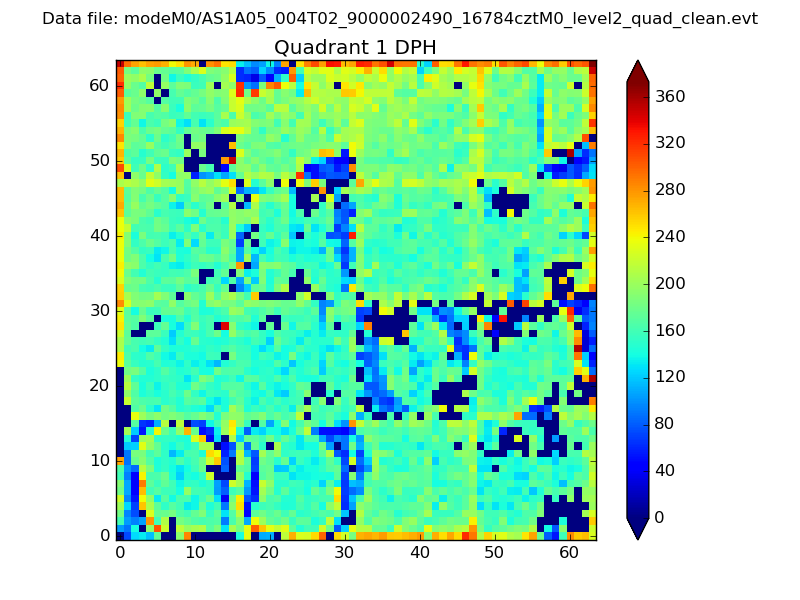 |
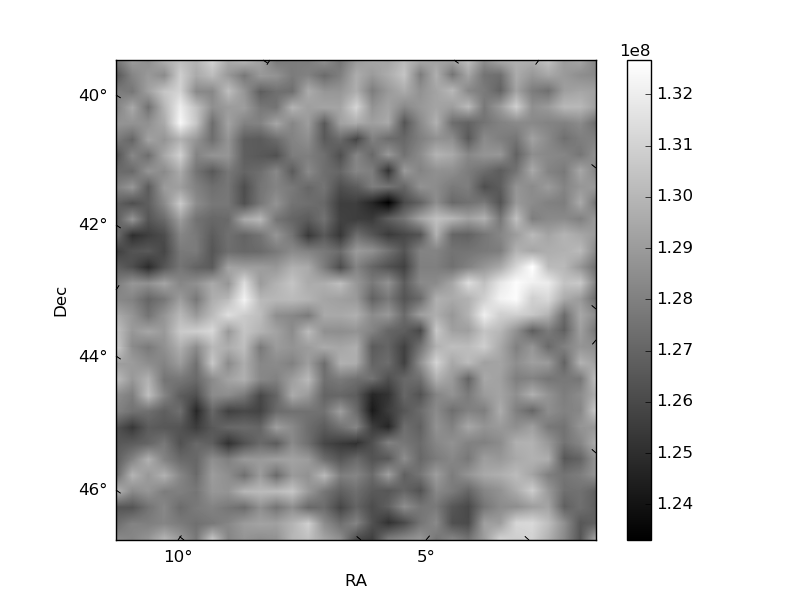
Quadrant B |
|---|---|---|---|
| Quadrant D | 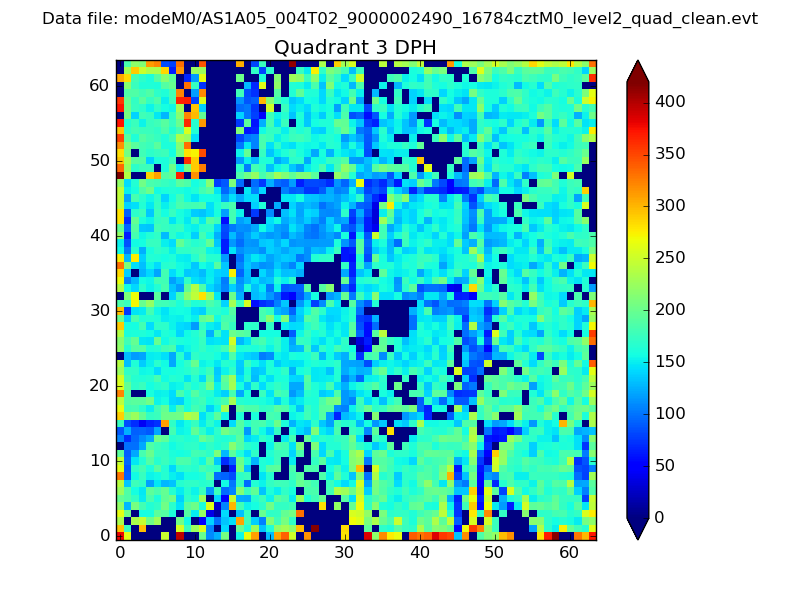 |
 |
Quadrant C |
| Plot type | Count rate plots | Images |
|---|---|---|
| Comparison with Poisson distribution Blue bars denote a histogram of data divided into 1 sec bins. Red curve is a Poisson curve with rate = median count rate of data. |
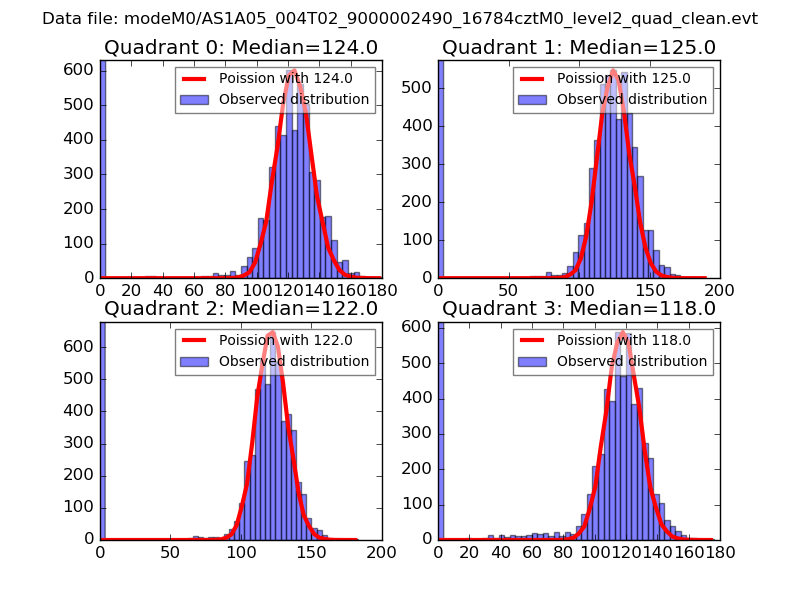 |
 |
| Quadrant-wise count rates Data is divided into 100 sec bins |
 |
|
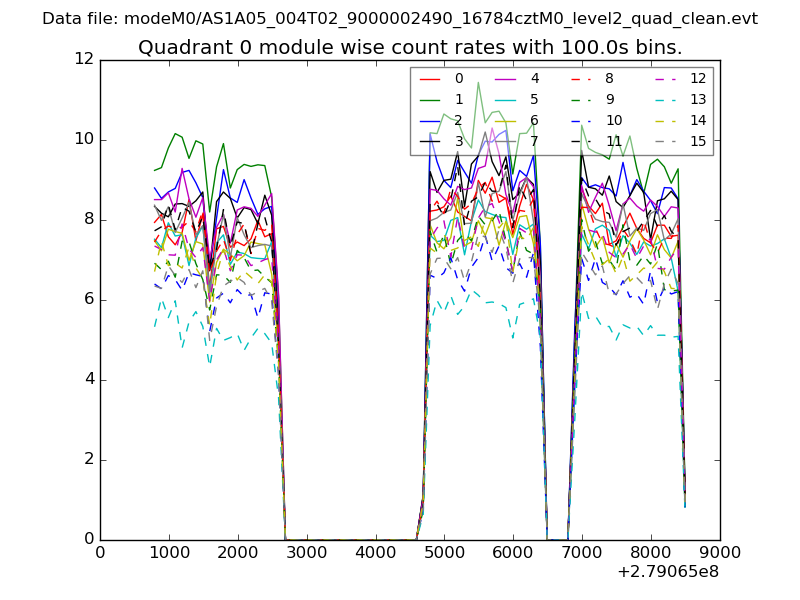
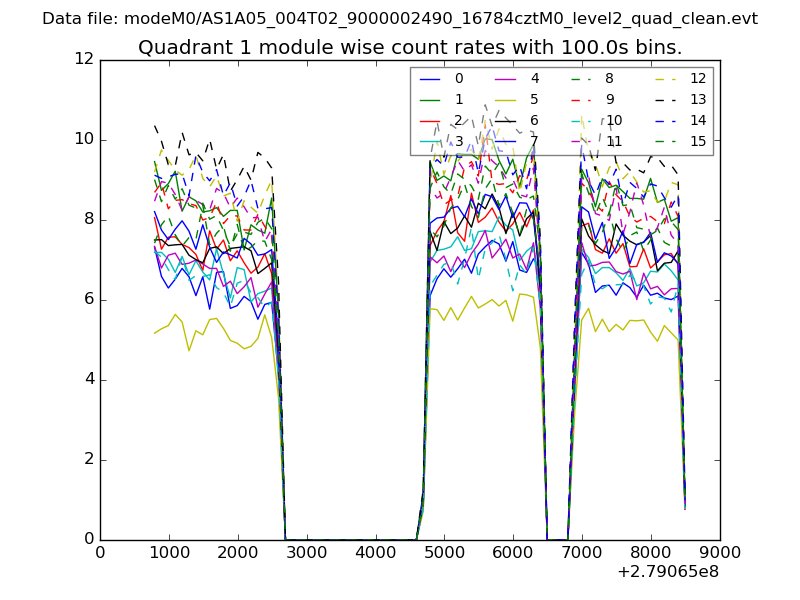
| Module-wise count rates for Quadrant A Data is divided into 100 sec bins |
 |
 |
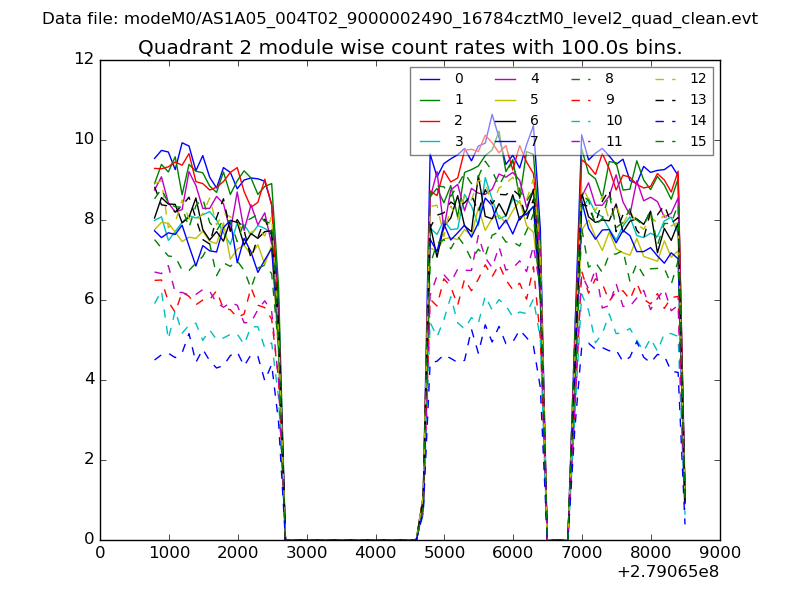
| Module-wise count rates for Quadrant B Data is divided into 100 sec bins |
 |
 |
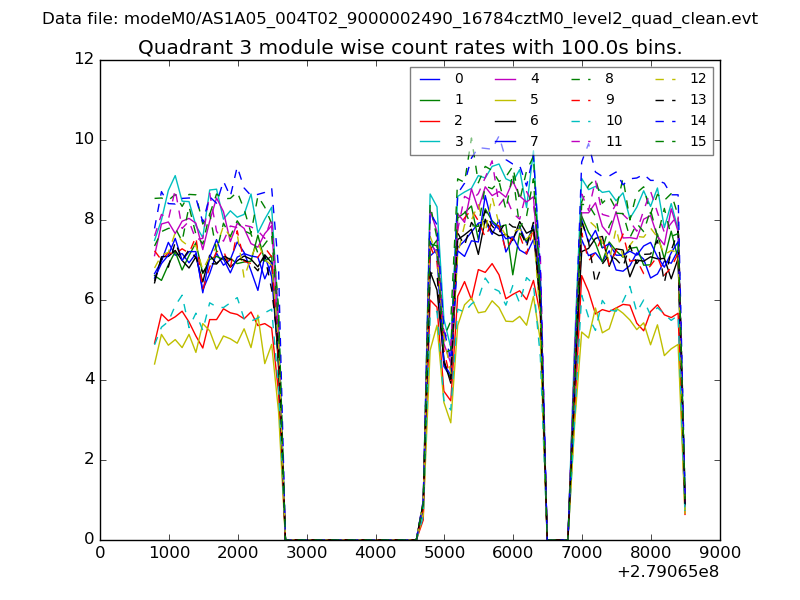
| Module-wise count rates for Quadrant C Data is divided into 100 sec bins |
 |
 |
| Module-wise count rates for Quadrant D Data is divided into 100 sec bins |
 |
 |
| Parameter | Plot |
|---|---|
| CZT HV Monitor | 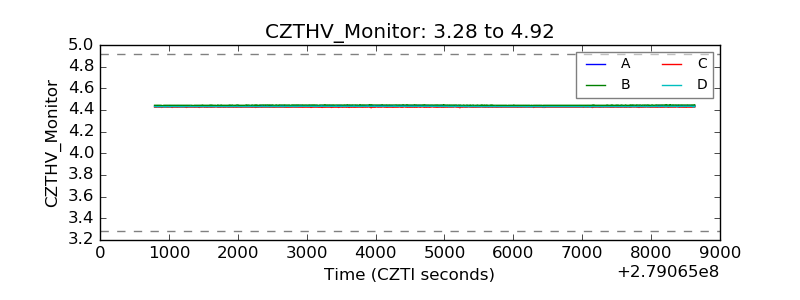 |
| D_VDD | 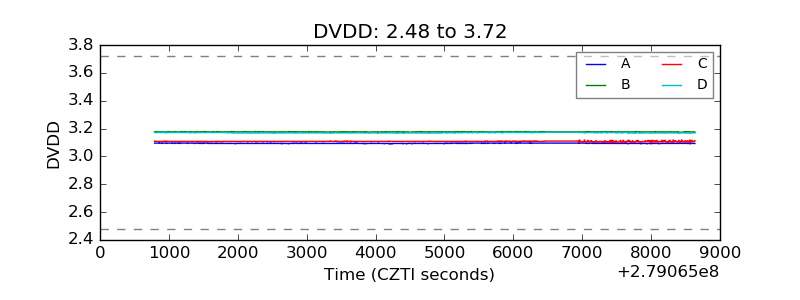 |
| Temperature 1 | 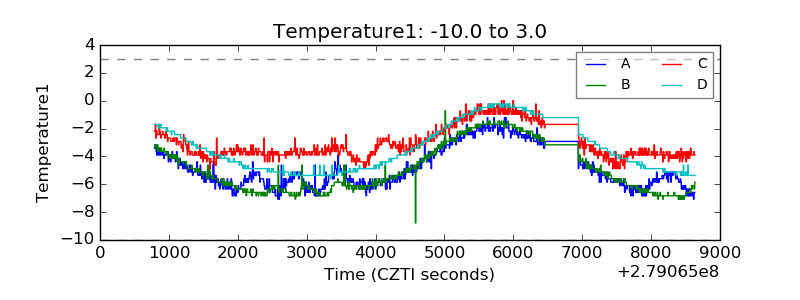 |
| Veto HV Monitor | 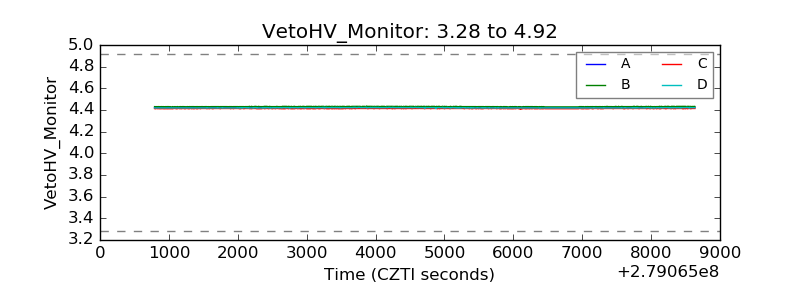 |
| Veto LLD | 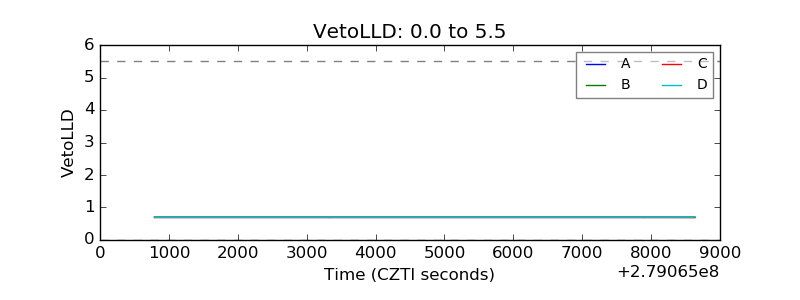 |
| Alpha Counter | 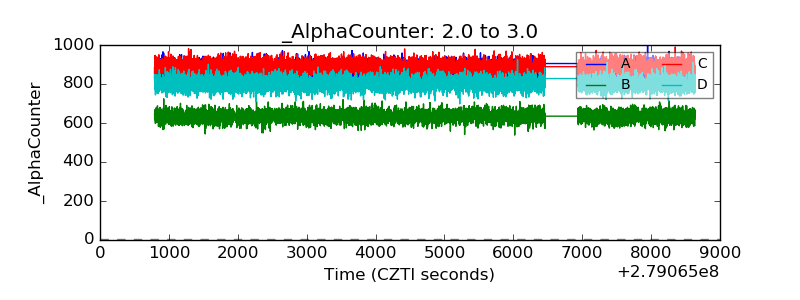 |
| _CPM_Rate | 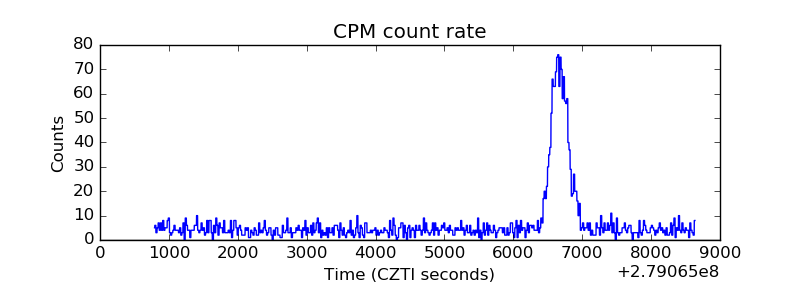 |
| CZT Counter |  |
| +2.5 Volts monitor |  |
| +5 Volts monitor |  |
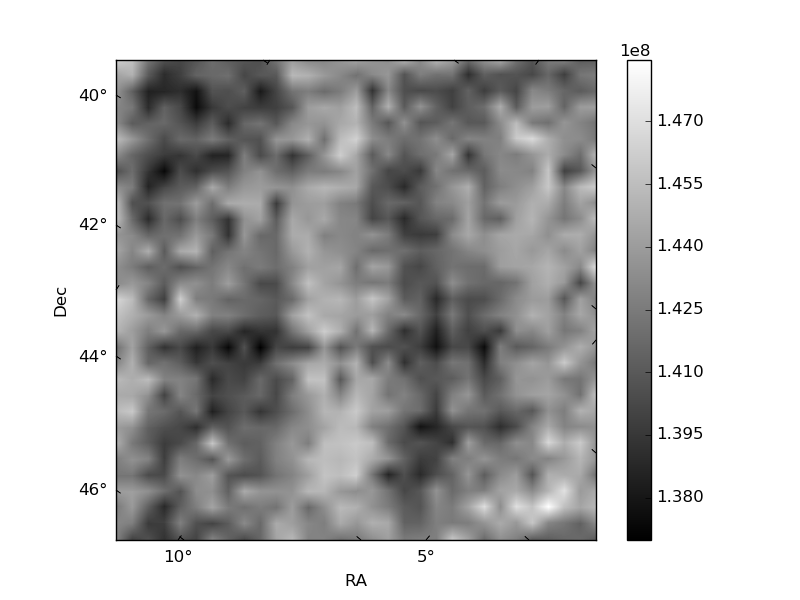
| _ROLL_ROT | 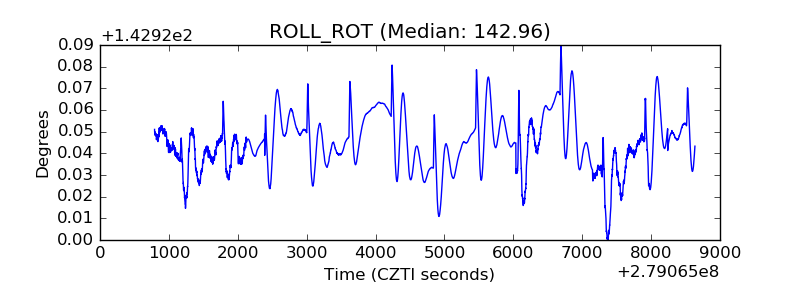 |
| _Roll_DEC | 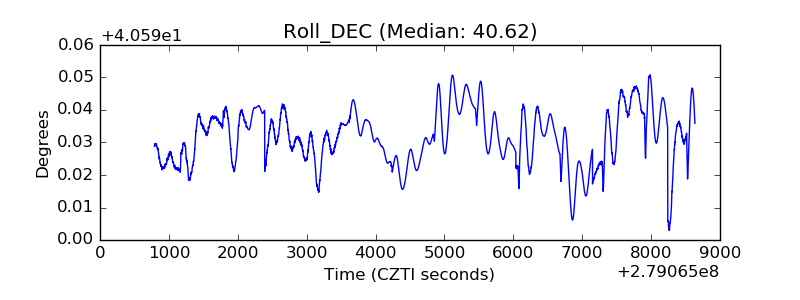 |
| _Roll_RA | 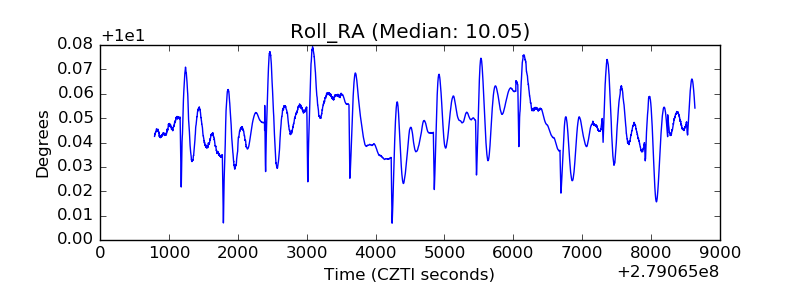 |
| Veto Counter | 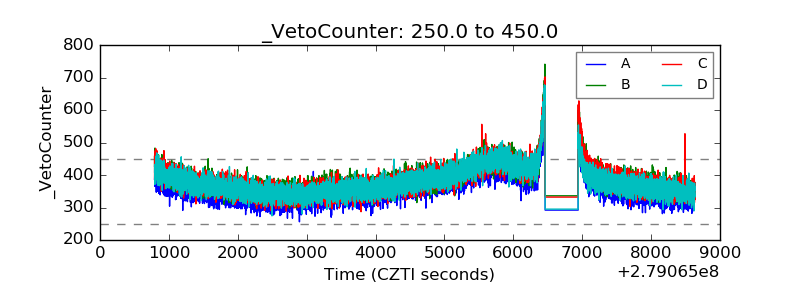 |