| Param | Original file | Final file |
|---|---|---|
| Filename | modeM0/AS1A05_004T04_9000002494cztM0_level2.fits | modeM0/AS1A05_004T04_9000002494cztM0_level2_quad_clean.evt |
| Size (bytes) | 632,626,560 | 589,642,560 |
| Size | 603.3 MB | 562.3 MB |
| Events in quadrant A | 3,823,314 | 3,381,518 |
| Events in quadrant B | 3,782,574 | 3,577,510 |
| Events in quadrant C | 3,818,698 | 3,409,300 |
| Events in quadrant D | 3,248,910 | 3,006,134 |
| Mode M9 | |||
|---|---|---|---|
| Quadrant | BADHDUFLAG | Total packets | Discarded packets |
| A | 0 | 108 | 0 |
| B | 0 | 108 | 0 |
| C | 0 | 108 | 0 |
| D | 0 | 108 | 0 |
| Mode M0 | |||
|---|---|---|---|
| Quadrant | BADHDUFLAG | Total packets | Discarded packets |
| A | 0 | 183352 | 0 |
| B | 0 | 144770 | 0 |
| C | 0 | 151750 | 0 |
| D | 0 | 193519 | 0 |
| Mode SS | |||
|---|---|---|---|
| Quadrant | BADHDUFLAG | Total packets | Discarded packets |
| A | 0 | 1326 | 0 |
| B | 0 | 1326 | 0 |
| C | 0 | 1326 | 0 |
| D | 0 | 1326 | 0 |
| Quadrant | Total seconds | Saturated seconds | Saturation percentage |
|---|---|---|---|
| A | 65355 | 5380 | 8.231964% |
| B | 65355 | 1156 | 1.768801% |
| C | 65355 | 1274 | 1.949354% |
| D | 65355 | 4902 | 7.500574% |
Noise dominated data is calculated using 1-second bins in cleaned event files. If a bin has >2000 counts, and if more than 50% of those come from <1% of pixels, then it is considered to be noise-dominated and hence unusable.
| Quadrant | # 1 sec bins | Bins with >0 counts | Bins with >2000 counts | High rate bins dominated by noise | Noise dominated (total time) | Noise dominated (detector-on time) | Marked lightcurve |
|---|---|---|---|---|---|---|---|
| A | 76080 | 65310 | 0 | 0 | 0.00% | 0.00% |  |
| B | 76080 | 65329 | 0 | 0 | 0.00% | 0.00% |  |
| C | 76080 | 65347 | 0 | 0 | 0.00% | 0.00% |  |
| D | 76079 | 65199 | 0 | 0 | 0.00% | 0.00% |  |
Top three noisy pixels from each quadrant. If the there are fewer than three noisy pixels in the level2.evt file, extra rows are filled as -1
| Pixel properties | Quadrant properties | ||||||
|---|---|---|---|---|---|---|---|
| Quadrant | DetID | PixID | Counts | Sigma | Mean | Median | Sigma |
| A | 0 | 29 | 3589 | 10.71 | 996 | 934 | 247.9 |
| A | 7 | 110 | 3095 | 8.72 | 996 | 934 | 247.9 |
| A | 0 | 30 | 2795 | 7.51 | 996 | 934 | 247.9 |
| B | 2 | 9 | 3109 | 11.01 | 999 | 955 | 195.6 |
| B | 2 | 8 | 2617 | 8.5 | 999 | 955 | 195.6 |
| B | 5 | 128 | 2526 | 8.03 | 999 | 955 | 195.6 |
| C | 1 | 80 | 2772 | 7.0 | 1008 | 940 | 261.7 |
| C | 1 | 81 | 2759 | 6.95 | 1008 | 940 | 261.7 |
| C | 12 | 241 | 2693 | 6.7 | 1008 | 940 | 261.7 |
| D | 3 | 14 | 2344 | 6.16 | 926 | 844 | 243.6 |
| D | 7 | 3 | 2292 | 5.94 | 926 | 844 | 243.6 |
| D | 10 | 189 | 2258 | 5.8 | 926 | 844 | 243.6 |
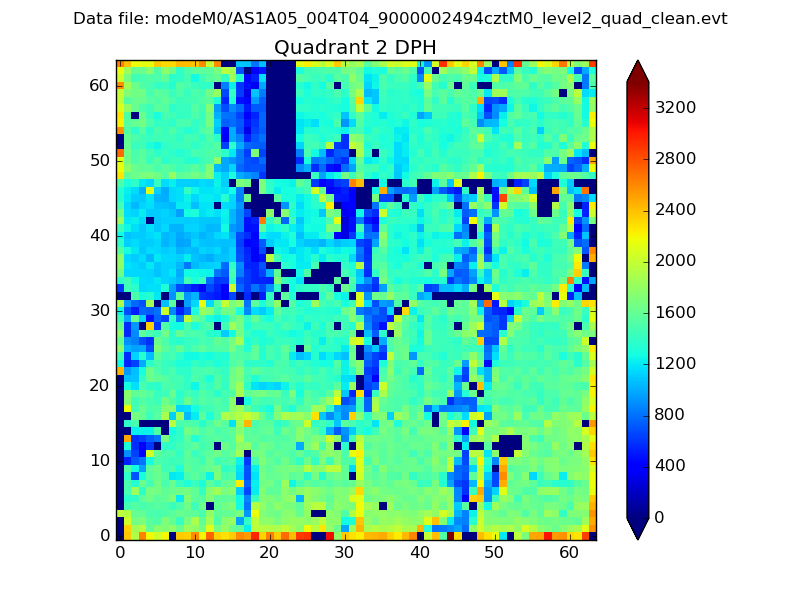
Histogram calculated using DETX and DETY for each event in the final _common_clean file
| Quadrant A | 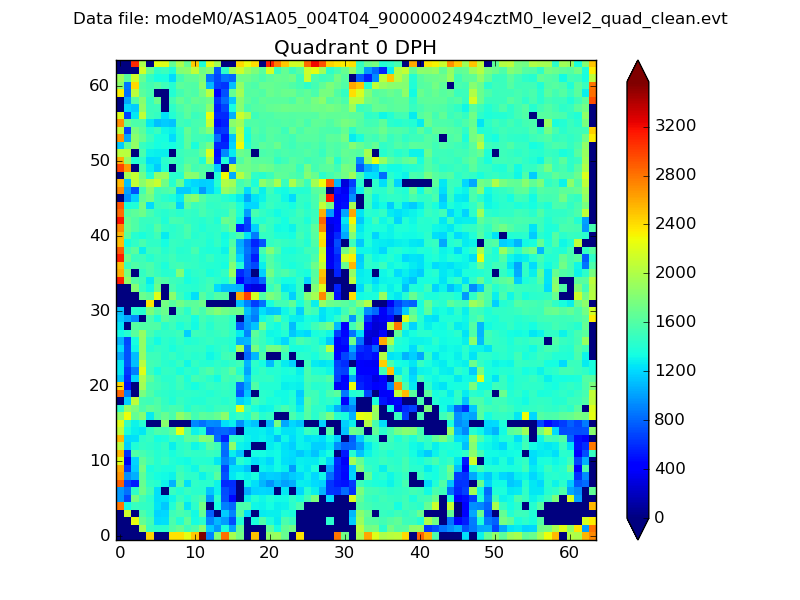 |
 |
Quadrant B |
|---|---|---|---|
| Quadrant D |  |
 |
Quadrant C |
| Plot type | Count rate plots | Images |
|---|---|---|
| Comparison with Poisson distribution Blue bars denote a histogram of data divided into 1 sec bins. Red curve is a Poisson curve with rate = median count rate of data. |
 |
 |
| Quadrant-wise count rates Data is divided into 100 sec bins |
 |
|
| Module-wise count rates for Quadrant A Data is divided into 100 sec bins |
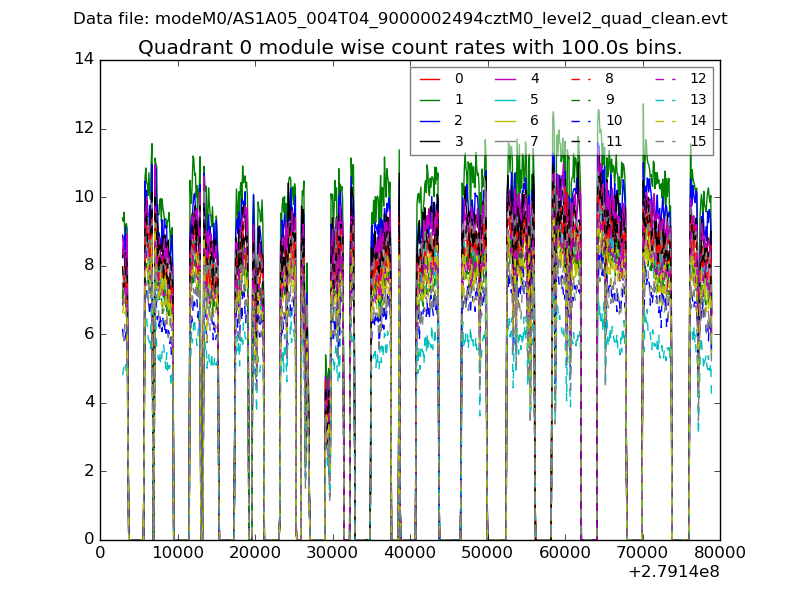 |
 |
| Module-wise count rates for Quadrant B Data is divided into 100 sec bins |
 |
 |
| Module-wise count rates for Quadrant C Data is divided into 100 sec bins |
 |
 |
| Module-wise count rates for Quadrant D Data is divided into 100 sec bins |
 |
 |
| Parameter | Plot |
|---|---|
| CZT HV Monitor |  |
| D_VDD |  |
| Temperature 1 |  |
| Veto HV Monitor | 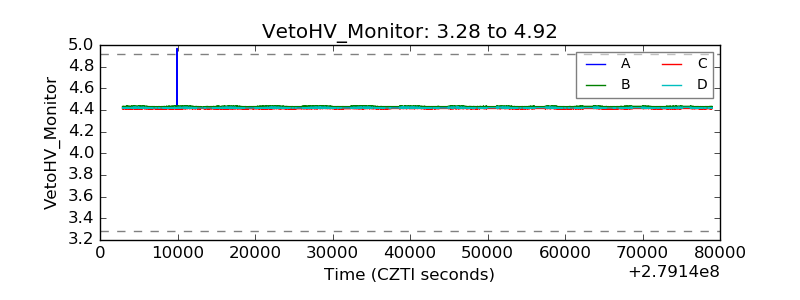 |
| Veto LLD | 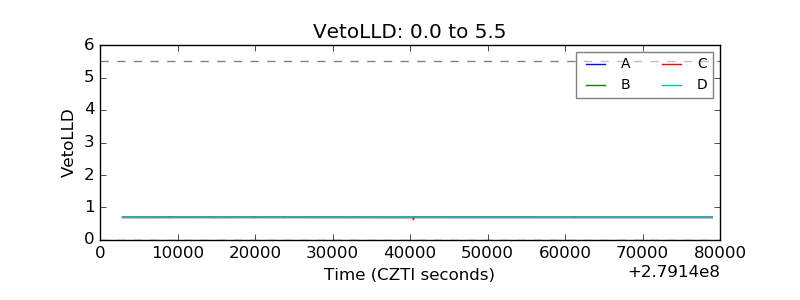 |
| Alpha Counter | 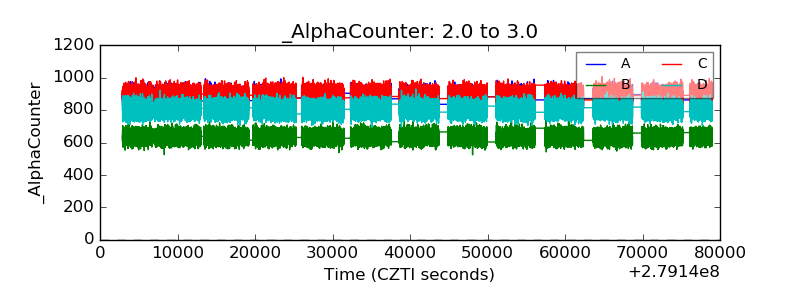 |
| _CPM_Rate |  |
| CZT Counter | 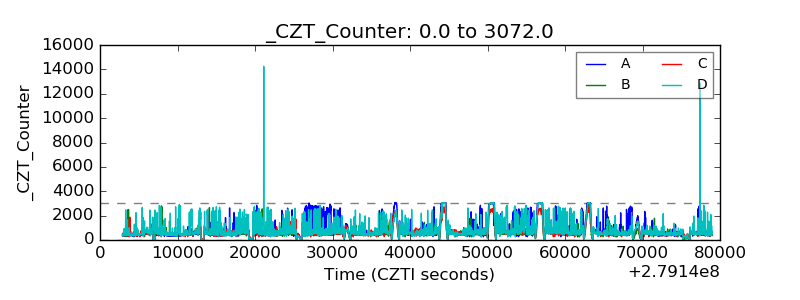 |
| +2.5 Volts monitor |  |
| +5 Volts monitor |  |
| _ROLL_ROT |  |
| _Roll_DEC | 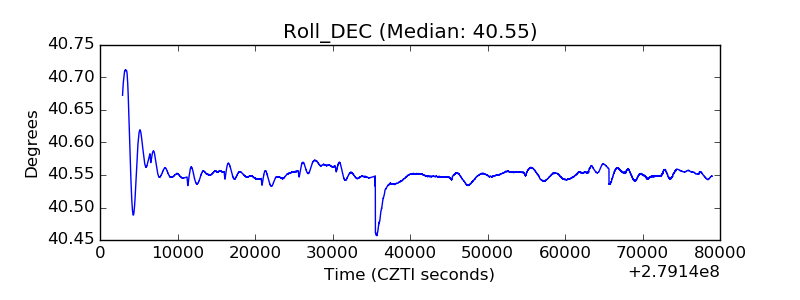 |
| _Roll_RA |  |
| Veto Counter |  |