| Param | Original file | Final file |
|---|---|---|
| Filename | modeM0/AS1A05_004T04_9000002494_16795cztM0_level2.evt | modeM0/AS1A05_004T04_9000002494_16795cztM0_level2_quad_clean.evt |
| Size (bytes) | 425,136,960 | 69,056,640 |
| Size | 405.4 MB | 65.9 MB |
| Events in quadrant A | 2,784,386 | 438,357 |
| Events in quadrant B | 3,273,674 | 425,450 |
| Events in quadrant C | 2,967,383 | 425,502 |
| Events in quadrant D | 3,471,382 | 412,148 |
| Mode M9 | |||
|---|---|---|---|
| Quadrant | BADHDUFLAG | Total packets | Discarded packets |
| A | 0 | 2 | 0 |
| B | 0 | 2 | 0 |
| C | 0 | 2 | 0 |
| D | 0 | 2 | 0 |
| Mode M0 | |||
|---|---|---|---|
| Quadrant | BADHDUFLAG | Total packets | Discarded packets |
| A | 0 | 12059 | 2 |
| B | 0 | 13353 | 1 |
| C | 0 | 12243 | 1 |
| D | 0 | 14197 | 1 |
| Mode SS | |||
|---|---|---|---|
| Quadrant | BADHDUFLAG | Total packets | Discarded packets |
| A | 0 | 114 | 0 |
| B | 0 | 114 | 0 |
| C | 0 | 114 | 0 |
| D | 0 | 114 | 0 |
| Quadrant | Total seconds | Saturated seconds | Saturation percentage |
|---|---|---|---|
| A | 5564 | 56 | 1.006470% |
| B | 5564 | 261 | 4.690870% |
| C | 5564 | 118 | 2.120776% |
| D | 5564 | 203 | 3.648454% |
Noise dominated data is calculated using 1-second bins in cleaned event files. If a bin has >2000 counts, and if more than 50% of those come from <1% of pixels, then it is considered to be noise-dominated and hence unusable.
| Quadrant | # 1 sec bins | Bins with >0 counts | Bins with >2000 counts | High rate bins dominated by noise | Noise dominated (total time) | Noise dominated (detector-on time) | Marked lightcurve |
|---|---|---|---|---|---|---|---|
| A | 5795 | 5566 | 4 | 4 | 0.07% | 0.07% | 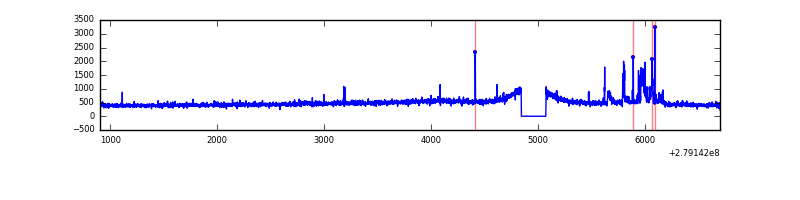 |
| B | 5795 | 5566 | 130 | 130 | 2.24% | 2.34% | 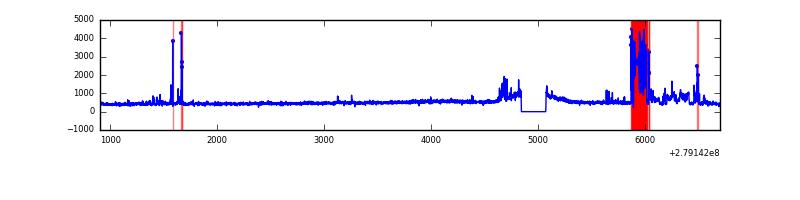 |
| C | 5795 | 5566 | 6 | 6 | 0.10% | 0.11% | 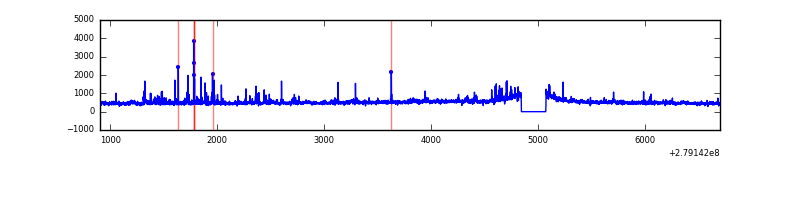 |
| D | 5795 | 5566 | 94 | 94 | 1.62% | 1.69% | 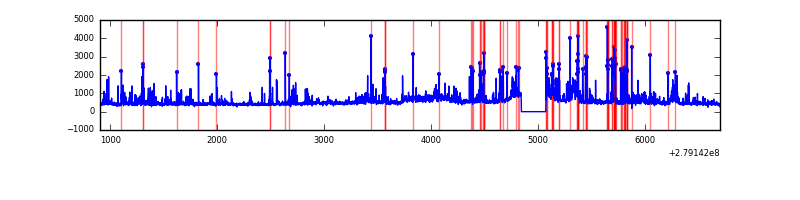 |
Top three noisy pixels from each quadrant. If the there are fewer than three noisy pixels in the level2.evt file, extra rows are filled as -1
| Pixel properties | Quadrant properties | ||||||
|---|---|---|---|---|---|---|---|
| Quadrant | DetID | PixID | Counts | Sigma | Mean | Median | Sigma |
| A | 15 | 174 | 157289 | 1126.92 | 679 | 664 | 139.0 |
| A | 10 | 234 | 10752 | 72.58 | 679 | 664 | 139.0 |
| A | 0 | 226 | 6023 | 38.56 | 679 | 664 | 139.0 |
| B | 0 | 229 | 536608 | 4142.87 | 662 | 645 | 129.4 |
| B | 15 | 35 | 67029 | 513.13 | 662 | 645 | 129.4 |
| B | 0 | 197 | 26224 | 197.72 | 662 | 645 | 129.4 |
| C | 0 | 207 | 182451 | 1177.97 | 649 | 652 | 154.3 |
| C | 3 | 233 | 117976 | 760.21 | 649 | 652 | 154.3 |
| C | 14 | 238 | 98975 | 637.09 | 649 | 652 | 154.3 |
| D | 1 | 52 | 444181 | 2777.79 | 650 | 631 | 159.7 |
| D | 12 | 110 | 189035 | 1179.91 | 650 | 631 | 159.7 |
| D | 7 | 38 | 158115 | 986.27 | 650 | 631 | 159.7 |
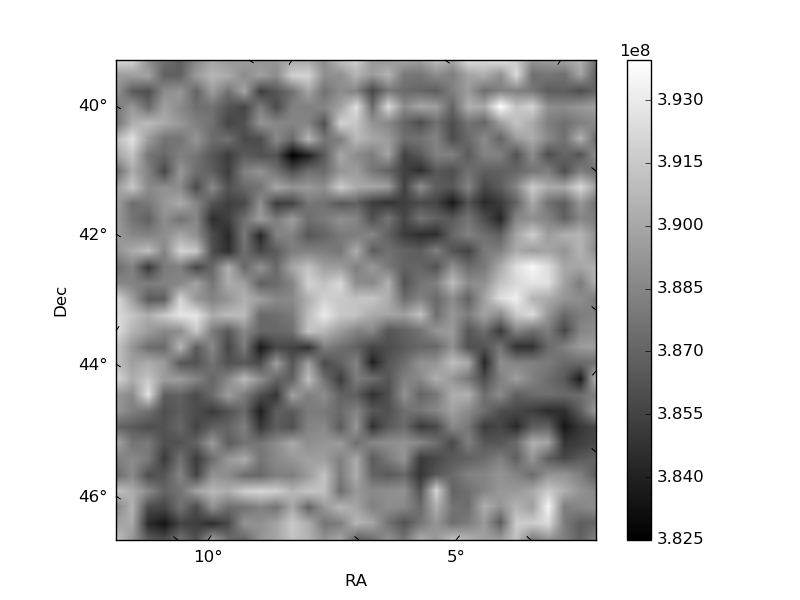
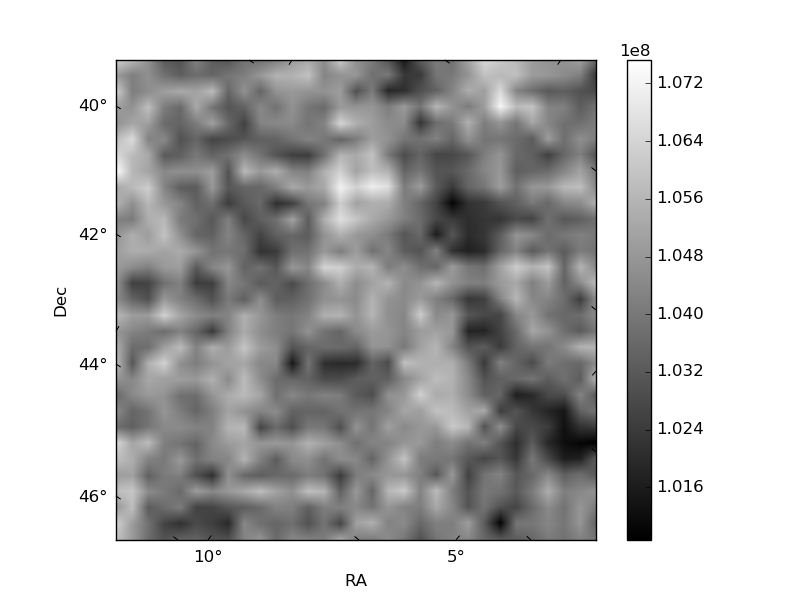
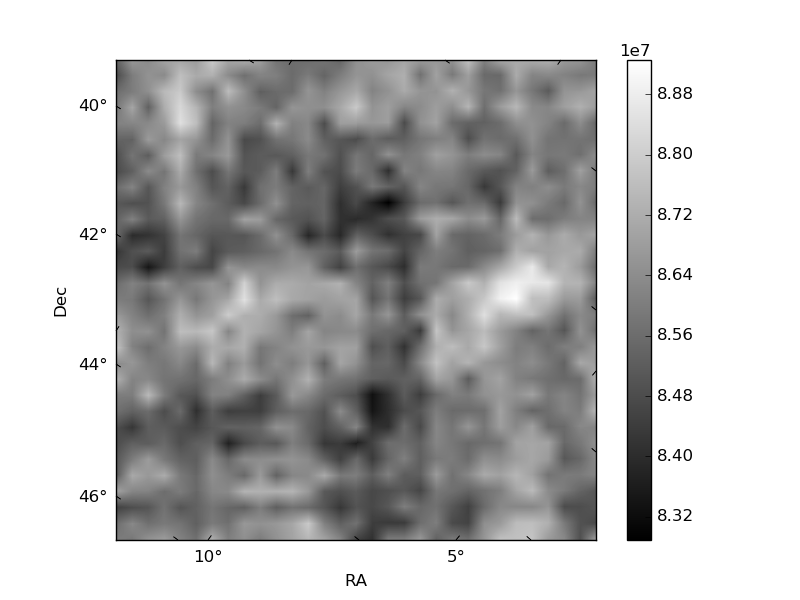
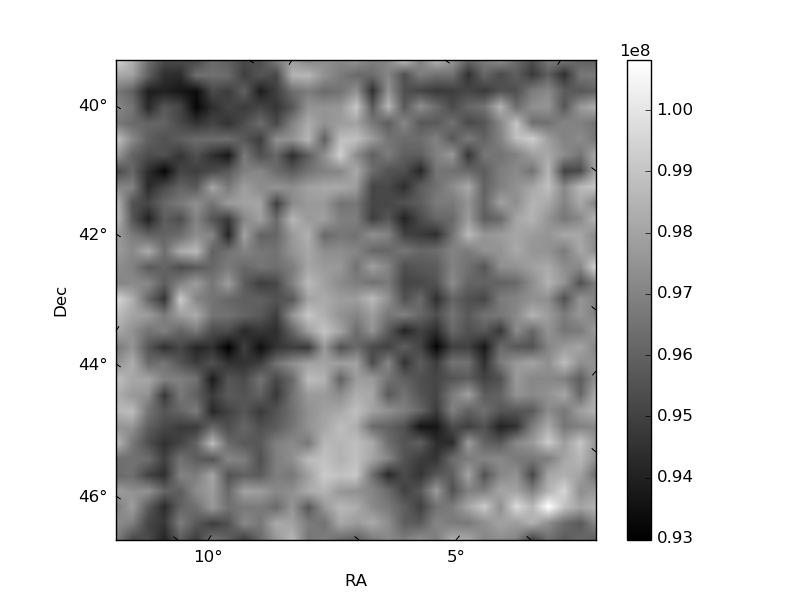
Histogram calculated using DETX and DETY for each event in the final _common_clean file
| Quadrant A | 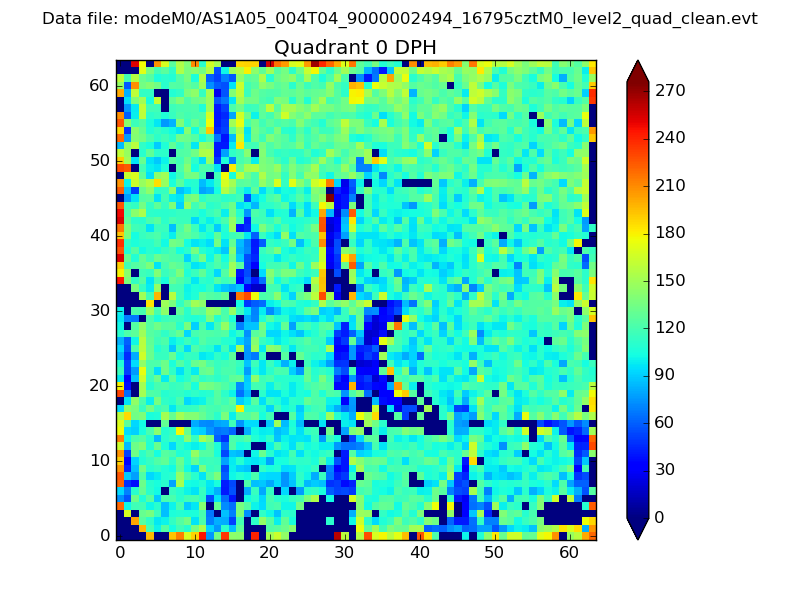 |
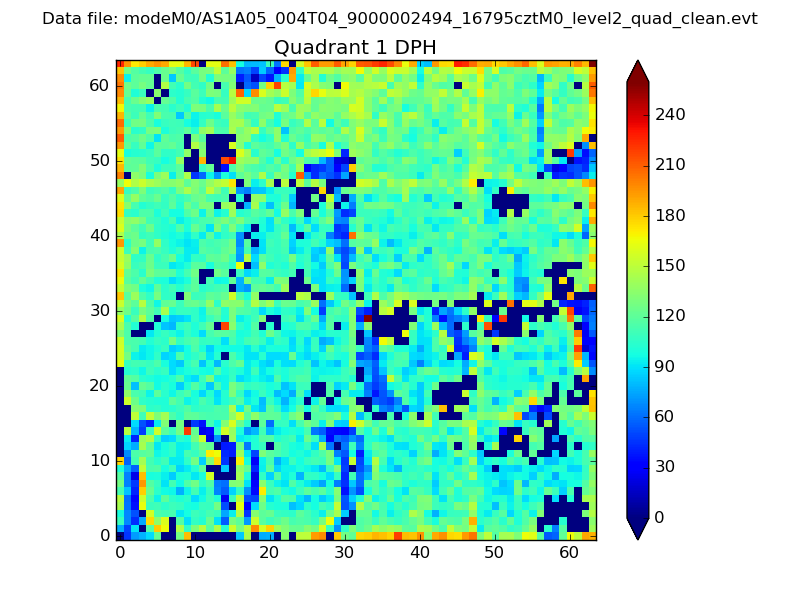 |
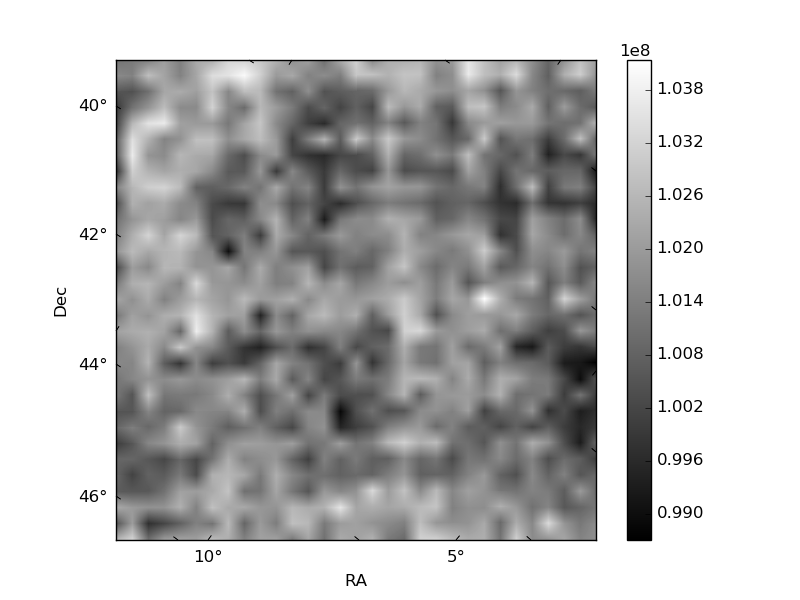
Quadrant B |
|---|---|---|---|
| Quadrant D |  |
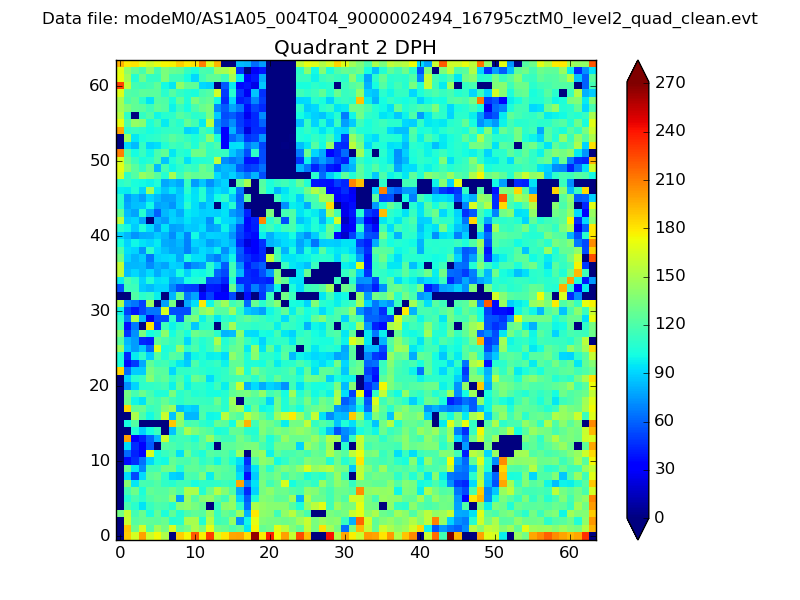 |
Quadrant C |
| Plot type | Count rate plots | Images |
|---|---|---|
| Comparison with Poisson distribution Blue bars denote a histogram of data divided into 1 sec bins. Red curve is a Poisson curve with rate = median count rate of data. |
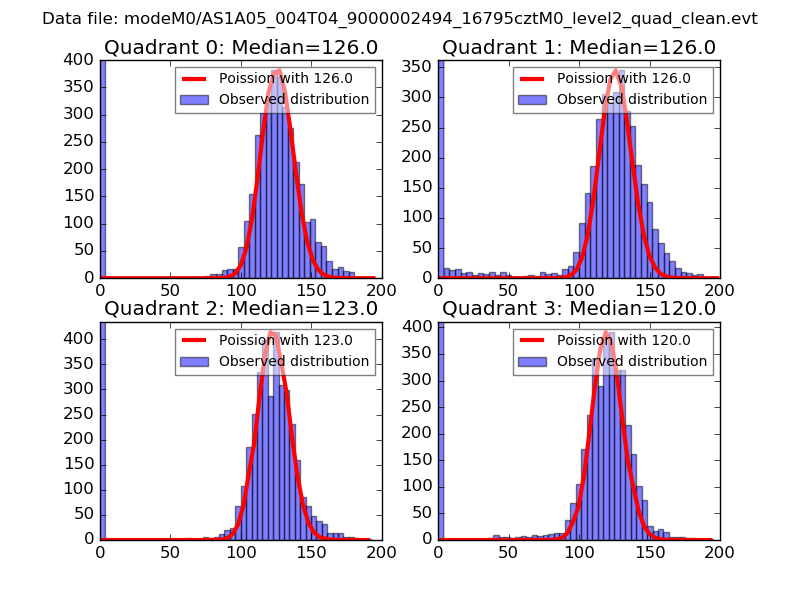 |
 |
| Quadrant-wise count rates Data is divided into 100 sec bins |
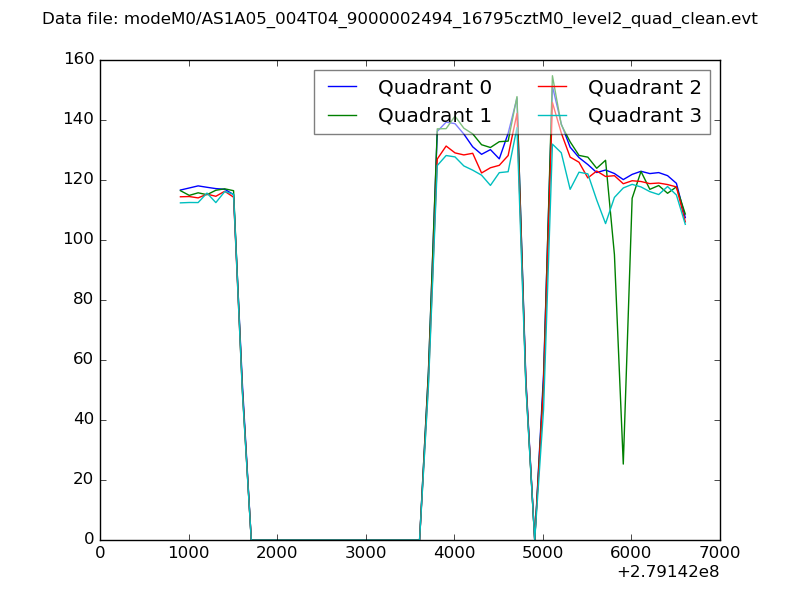 |
|
| Module-wise count rates for Quadrant A Data is divided into 100 sec bins |
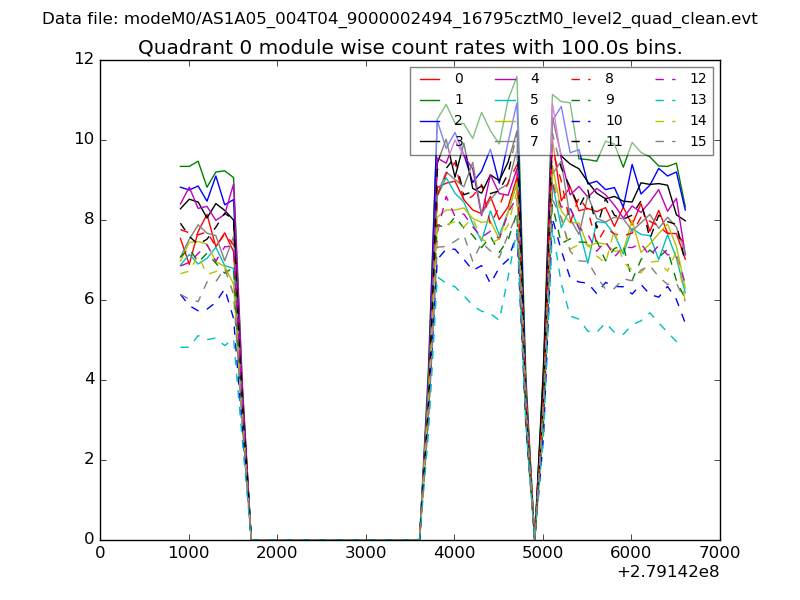 |
 |
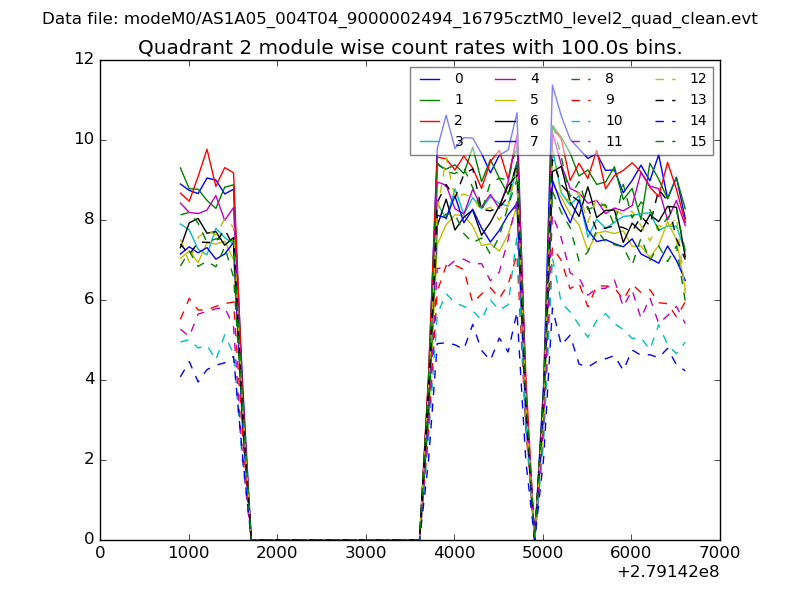
| Module-wise count rates for Quadrant B Data is divided into 100 sec bins |
 |
 |
| Module-wise count rates for Quadrant C Data is divided into 100 sec bins |
 |
 |
| Module-wise count rates for Quadrant D Data is divided into 100 sec bins |
 |
 |
| Parameter | Plot |
|---|---|
| CZT HV Monitor |  |
| D_VDD | 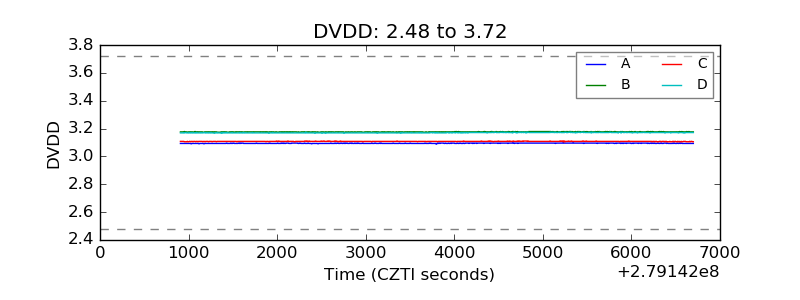 |
| Temperature 1 | 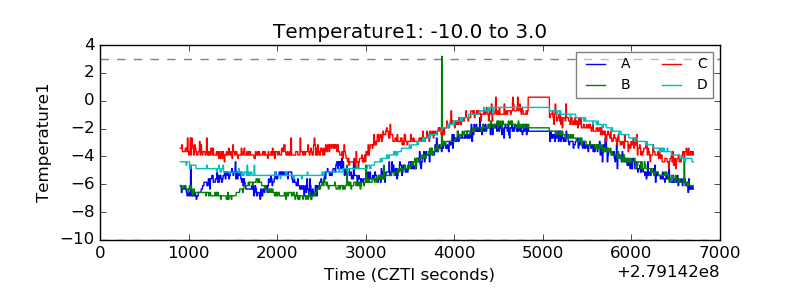 |
| Veto HV Monitor | 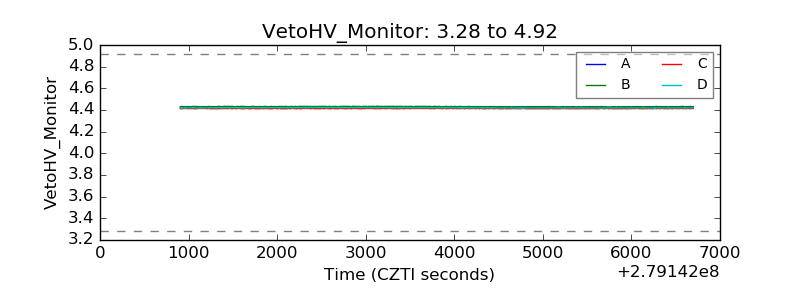 |
| Veto LLD | 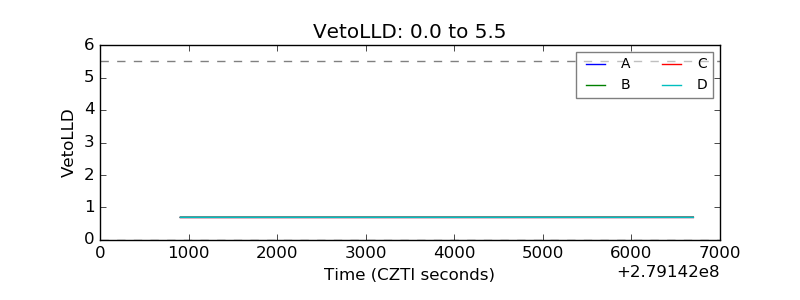 |
| Alpha Counter | 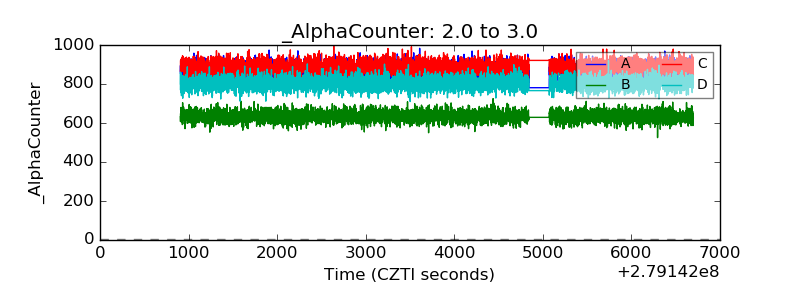 |
| _CPM_Rate | 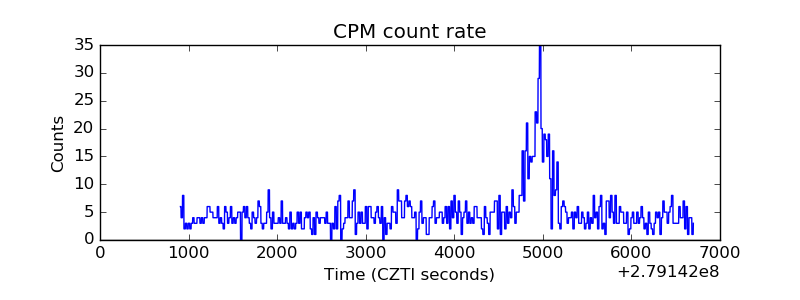 |
| CZT Counter | 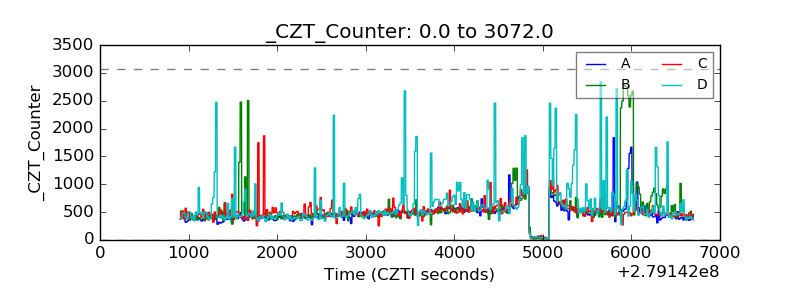 |
| +2.5 Volts monitor |  |
| +5 Volts monitor | 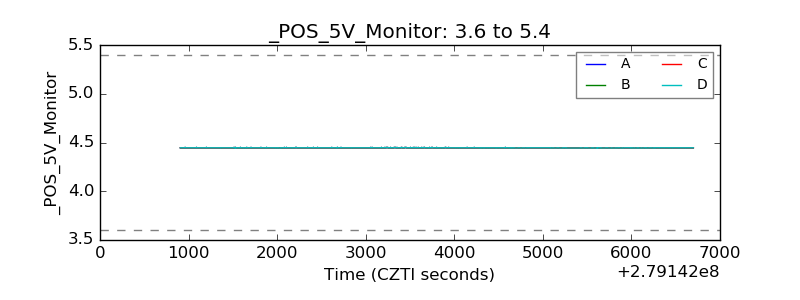 |
| _ROLL_ROT | 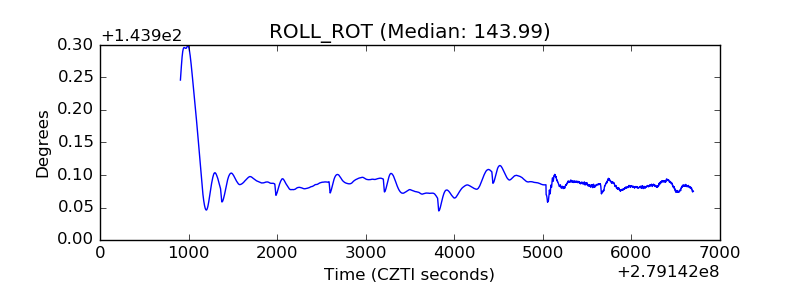 |
| _Roll_DEC | 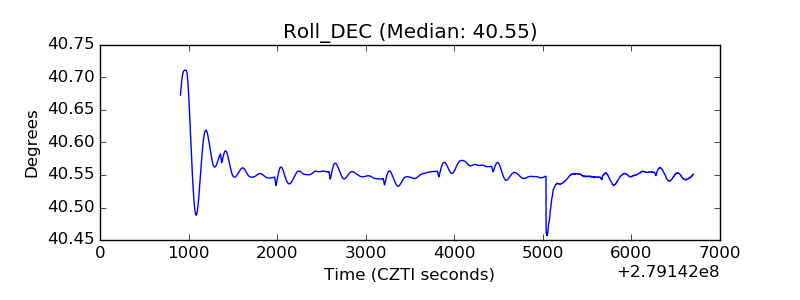 |
| _Roll_RA | 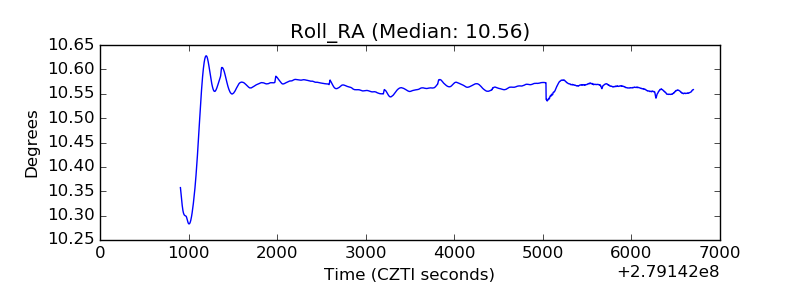 |
| Veto Counter | 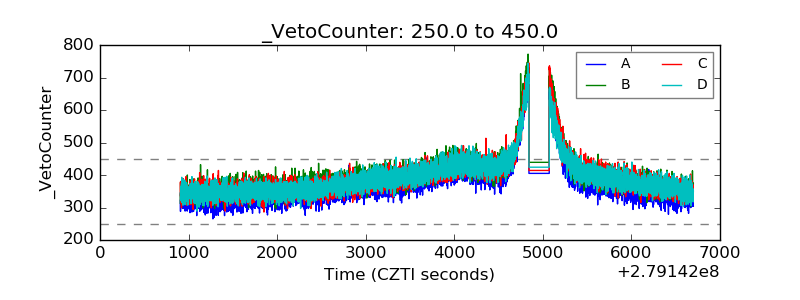 |