| Param | Original file | Final file |
|---|---|---|
| Filename | modeM0/AS1A05_004T04_9000002494_16796cztM0_level2.evt | modeM0/AS1A05_004T04_9000002494_16796cztM0_level2_quad_clean.evt |
| Size (bytes) | 617,621,760 | 103,858,560 |
| Size | 589.0 MB | 99.0 MB |
| Events in quadrant A | 3,930,857 | 681,186 |
| Events in quadrant B | 4,299,548 | 669,359 |
| Events in quadrant C | 3,986,166 | 664,942 |
| Events in quadrant D | 5,975,912 | 603,657 |
| Mode M9 | |||
|---|---|---|---|
| Quadrant | BADHDUFLAG | Total packets | Discarded packets |
| A | 0 | 4 | 0 |
| B | 0 | 4 | 0 |
| C | 0 | 4 | 0 |
| D | 0 | 5 | 0 |
| Mode M0 | |||
|---|---|---|---|
| Quadrant | BADHDUFLAG | Total packets | Discarded packets |
| A | 0 | 16988 | 3 |
| B | 0 | 17857 | 2 |
| C | 0 | 16822 | 2 |
| D | 0 | 22862 | 2 |
| Mode SS | |||
|---|---|---|---|
| Quadrant | BADHDUFLAG | Total packets | Discarded packets |
| A | 0 | 154 | 0 |
| B | 0 | 154 | 0 |
| C | 0 | 154 | 0 |
| D | 0 | 154 | 0 |
| Quadrant | Total seconds | Saturated seconds | Saturation percentage |
|---|---|---|---|
| A | 7555 | 76 | 1.005956% |
| B | 7555 | 226 | 2.991396% |
| C | 7555 | 131 | 1.733951% |
| D | 7555 | 890 | 11.780278% |
Noise dominated data is calculated using 1-second bins in cleaned event files. If a bin has >2000 counts, and if more than 50% of those come from <1% of pixels, then it is considered to be noise-dominated and hence unusable.
| Quadrant | # 1 sec bins | Bins with >0 counts | Bins with >2000 counts | High rate bins dominated by noise | Noise dominated (total time) | Noise dominated (detector-on time) | Marked lightcurve |
|---|---|---|---|---|---|---|---|
| A | 7941 | 7557 | 29 | 29 | 0.37% | 0.38% | 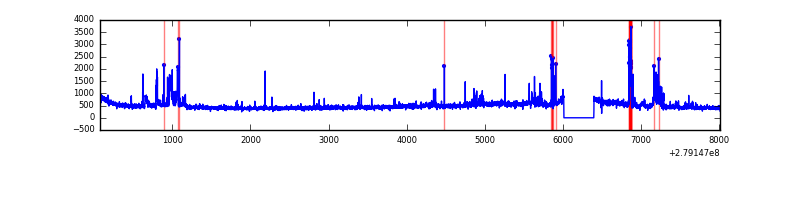 |
| B | 7941 | 7557 | 134 | 134 | 1.69% | 1.77% | 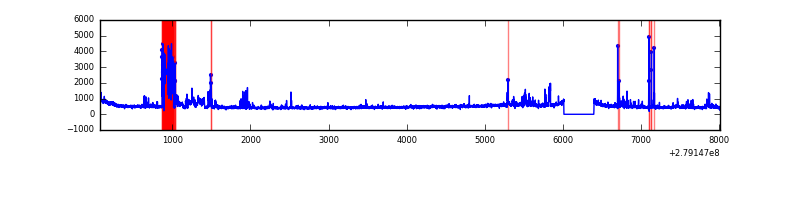 |
| C | 7941 | 7557 | 5 | 5 | 0.06% | 0.07% | 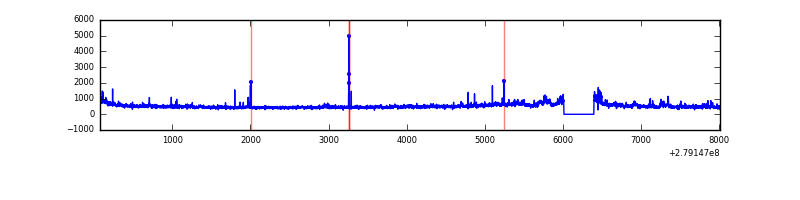 |
| D | 7941 | 7557 | 652 | 652 | 8.21% | 8.63% | 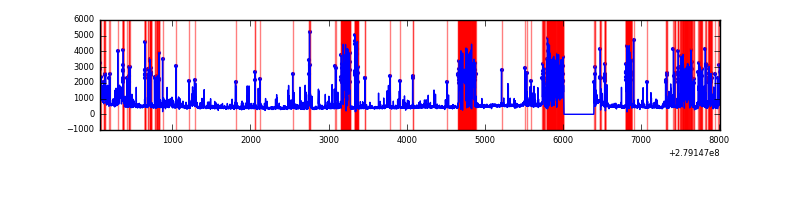 |
Top three noisy pixels from each quadrant. If the there are fewer than three noisy pixels in the level2.evt file, extra rows are filled as -1
| Pixel properties | Quadrant properties | ||||||
|---|---|---|---|---|---|---|---|
| Quadrant | DetID | PixID | Counts | Sigma | Mean | Median | Sigma |
| A | 15 | 174 | 448863 | 2474.79 | 895 | 876 | 181.0 |
| A | 9 | 143 | 22583 | 119.91 | 895 | 876 | 181.0 |
| A | 10 | 234 | 16309 | 85.26 | 895 | 876 | 181.0 |
| B | 0 | 229 | 590996 | 3497.78 | 885 | 861 | 168.7 |
| B | 15 | 35 | 117315 | 690.23 | 885 | 861 | 168.7 |
| B | 0 | 189 | 64129 | 375.0 | 885 | 861 | 168.7 |
| C | 3 | 233 | 342871 | 1677.4 | 868 | 873 | 203.9 |
| C | 14 | 238 | 132609 | 646.13 | 868 | 873 | 203.9 |
| C | 0 | 207 | 86915 | 422.01 | 868 | 873 | 203.9 |
| D | 1 | 52 | 2381574 | 11902.7 | 818 | 794 | 200.0 |
| D | 12 | 218 | 177247 | 882.18 | 818 | 794 | 200.0 |
| D | 7 | 38 | 173261 | 862.25 | 818 | 794 | 200.0 |
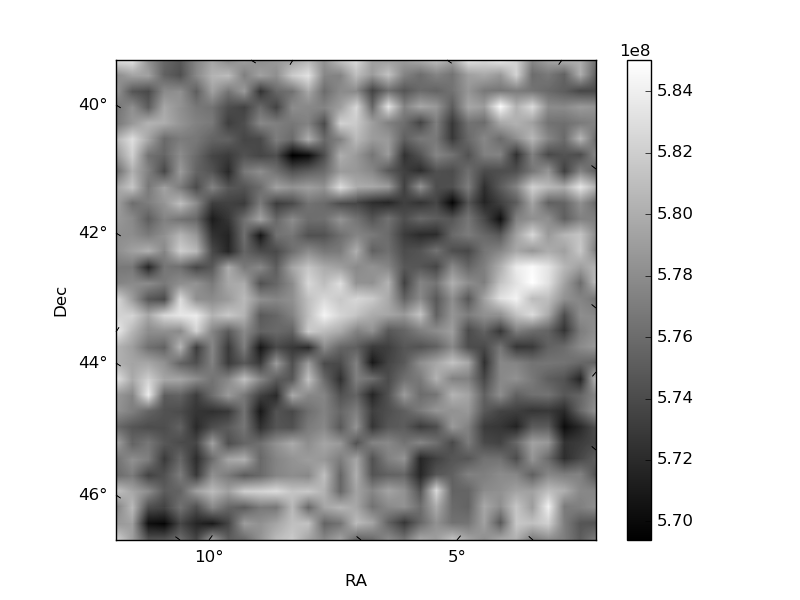
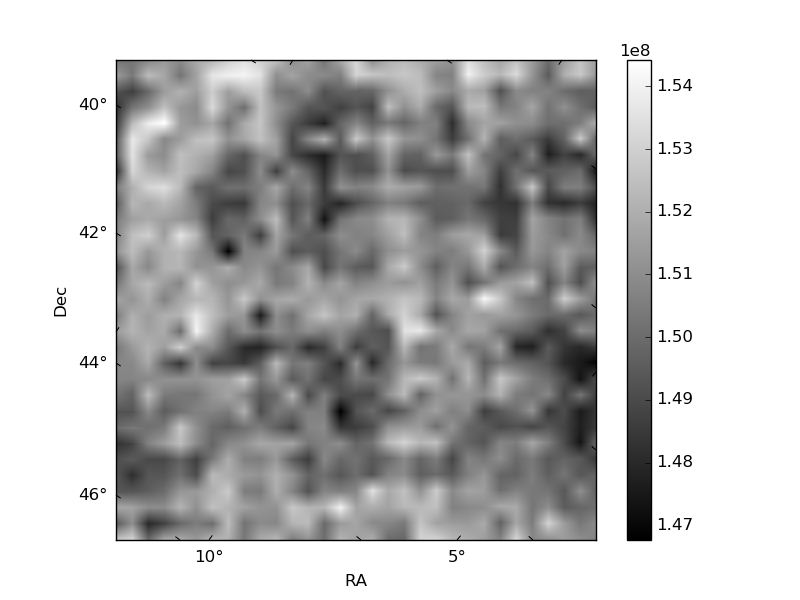
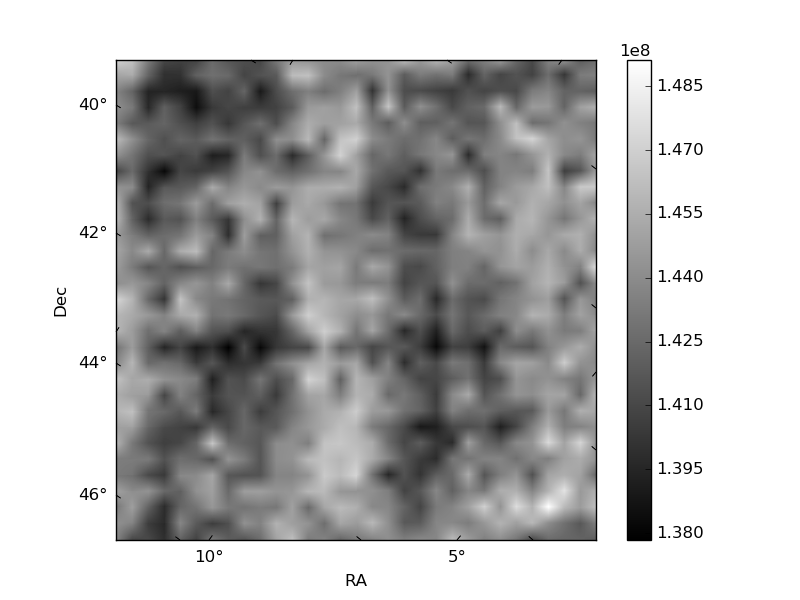
Histogram calculated using DETX and DETY for each event in the final _common_clean file
| Quadrant A | 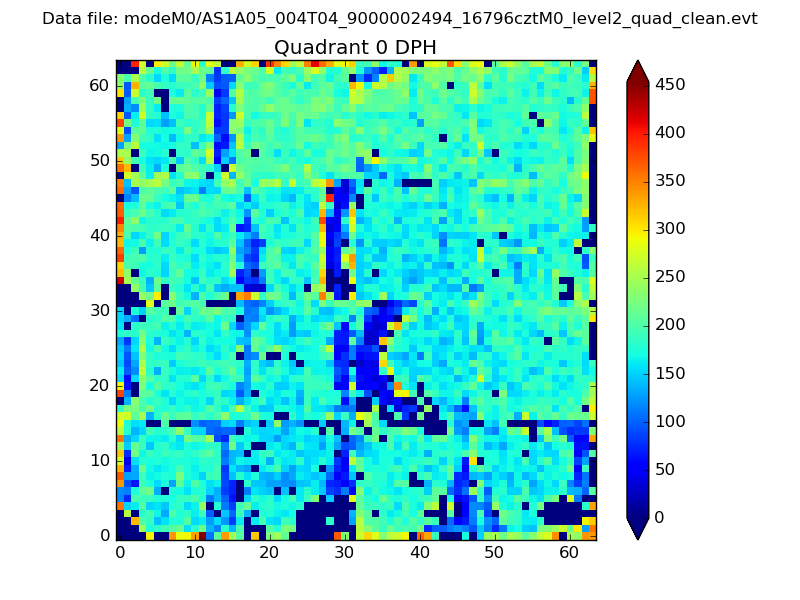 |
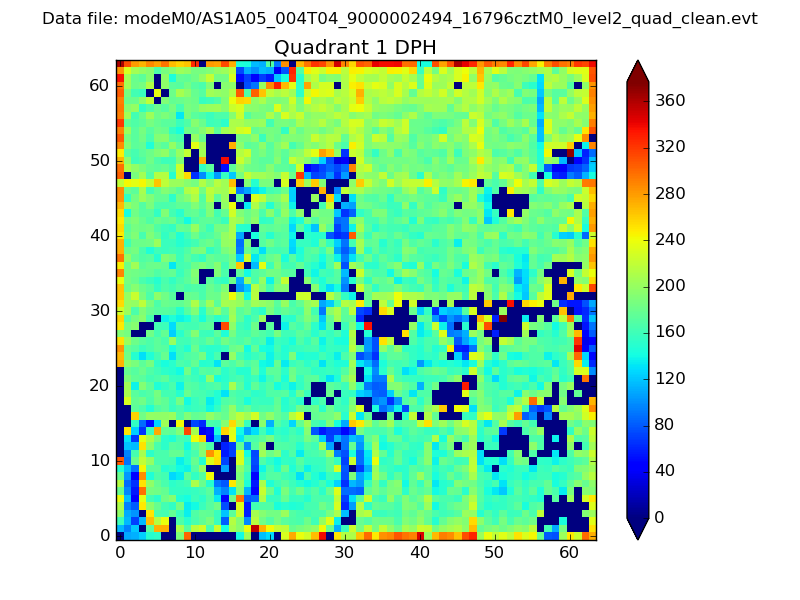 |
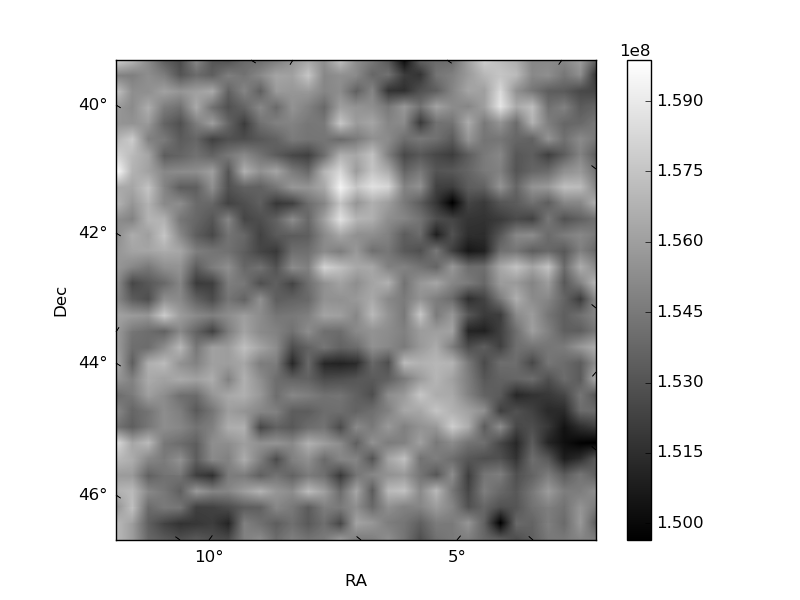
Quadrant B |
|---|---|---|---|
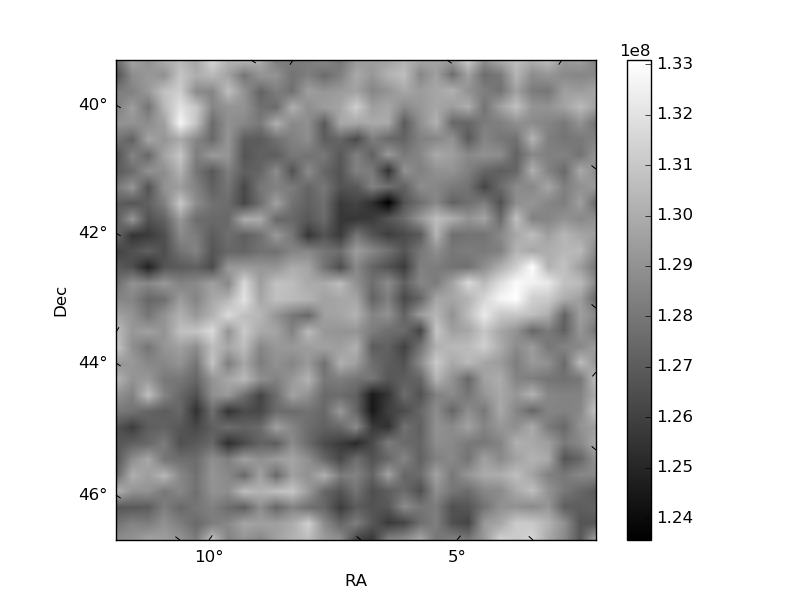
| Quadrant D | 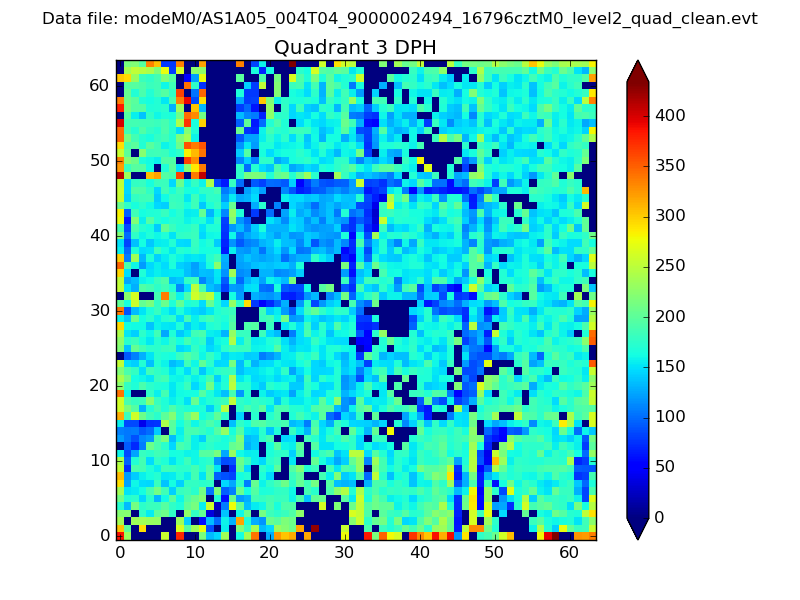 |
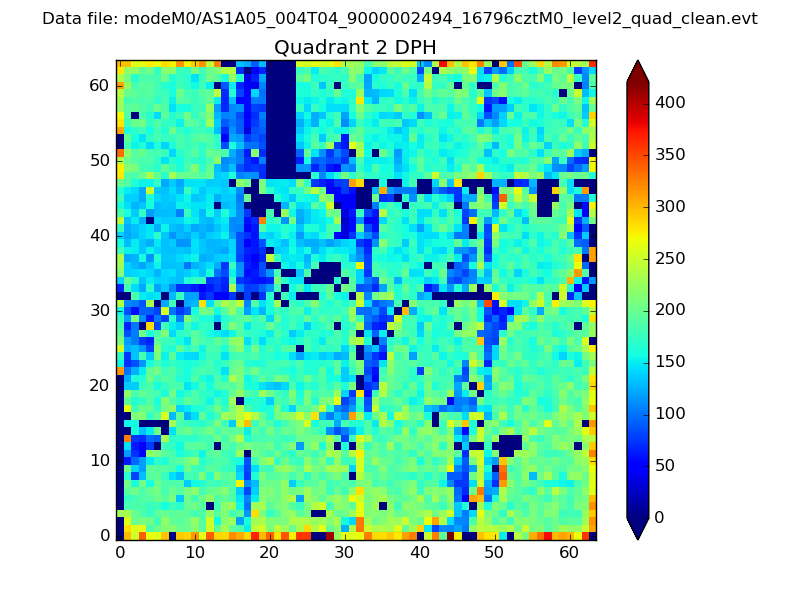 |
Quadrant C |
| Plot type | Count rate plots | Images |
|---|---|---|
| Comparison with Poisson distribution Blue bars denote a histogram of data divided into 1 sec bins. Red curve is a Poisson curve with rate = median count rate of data. |
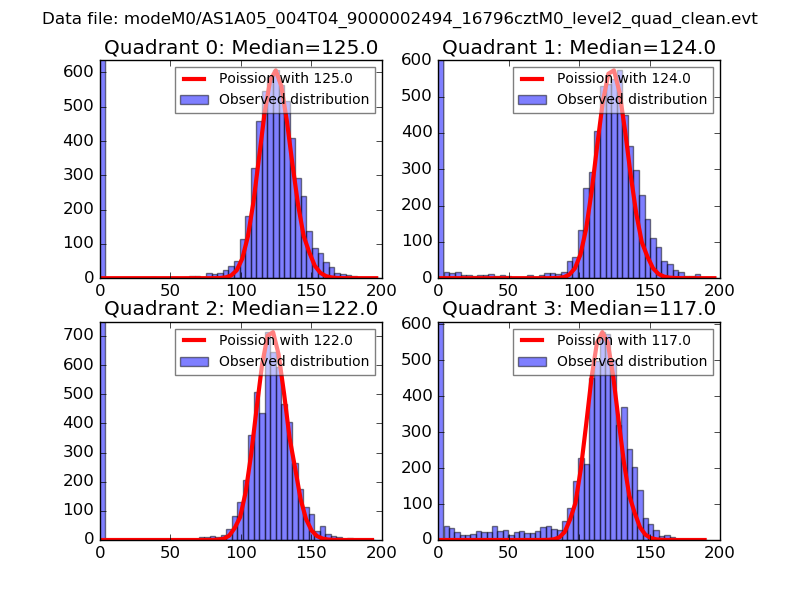 |
 |
| Quadrant-wise count rates Data is divided into 100 sec bins |
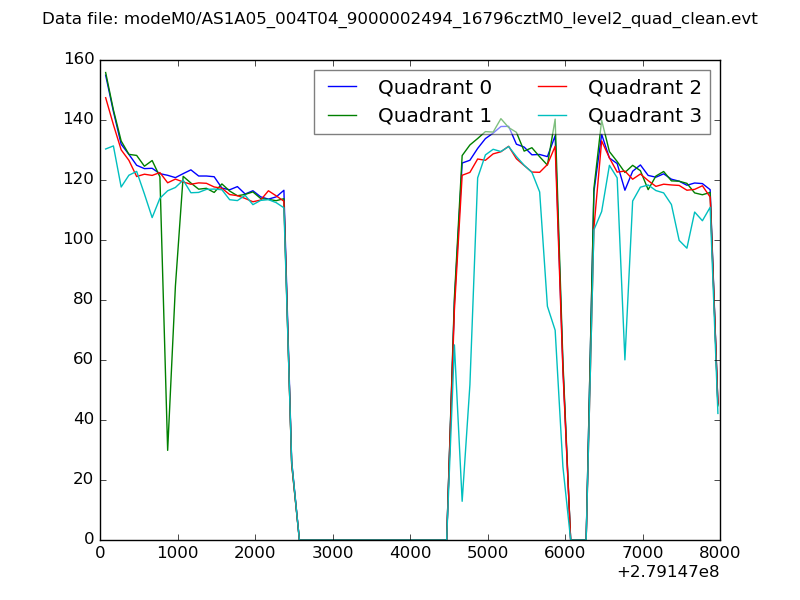 |
|
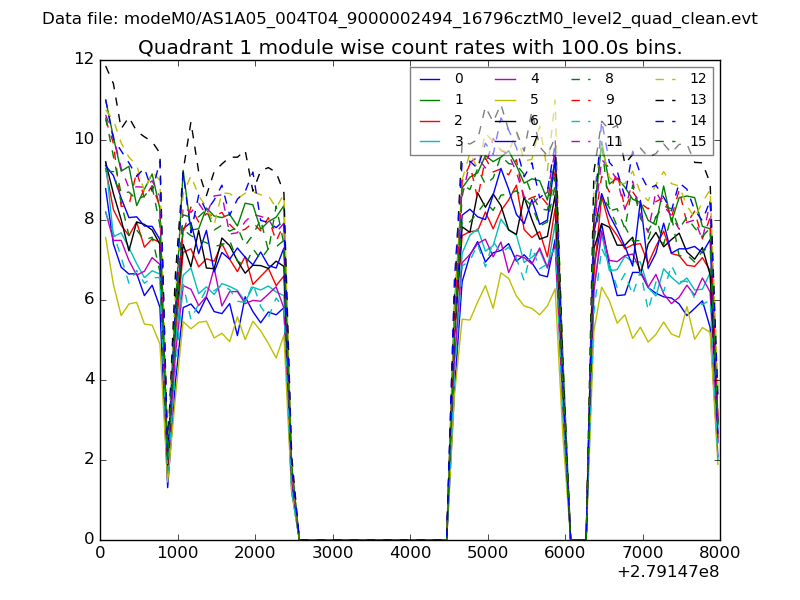
| Module-wise count rates for Quadrant A Data is divided into 100 sec bins |
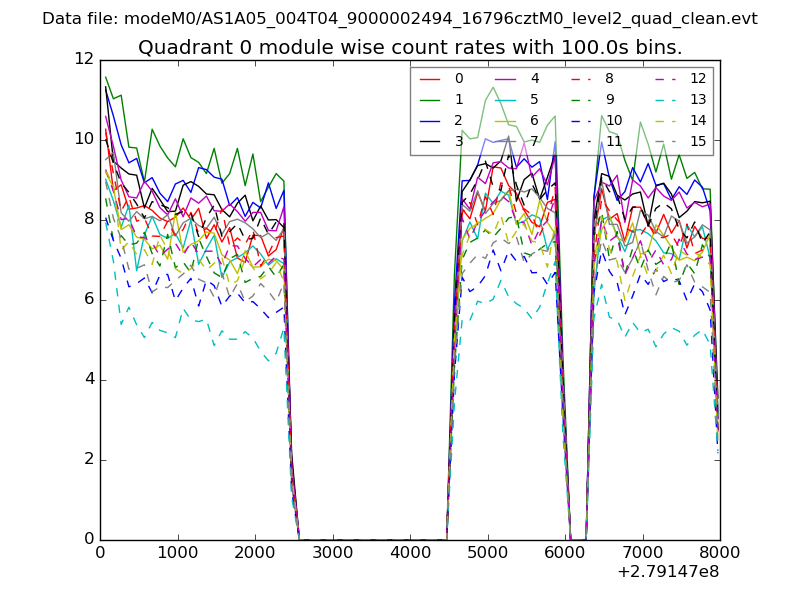 |
 |
| Module-wise count rates for Quadrant B Data is divided into 100 sec bins |
 |
 |
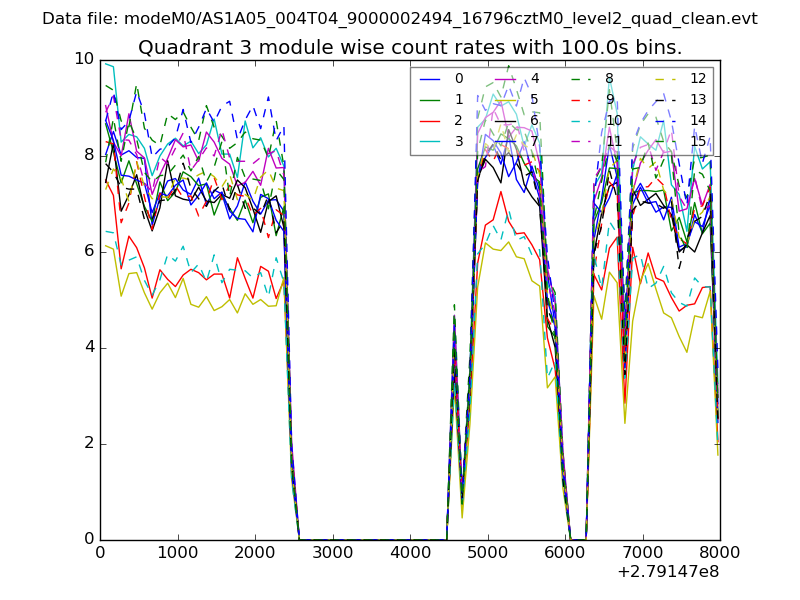
| Module-wise count rates for Quadrant C Data is divided into 100 sec bins |
 |
 |
| Module-wise count rates for Quadrant D Data is divided into 100 sec bins |
 |
 |
| Parameter | Plot |
|---|---|
| CZT HV Monitor |  |
| D_VDD | 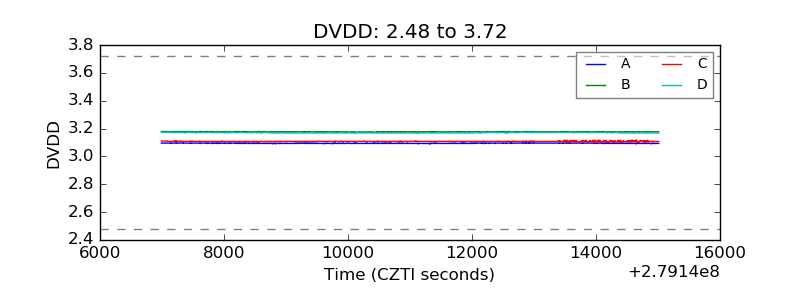 |
| Temperature 1 |  |
| Veto HV Monitor | 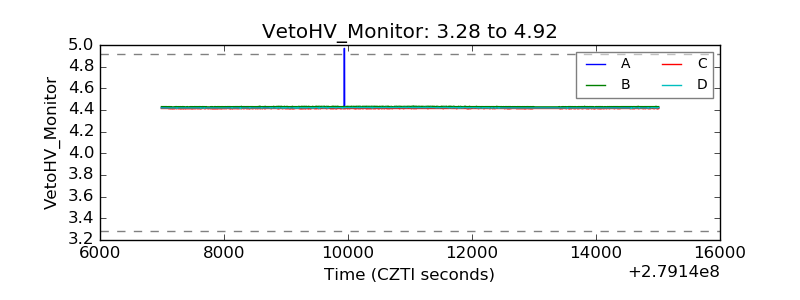 |
| Veto LLD | 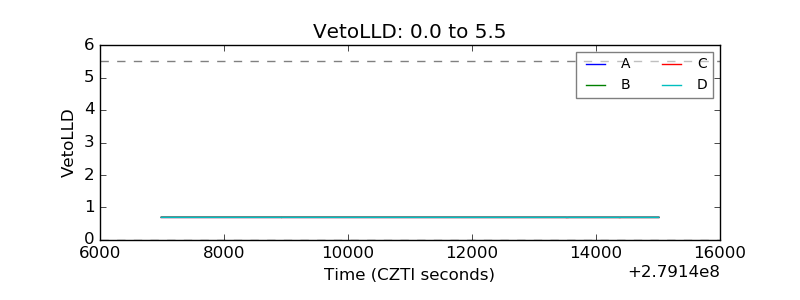 |
| Alpha Counter | 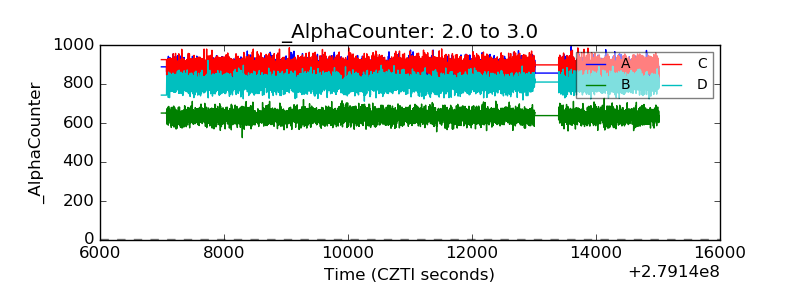 |
| _CPM_Rate | 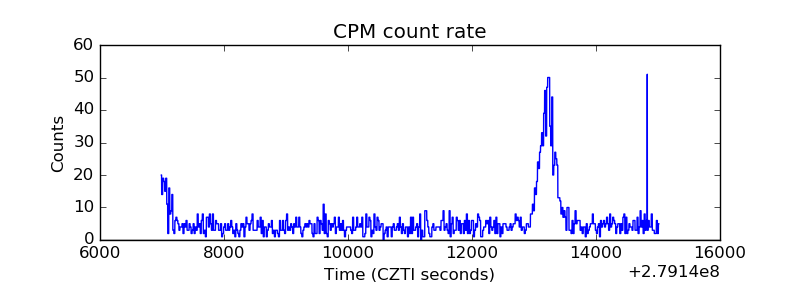 |
| CZT Counter |  |
| +2.5 Volts monitor |  |
| +5 Volts monitor | 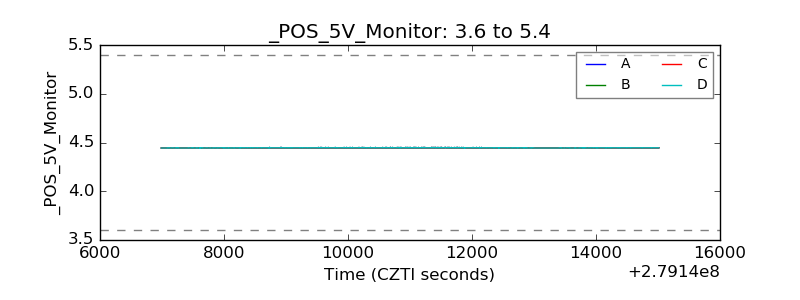 |
| _ROLL_ROT | 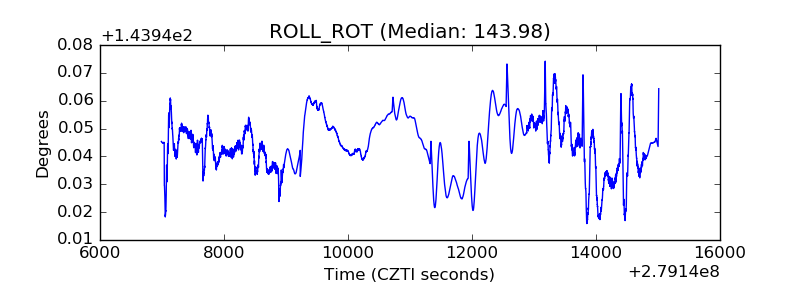 |
| _Roll_DEC | 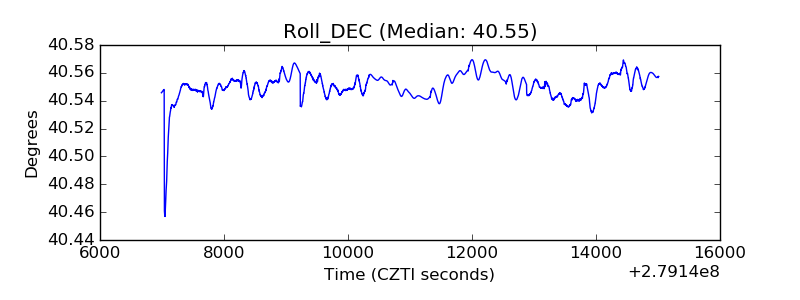 |
| _Roll_RA | 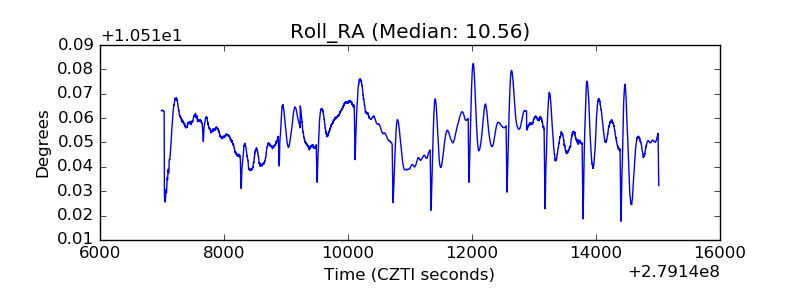 |
| Veto Counter | 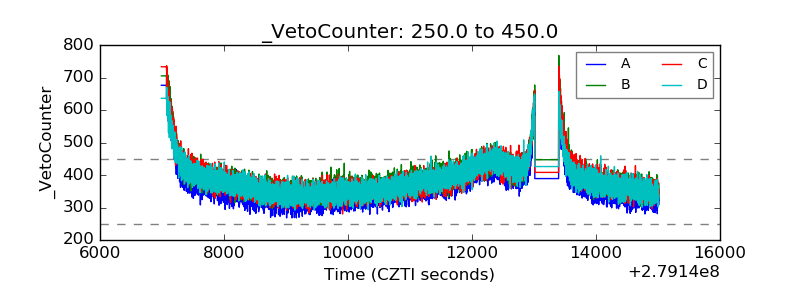 |