| Param | Original file | Final file |
|---|---|---|
| Filename | modeM0/AS1A05_004T04_9000002494_16798cztM0_level2.evt | modeM0/AS1A05_004T04_9000002494_16798cztM0_level2_quad_clean.evt |
| Size (bytes) | 1,244,796,480 | 172,526,400 |
| Size | 1.2 GB | 164.5 MB |
| Events in quadrant A | 10,049,423 | 1,067,175 |
| Events in quadrant B | 6,986,676 | 1,127,019 |
| Events in quadrant C | 8,206,797 | 1,083,844 |
| Events in quadrant D | 11,536,362 | 1,004,415 |
| Mode M9 | |||
|---|---|---|---|
| Quadrant | BADHDUFLAG | Total packets | Discarded packets |
| A | 0 | 17 | 0 |
| B | 0 | 17 | 0 |
| C | 0 | 17 | 0 |
| D | 0 | 17 | 0 |
| Mode M0 | |||
|---|---|---|---|
| Quadrant | BADHDUFLAG | Total packets | Discarded packets |
| A | 0 | 39040 | 4 |
| B | 0 | 29707 | 3 |
| C | 0 | 33593 | 3 |
| D | 0 | 43679 | 3 |
| Mode SS | |||
|---|---|---|---|
| Quadrant | BADHDUFLAG | Total packets | Discarded packets |
| A | 0 | 276 | 0 |
| B | 0 | 276 | 0 |
| C | 0 | 276 | 0 |
| D | 0 | 276 | 0 |
| Quadrant | Total seconds | Saturated seconds | Saturation percentage |
|---|---|---|---|
| A | 13643 | 1246 | 9.132889% |
| B | 13643 | 136 | 0.996848% |
| C | 13643 | 288 | 2.110973% |
| D | 13643 | 1344 | 9.851206% |
Noise dominated data is calculated using 1-second bins in cleaned event files. If a bin has >2000 counts, and if more than 50% of those come from <1% of pixels, then it is considered to be noise-dominated and hence unusable.
| Quadrant | # 1 sec bins | Bins with >0 counts | Bins with >2000 counts | High rate bins dominated by noise | Noise dominated (total time) | Noise dominated (detector-on time) | Marked lightcurve |
|---|---|---|---|---|---|---|---|
| A | 15274 | 13647 | 1058 | 1058 | 6.93% | 7.75% | 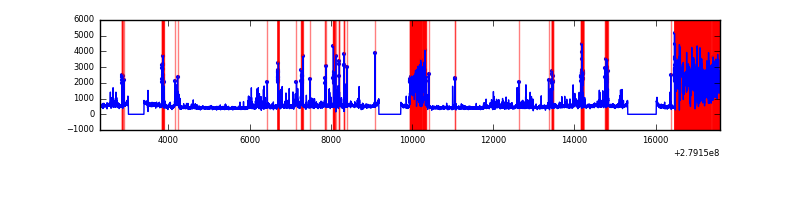 |
| B | 15274 | 13647 | 20 | 20 | 0.13% | 0.15% | 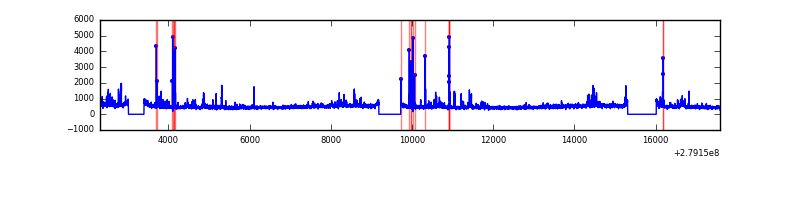 |
| C | 15274 | 13647 | 2 | 2 | 0.01% | 0.01% | 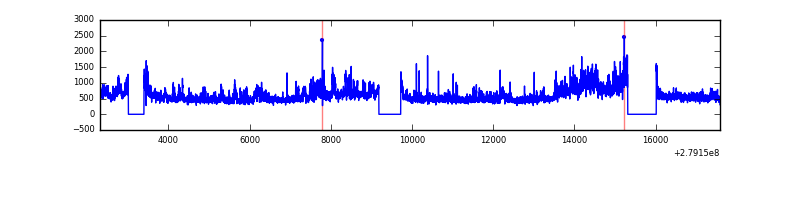 |
| D | 15274 | 13647 | 928 | 928 | 6.08% | 6.80% | 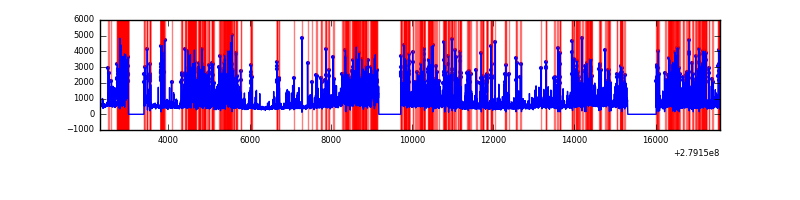 |
Top three noisy pixels from each quadrant. If the there are fewer than three noisy pixels in the level2.evt file, extra rows are filled as -1
| Pixel properties | Quadrant properties | ||||||
|---|---|---|---|---|---|---|---|
| Quadrant | DetID | PixID | Counts | Sigma | Mean | Median | Sigma |
| A | 15 | 174 | 3889614 | 12300.84 | 1566 | 1530 | 316.1 |
| A | 10 | 234 | 63585 | 196.33 | 1566 | 1530 | 316.1 |
| A | 9 | 143 | 36213 | 109.73 | 1566 | 1530 | 316.1 |
| B | 0 | 229 | 305460 | 979.08 | 1621 | 1578 | 310.4 |
| B | 15 | 35 | 157707 | 503.03 | 1621 | 1578 | 310.4 |
| B | 0 | 189 | 81766 | 258.36 | 1621 | 1578 | 310.4 |
| C | 3 | 233 | 1683101 | 4615.47 | 1562 | 1573 | 364.3 |
| C | 14 | 238 | 238186 | 649.46 | 1562 | 1573 | 364.3 |
| C | 0 | 207 | 154515 | 419.8 | 1562 | 1573 | 364.3 |
| D | 1 | 52 | 4894984 | 13297.08 | 1515 | 1472 | 368.0 |
| D | 12 | 218 | 496575 | 1345.34 | 1515 | 1472 | 368.0 |
| D | 13 | 248 | 290073 | 784.21 | 1515 | 1472 | 368.0 |
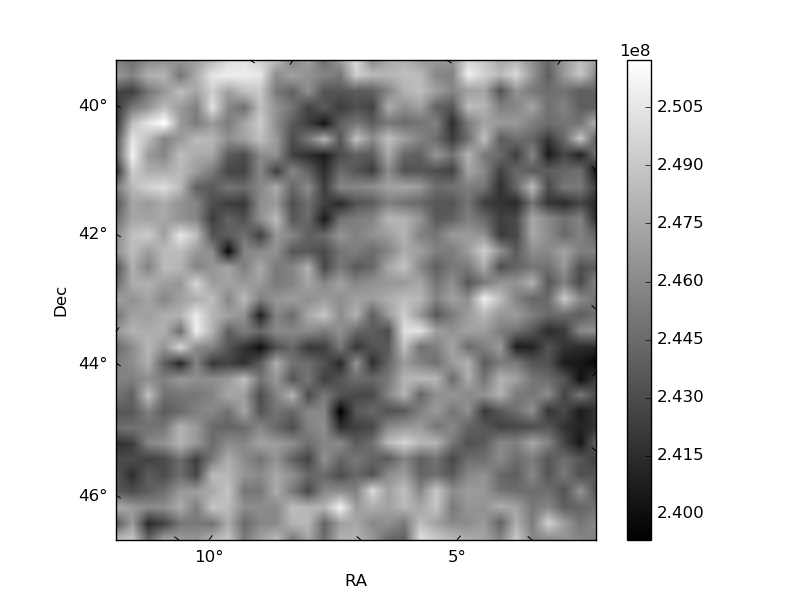
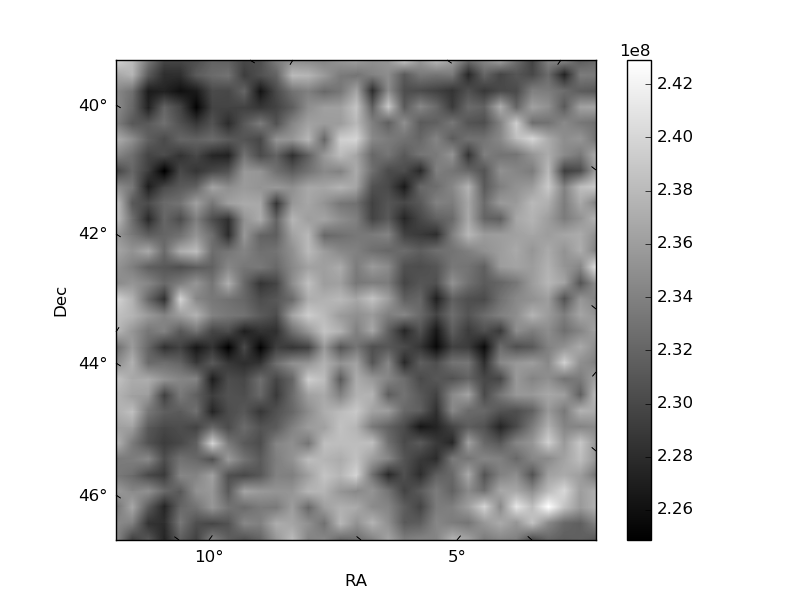
Histogram calculated using DETX and DETY for each event in the final _common_clean file
| Quadrant A | 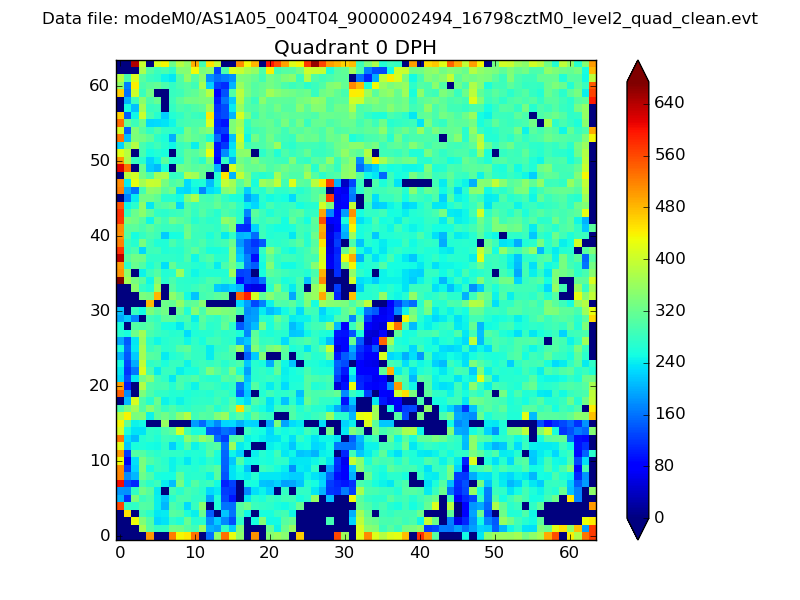 |
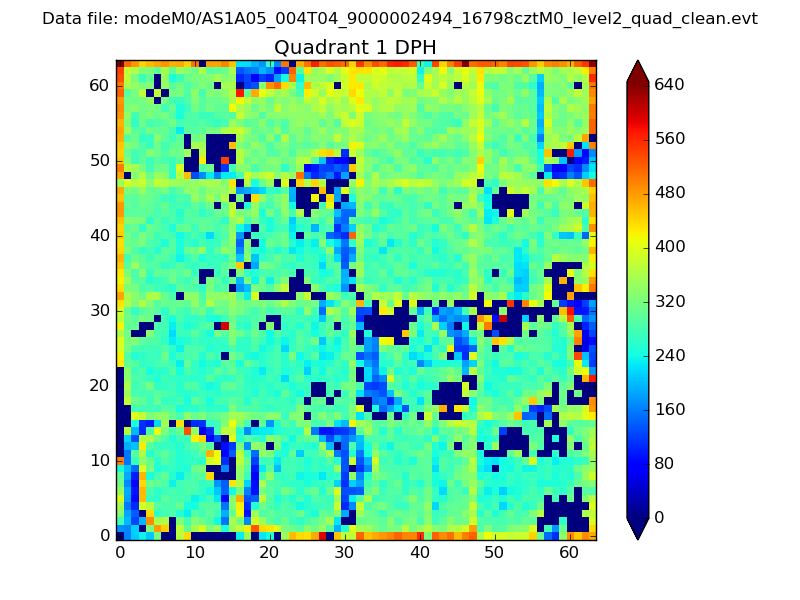 |
Quadrant B |
|---|---|---|---|
| Quadrant D | 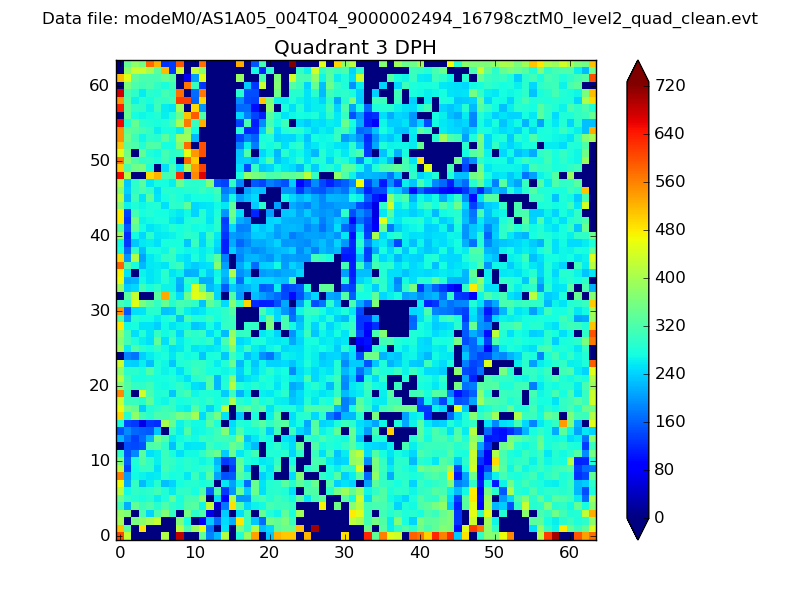 |
 |
Quadrant C |
| Plot type | Count rate plots | Images |
|---|---|---|
| Comparison with Poisson distribution Blue bars denote a histogram of data divided into 1 sec bins. Red curve is a Poisson curve with rate = median count rate of data. |
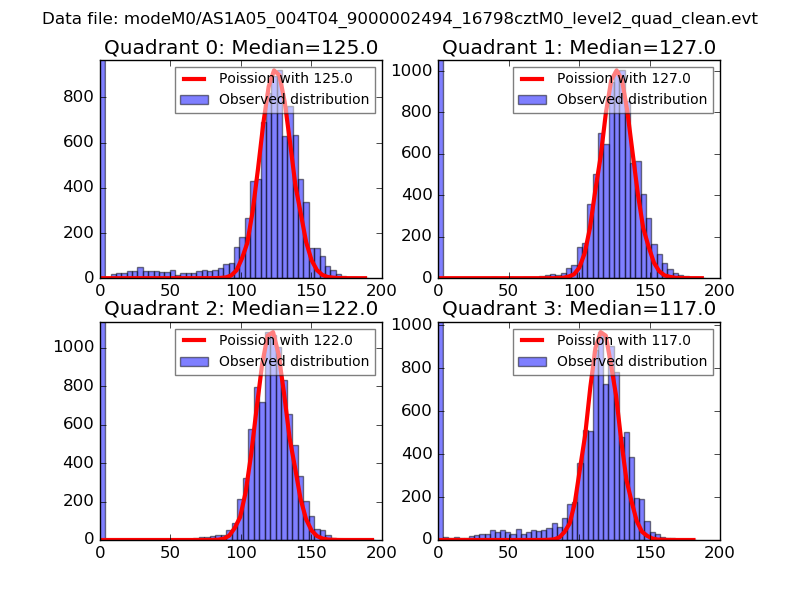 |
 |
| Quadrant-wise count rates Data is divided into 100 sec bins |
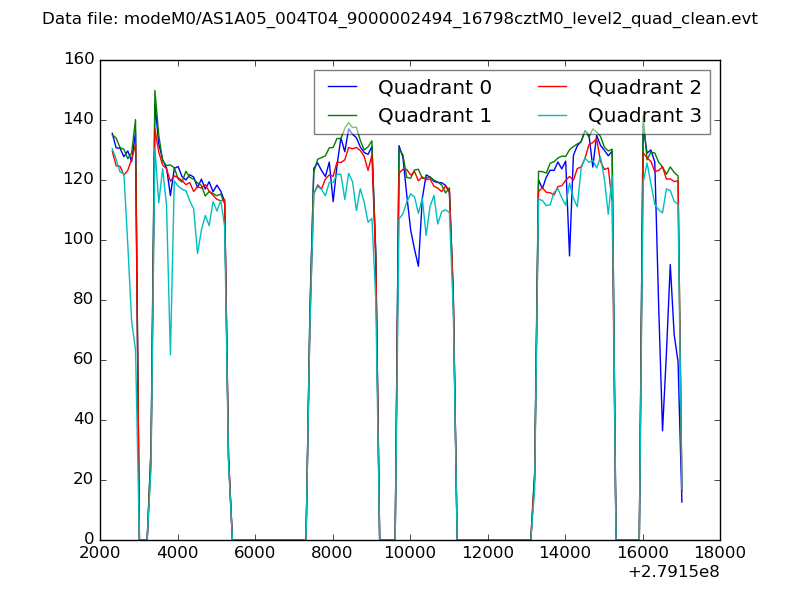 |
|
| Module-wise count rates for Quadrant A Data is divided into 100 sec bins |
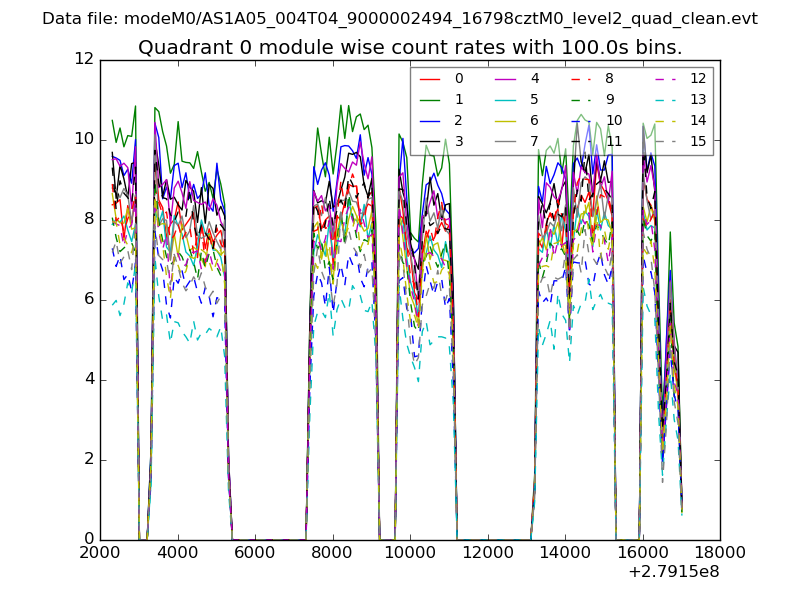 |
 |
| Module-wise count rates for Quadrant B Data is divided into 100 sec bins |
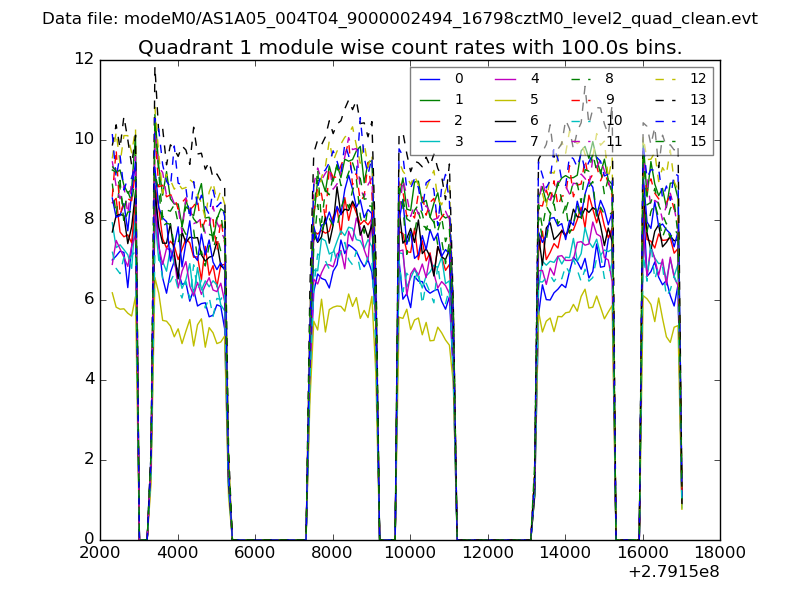 |
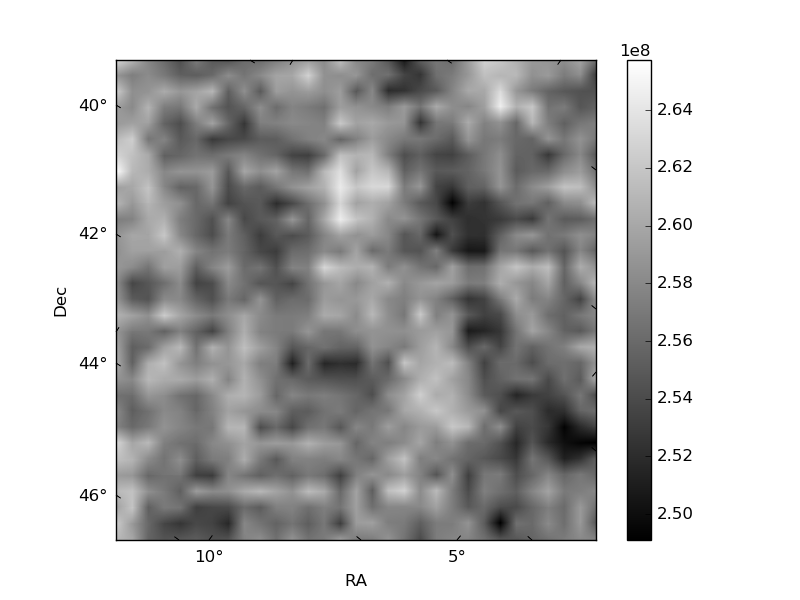 |
| Module-wise count rates for Quadrant C Data is divided into 100 sec bins |
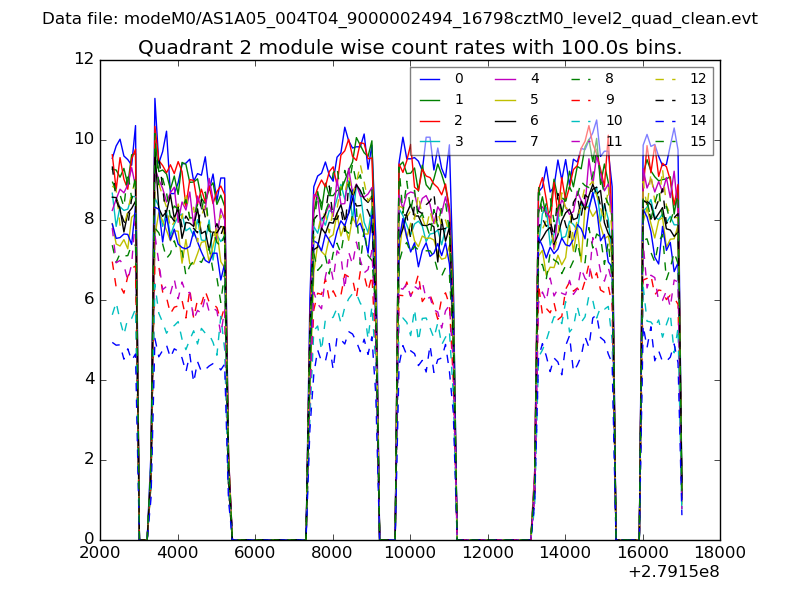 |
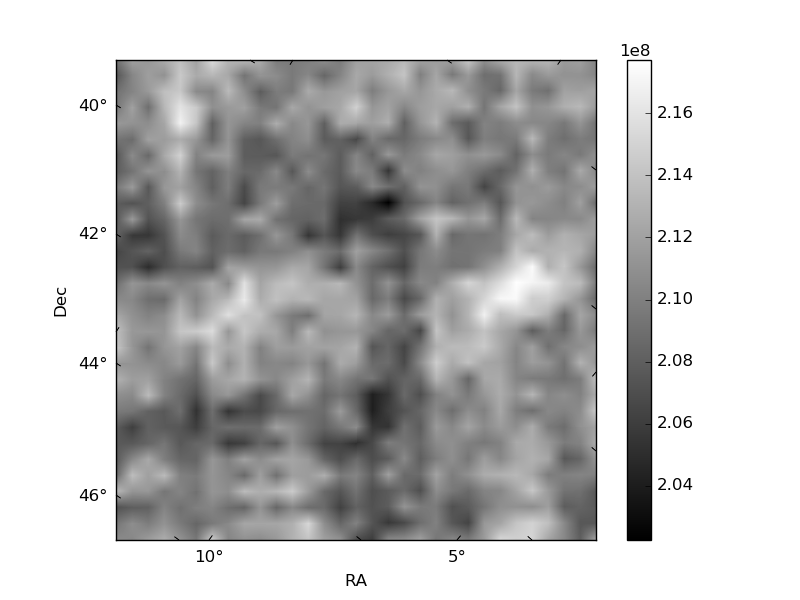 |
| Module-wise count rates for Quadrant D Data is divided into 100 sec bins |
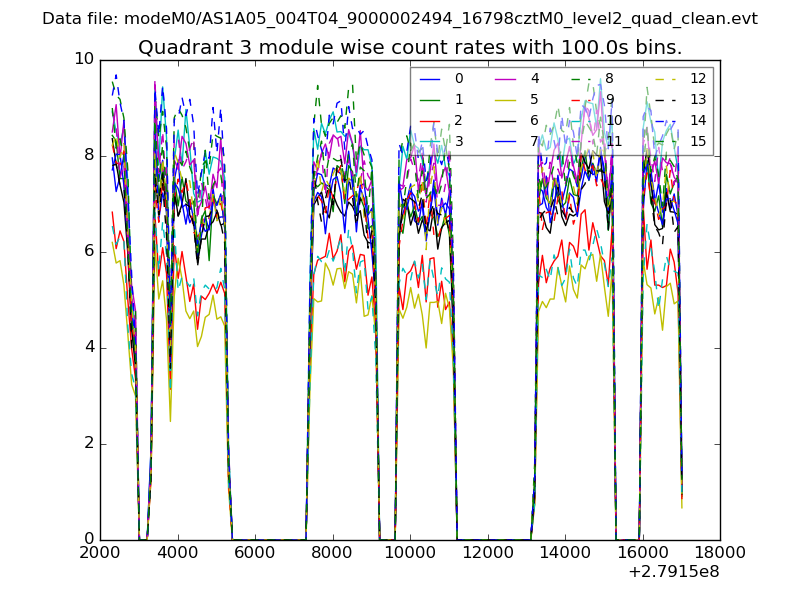 |
 |
| Parameter | Plot |
|---|---|
| CZT HV Monitor | 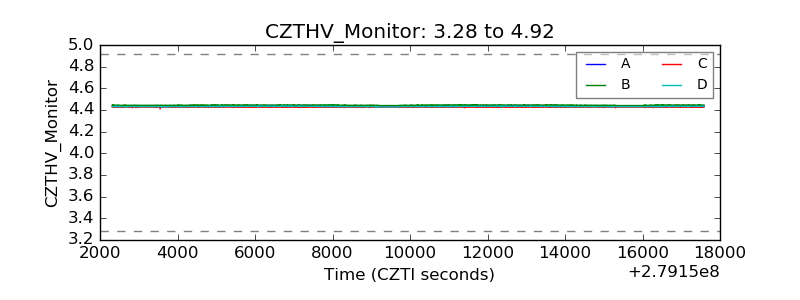 |
| D_VDD | 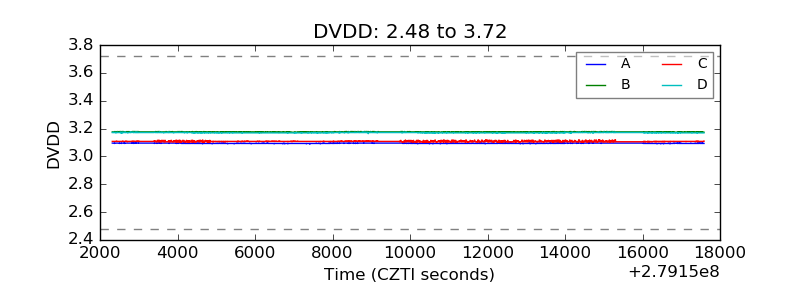 |
| Temperature 1 | 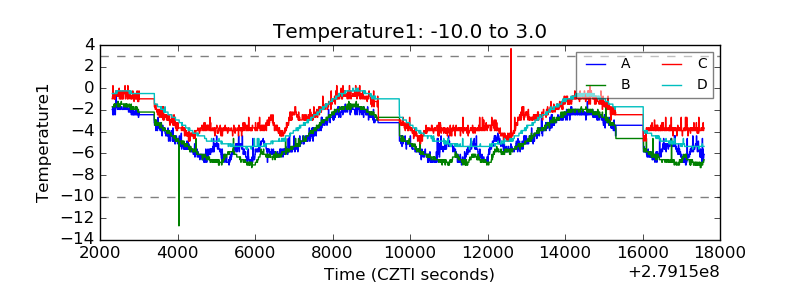 |
| Veto HV Monitor | 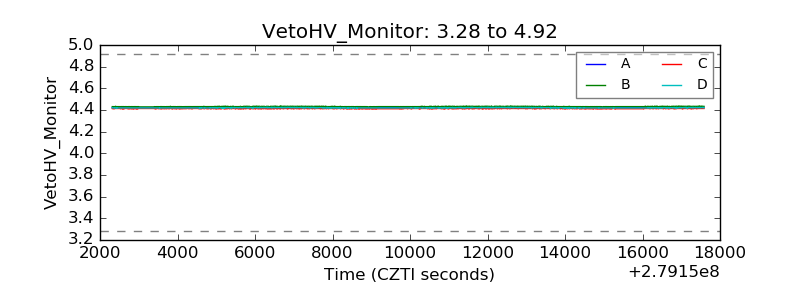 |
| Veto LLD | 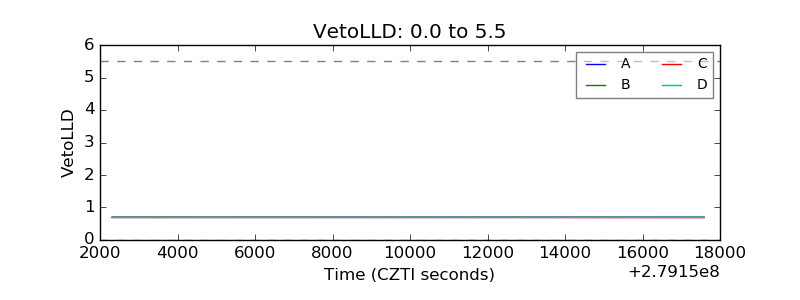 |
| Alpha Counter | 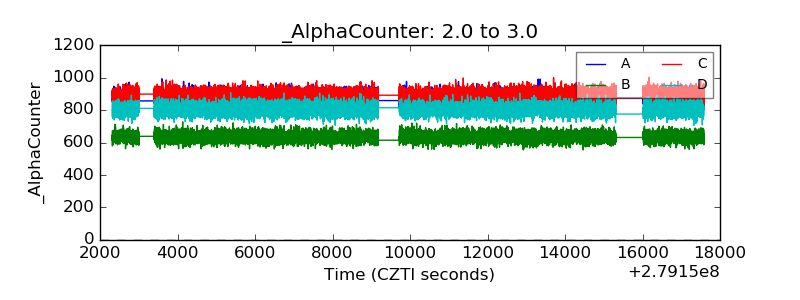 |
| _CPM_Rate | 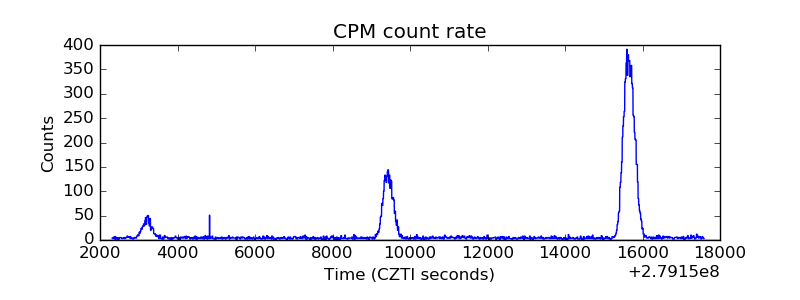 |
| CZT Counter | 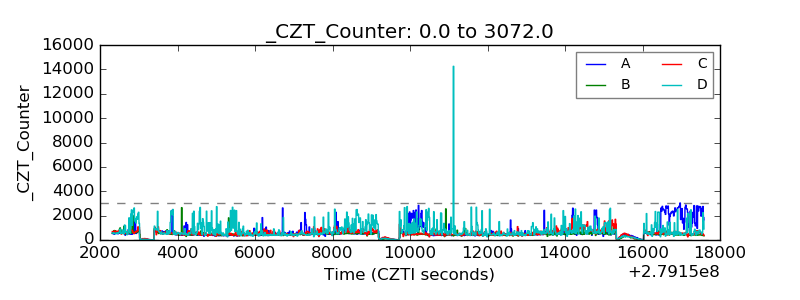 |
| +2.5 Volts monitor |  |
| +5 Volts monitor |  |
| _ROLL_ROT | 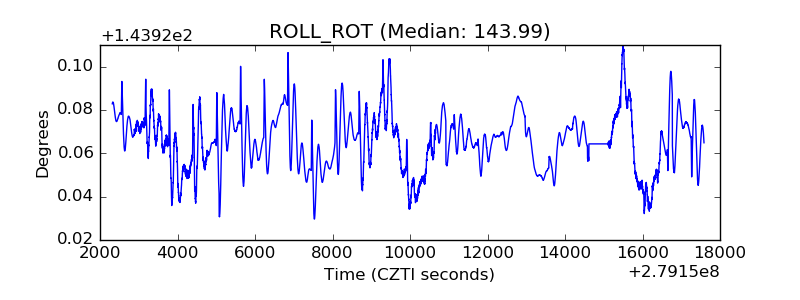 |
| _Roll_DEC | 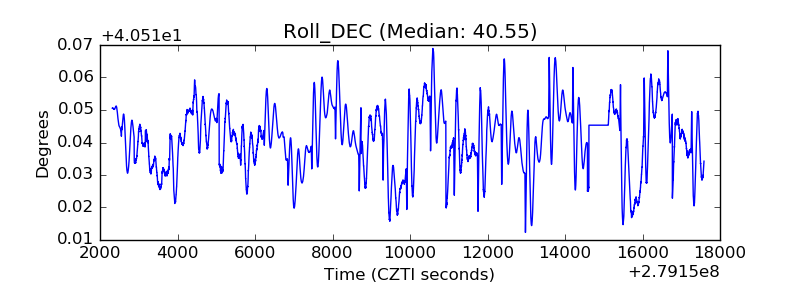 |
| _Roll_RA | 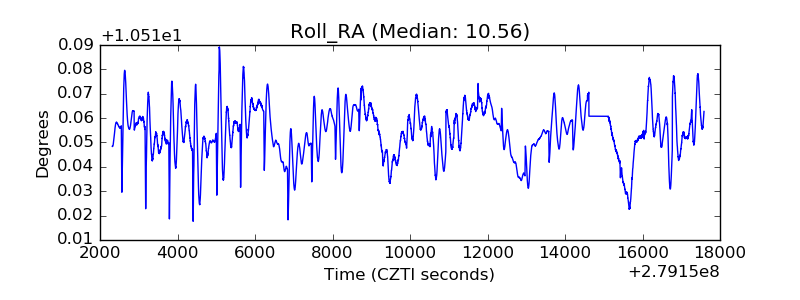 |
| Veto Counter | 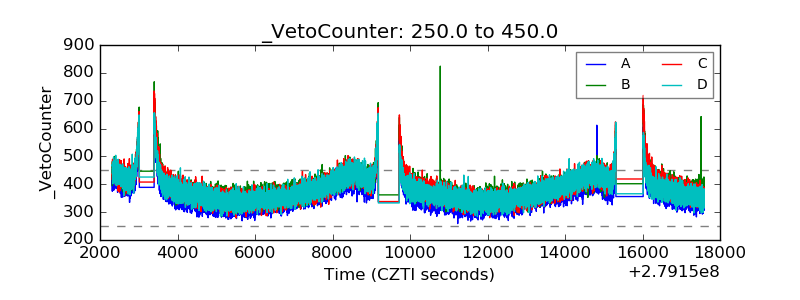 |