| Param | Original file | Final file |
|---|---|---|
| Filename | modeM0/AS1A05_004T04_9000002494_16799cztM0_level2.evt | modeM0/AS1A05_004T04_9000002494_16799cztM0_level2_quad_clean.evt |
| Size (bytes) | 761,595,840 | 79,387,200 |
| Size | 726.3 MB | 75.7 MB |
| Events in quadrant A | 9,369,187 | 423,501 |
| Events in quadrant B | 3,427,682 | 517,982 |
| Events in quadrant C | 3,907,101 | 497,741 |
| Events in quadrant D | 5,886,673 | 475,104 |
| Mode M9 | |||
|---|---|---|---|
| Quadrant | BADHDUFLAG | Total packets | Discarded packets |
| A | 0 | 16 | 0 |
| B | 0 | 16 | 0 |
| C | 0 | 16 | 0 |
| D | 0 | 16 | 0 |
| Mode M0 | |||
|---|---|---|---|
| Quadrant | BADHDUFLAG | Total packets | Discarded packets |
| A | 0 | 32433 | 3 |
| B | 0 | 14670 | 2 |
| C | 0 | 15907 | 2 |
| D | 0 | 22287 | 2 |
| Mode SS | |||
|---|---|---|---|
| Quadrant | BADHDUFLAG | Total packets | Discarded packets |
| A | 0 | 144 | 0 |
| B | 0 | 144 | 0 |
| C | 0 | 144 | 0 |
| D | 0 | 144 | 0 |
| Quadrant | Total seconds | Saturated seconds | Saturation percentage |
|---|---|---|---|
| A | 7020 | 2424 | 34.529915% |
| B | 7020 | 62 | 0.883191% |
| C | 7020 | 141 | 2.008547% |
| D | 7020 | 581 | 8.276353% |
Noise dominated data is calculated using 1-second bins in cleaned event files. If a bin has >2000 counts, and if more than 50% of those come from <1% of pixels, then it is considered to be noise-dominated and hence unusable.
| Quadrant | # 1 sec bins | Bins with >0 counts | Bins with >2000 counts | High rate bins dominated by noise | Noise dominated (total time) | Noise dominated (detector-on time) | Marked lightcurve |
|---|---|---|---|---|---|---|---|
| A | 8596 | 7023 | 2143 | 2143 | 24.93% | 30.51% | 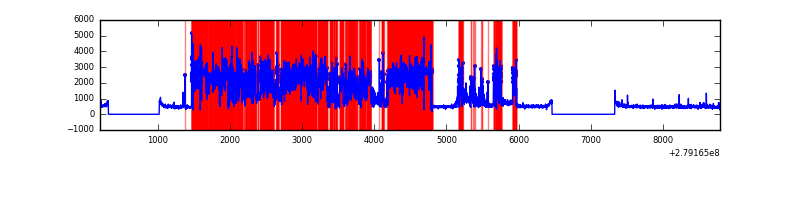 |
| B | 8596 | 7023 | 3 | 3 | 0.03% | 0.04% | 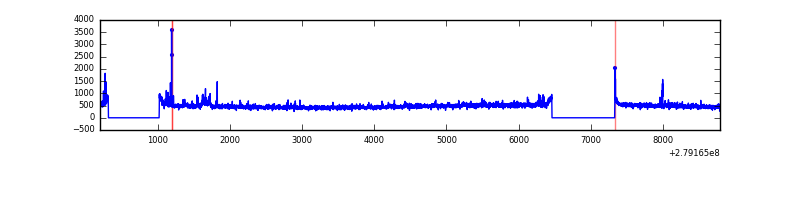 |
| C | 8596 | 7023 | 2 | 2 | 0.02% | 0.03% | 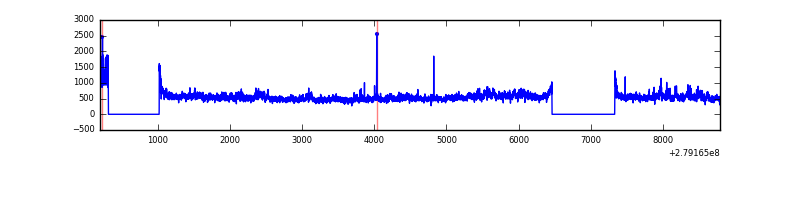 |
| D | 8596 | 7023 | 423 | 423 | 4.92% | 6.02% | 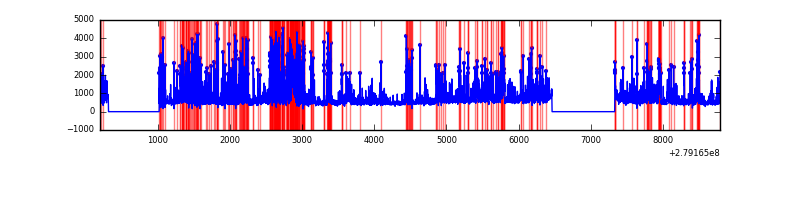 |
Top three noisy pixels from each quadrant. If the there are fewer than three noisy pixels in the level2.evt file, extra rows are filled as -1
| Pixel properties | Quadrant properties | ||||||
|---|---|---|---|---|---|---|---|
| Quadrant | DetID | PixID | Counts | Sigma | Mean | Median | Sigma |
| A | 15 | 174 | 6563198 | 45035.65 | 717 | 701 | 145.7 |
| A | 10 | 234 | 28787 | 192.74 | 717 | 701 | 145.7 |
| A | 9 | 143 | 11409 | 73.48 | 717 | 701 | 145.7 |
| B | 0 | 229 | 53894 | 326.61 | 840 | 819 | 162.5 |
| B | 0 | 189 | 37319 | 224.61 | 840 | 819 | 162.5 |
| B | 12 | 111 | 19350 | 114.04 | 840 | 819 | 162.5 |
| C | 3 | 233 | 577192 | 3047.1 | 806 | 811 | 189.2 |
| C | 14 | 238 | 123954 | 651.01 | 806 | 811 | 189.2 |
| C | 0 | 207 | 43228 | 224.24 | 806 | 811 | 189.2 |
| D | 1 | 52 | 2274247 | 11831.04 | 789 | 765 | 192.2 |
| D | 12 | 218 | 295164 | 1532.03 | 789 | 765 | 192.2 |
| D | 13 | 248 | 248815 | 1290.83 | 789 | 765 | 192.2 |
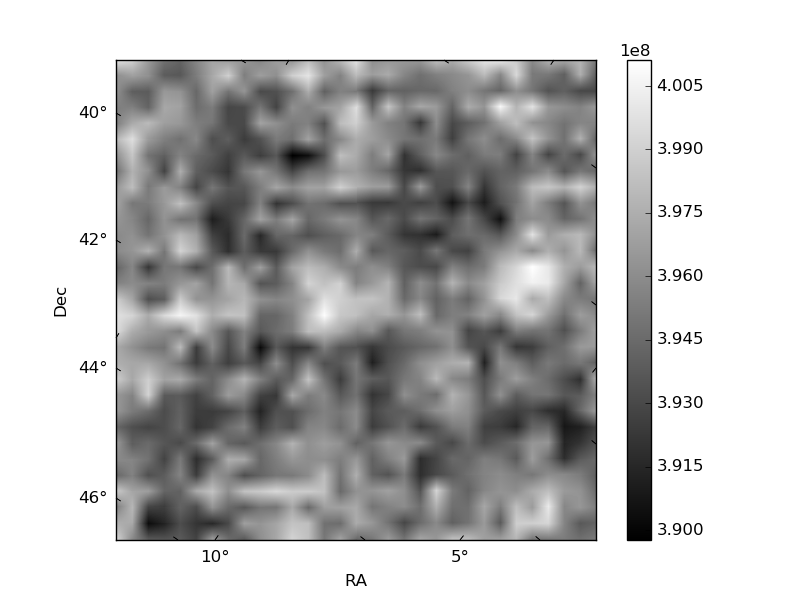
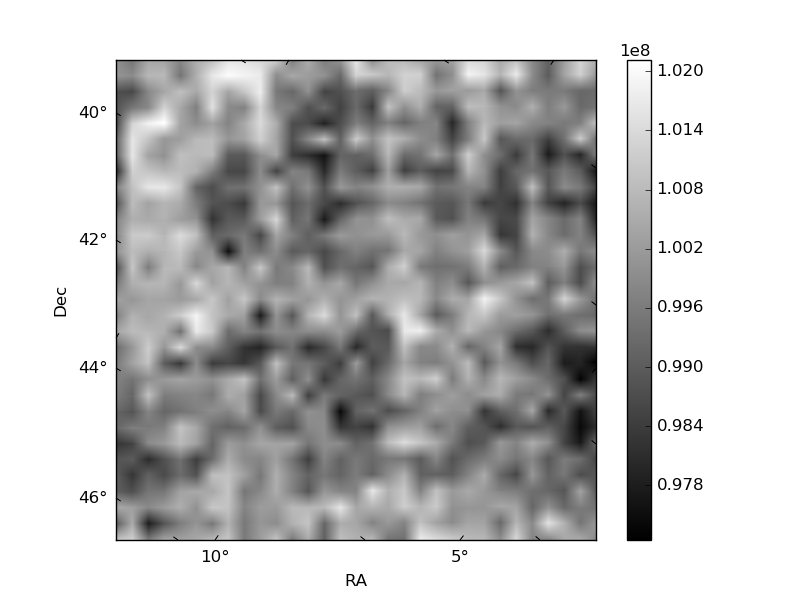
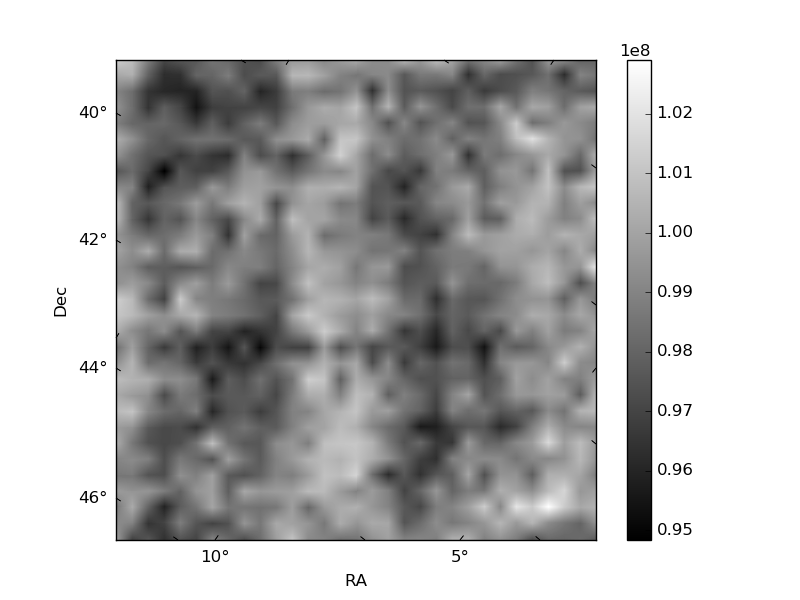
Histogram calculated using DETX and DETY for each event in the final _common_clean file
| Quadrant A | 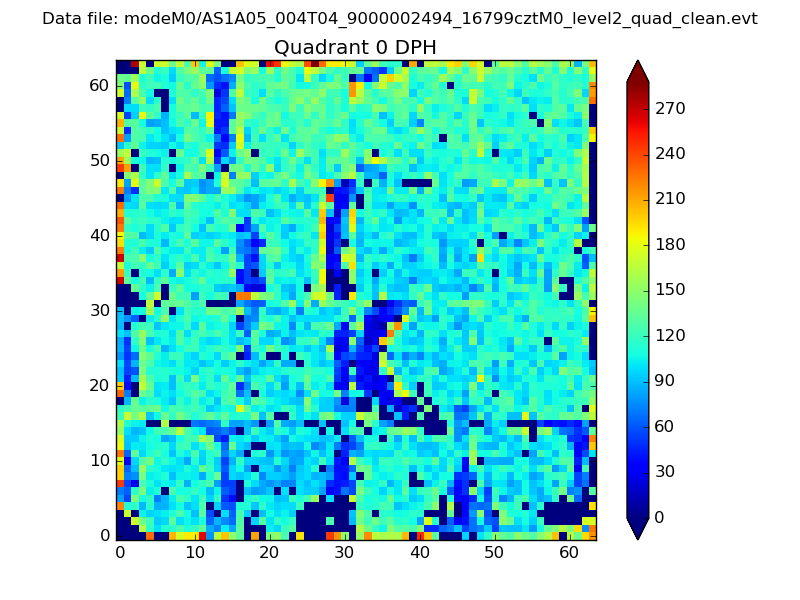 |
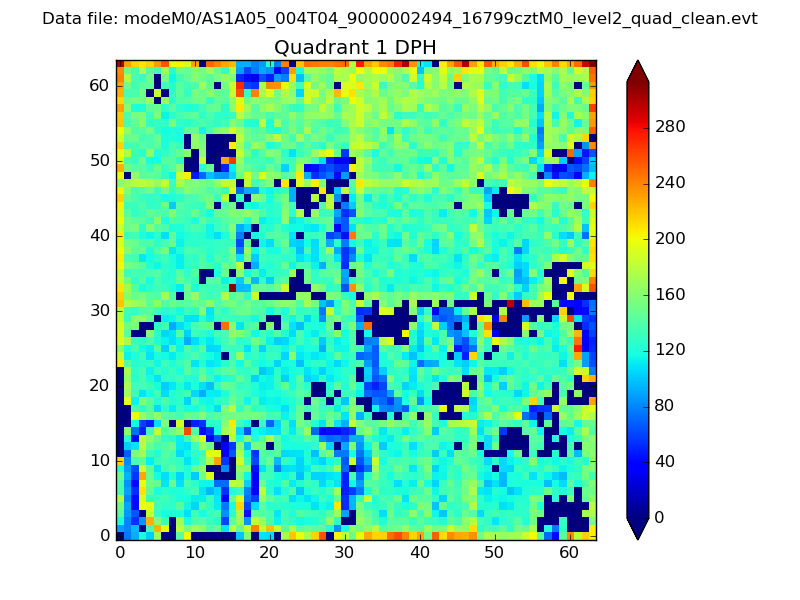 |
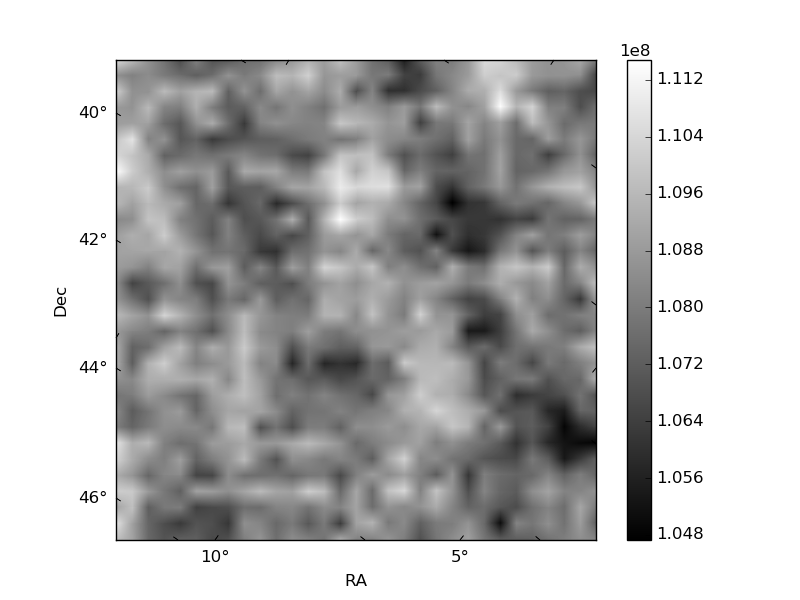
Quadrant B |
|---|---|---|---|
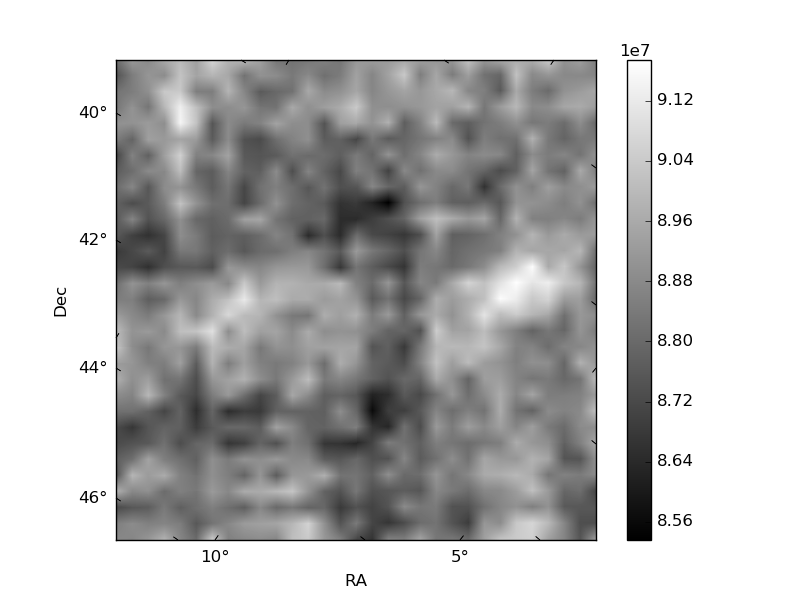
| Quadrant D | 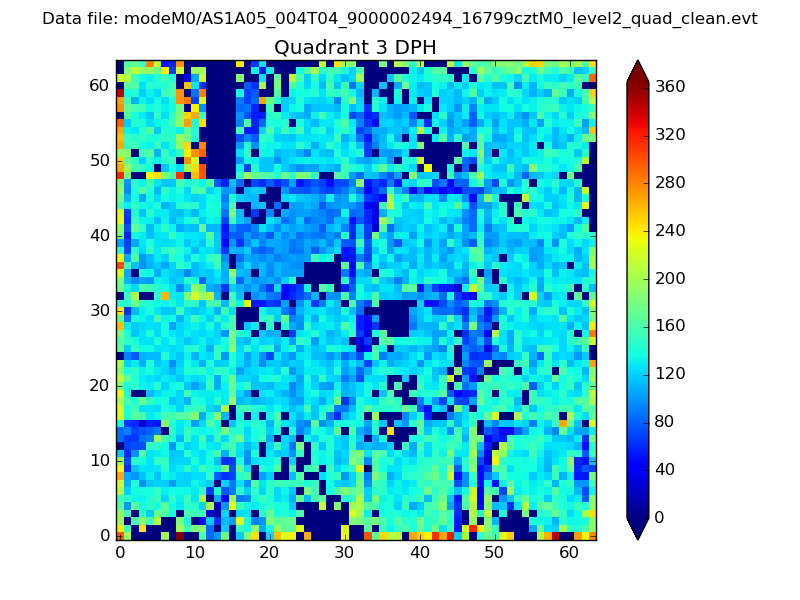 |
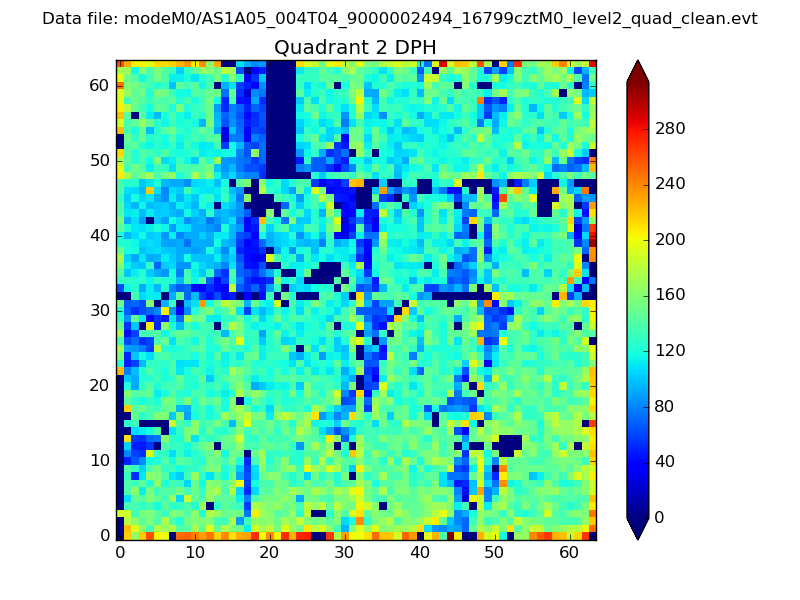 |
Quadrant C |
| Plot type | Count rate plots | Images |
|---|---|---|
| Comparison with Poisson distribution Blue bars denote a histogram of data divided into 1 sec bins. Red curve is a Poisson curve with rate = median count rate of data. |
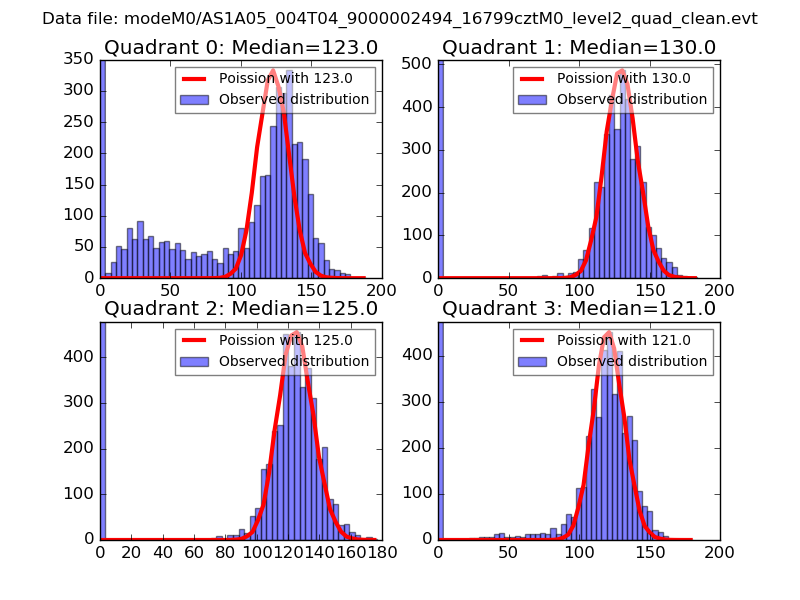 |
 |
| Quadrant-wise count rates Data is divided into 100 sec bins |
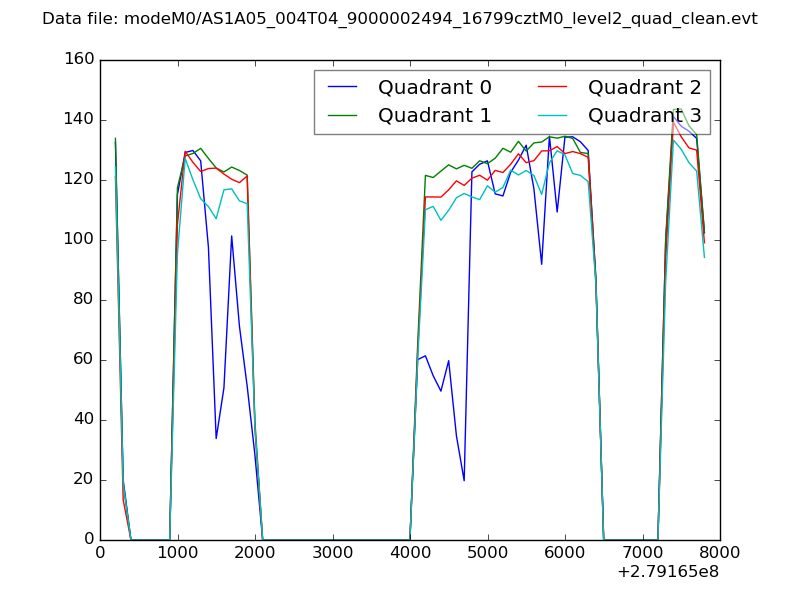 |
|
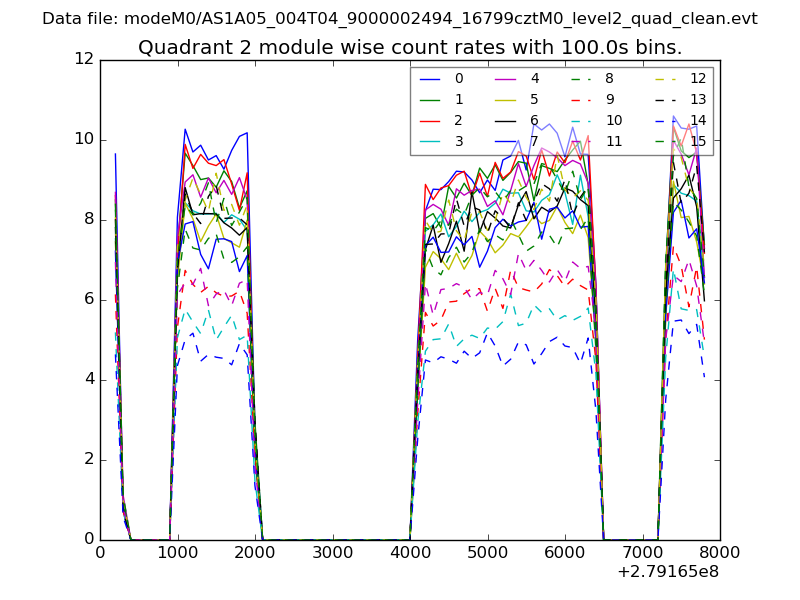
| Module-wise count rates for Quadrant A Data is divided into 100 sec bins |
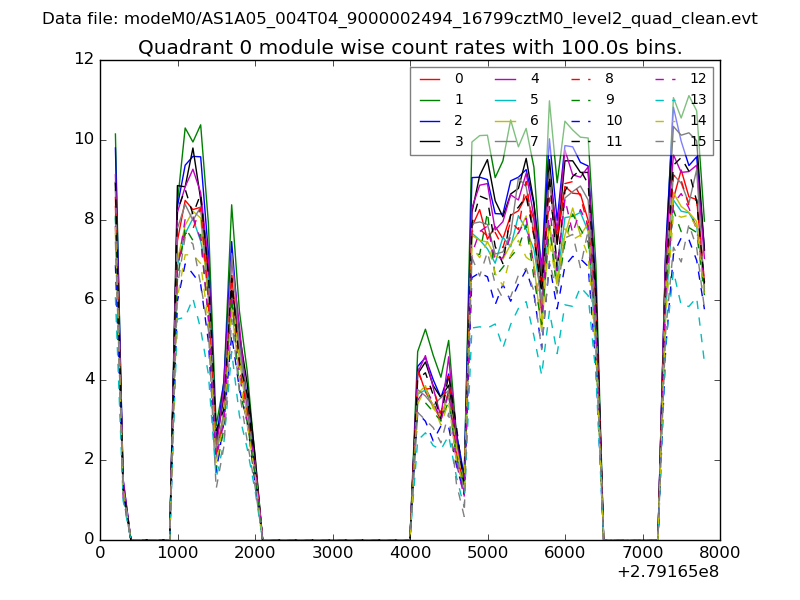 |
 |
| Module-wise count rates for Quadrant B Data is divided into 100 sec bins |
 |
 |
| Module-wise count rates for Quadrant C Data is divided into 100 sec bins |
 |
 |
| Module-wise count rates for Quadrant D Data is divided into 100 sec bins |
 |
 |
| Parameter | Plot |
|---|---|
| CZT HV Monitor |  |
| D_VDD |  |
| Temperature 1 | 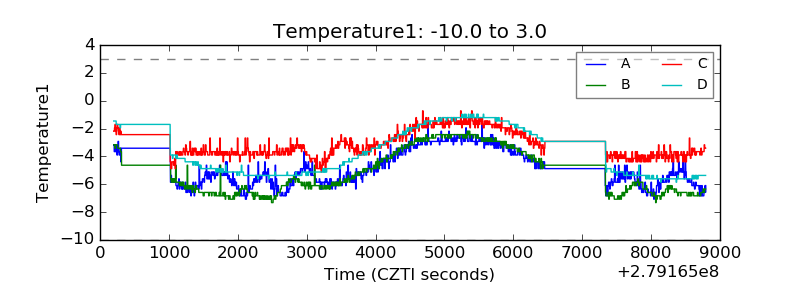 |
| Veto HV Monitor | 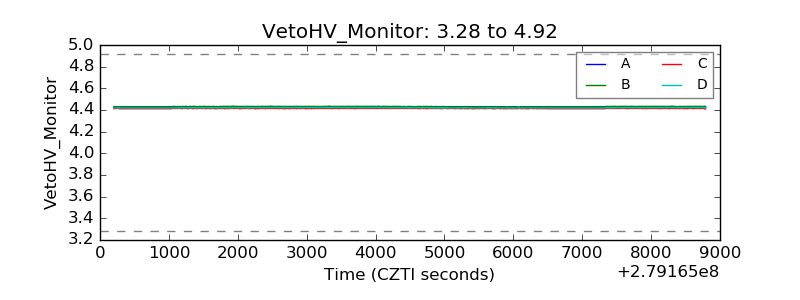 |
| Veto LLD |  |
| Alpha Counter | 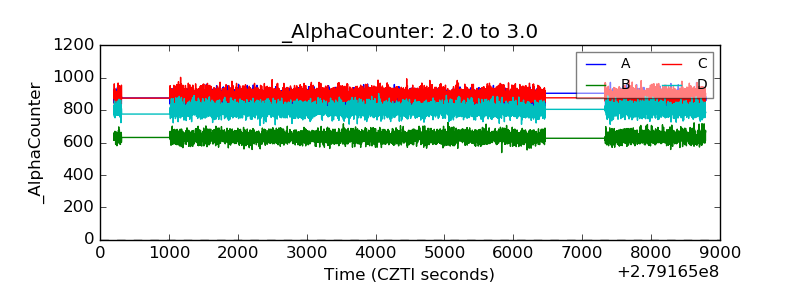 |
| _CPM_Rate |  |
| CZT Counter | 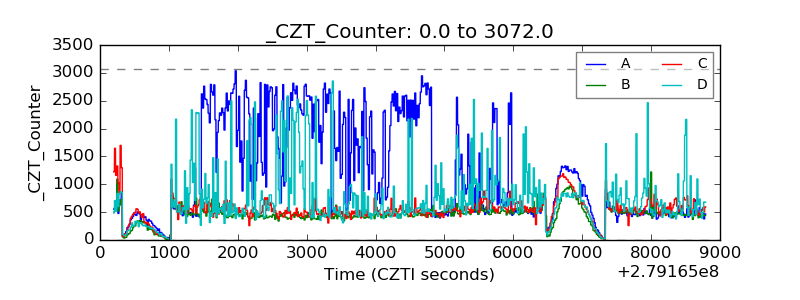 |
| +2.5 Volts monitor |  |
| +5 Volts monitor |  |
| _ROLL_ROT |  |
| _Roll_DEC | 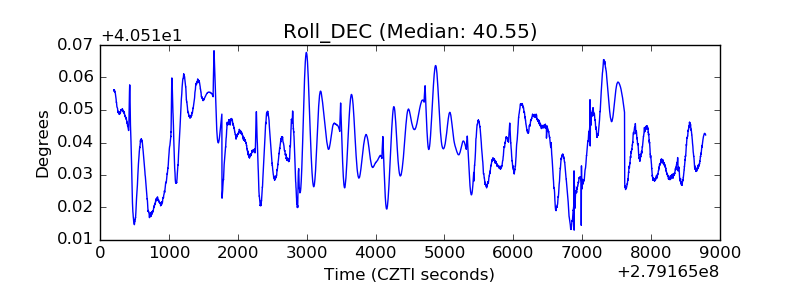 |
| _Roll_RA | 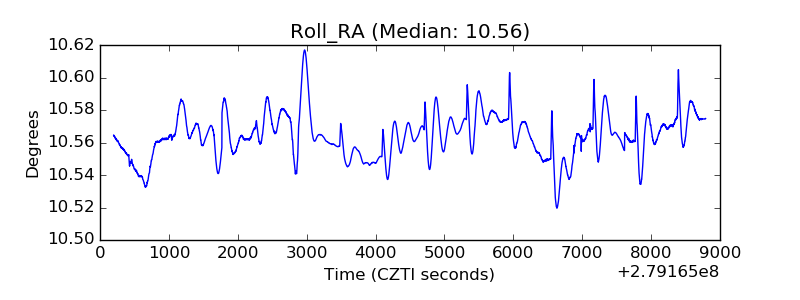 |
| Veto Counter | 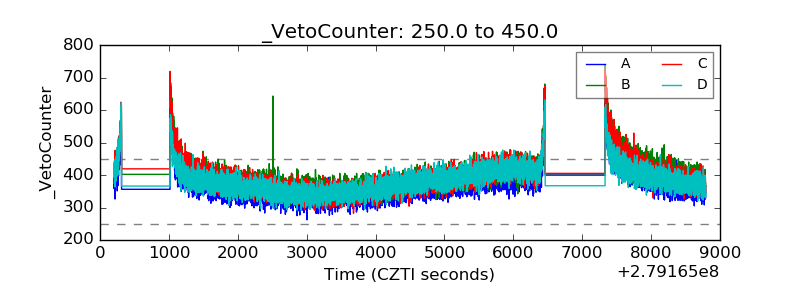 |