| Param | Original file | Final file |
|---|---|---|
| Filename | modeM0/AS1A05_004T04_9000002494_16804cztM0_level2.evt | modeM0/AS1A05_004T04_9000002494_16804cztM0_level2_quad_clean.evt |
| Size (bytes) | 684,633,600 | 84,994,560 |
| Size | 652.9 MB | 81.1 MB |
| Events in quadrant A | 5,350,016 | 534,017 |
| Events in quadrant B | 3,658,663 | 572,500 |
| Events in quadrant C | 4,177,834 | 535,354 |
| Events in quadrant D | 7,120,442 | 490,155 |
| Mode M9 | |||
|---|---|---|---|
| Quadrant | BADHDUFLAG | Total packets | Discarded packets |
| A | 0 | 18 | 0 |
| B | 0 | 18 | 0 |
| C | 0 | 18 | 0 |
| D | 0 | 19 | 0 |
| Mode M0 | |||
|---|---|---|---|
| Quadrant | BADHDUFLAG | Total packets | Discarded packets |
| A | 0 | 20184 | 3 |
| B | 0 | 14861 | 2 |
| C | 0 | 16598 | 2 |
| D | 0 | 25536 | 2 |
| Mode SS | |||
|---|---|---|---|
| Quadrant | BADHDUFLAG | Total packets | Discarded packets |
| A | 0 | 128 | 0 |
| B | 0 | 128 | 0 |
| C | 0 | 128 | 0 |
| D | 0 | 128 | 0 |
| Quadrant | Total seconds | Saturated seconds | Saturation percentage |
|---|---|---|---|
| A | 6326 | 625 | 9.879861% |
| B | 6326 | 167 | 2.639899% |
| C | 6326 | 191 | 3.019285% |
| D | 6326 | 1172 | 18.526715% |
Noise dominated data is calculated using 1-second bins in cleaned event files. If a bin has >2000 counts, and if more than 50% of those come from <1% of pixels, then it is considered to be noise-dominated and hence unusable.
| Quadrant | # 1 sec bins | Bins with >0 counts | Bins with >2000 counts | High rate bins dominated by noise | Noise dominated (total time) | Noise dominated (detector-on time) | Marked lightcurve |
|---|---|---|---|---|---|---|---|
| A | 7597 | 6327 | 363 | 363 | 4.78% | 5.74% | 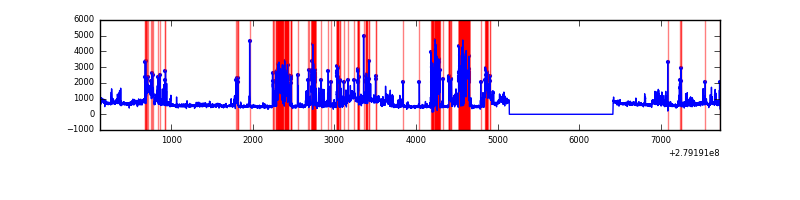 |
| B | 7597 | 6327 | 2 | 2 | 0.03% | 0.03% | 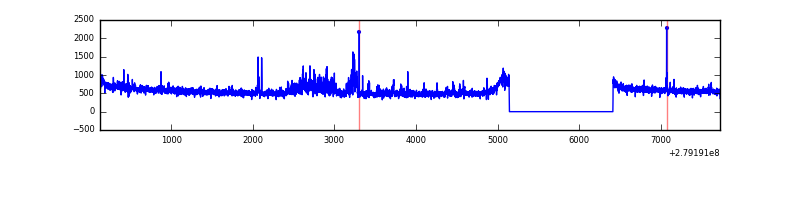 |
| C | 7597 | 6328 | 0 | 0 | 0.00% | 0.00% | 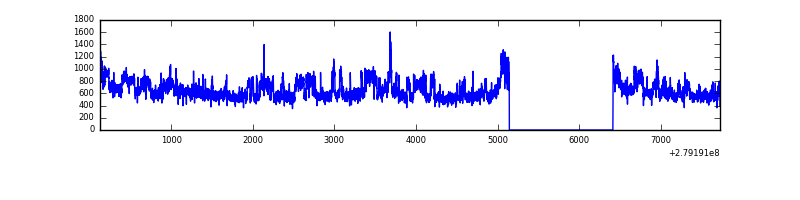 |
| D | 7597 | 6328 | 859 | 859 | 11.31% | 13.57% | 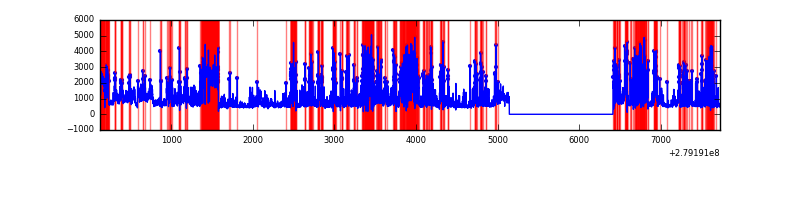 |
Top three noisy pixels from each quadrant. If the there are fewer than three noisy pixels in the level2.evt file, extra rows are filled as -1
| Pixel properties | Quadrant properties | ||||||
|---|---|---|---|---|---|---|---|
| Quadrant | DetID | PixID | Counts | Sigma | Mean | Median | Sigma |
| A | 15 | 174 | 1859387 | 10930.41 | 859 | 844 | 170.0 |
| A | 9 | 143 | 140913 | 823.77 | 859 | 844 | 170.0 |
| A | 15 | 190 | 28499 | 162.64 | 859 | 844 | 170.0 |
| B | 15 | 35 | 180961 | 1101.12 | 871 | 851 | 163.6 |
| B | 0 | 229 | 32051 | 190.74 | 871 | 851 | 163.6 |
| B | 0 | 214 | 20561 | 120.5 | 871 | 851 | 163.6 |
| C | 3 | 233 | 797400 | 4206.65 | 821 | 828 | 189.4 |
| C | 14 | 238 | 130184 | 683.12 | 821 | 828 | 189.4 |
| C | 7 | 247 | 42303 | 219.03 | 821 | 828 | 189.4 |
| D | 1 | 52 | 3097889 | 16463.56 | 776 | 756 | 188.1 |
| D | 2 | 33 | 721666 | 3832.17 | 776 | 756 | 188.1 |
| D | 12 | 218 | 152371 | 805.95 | 776 | 756 | 188.1 |
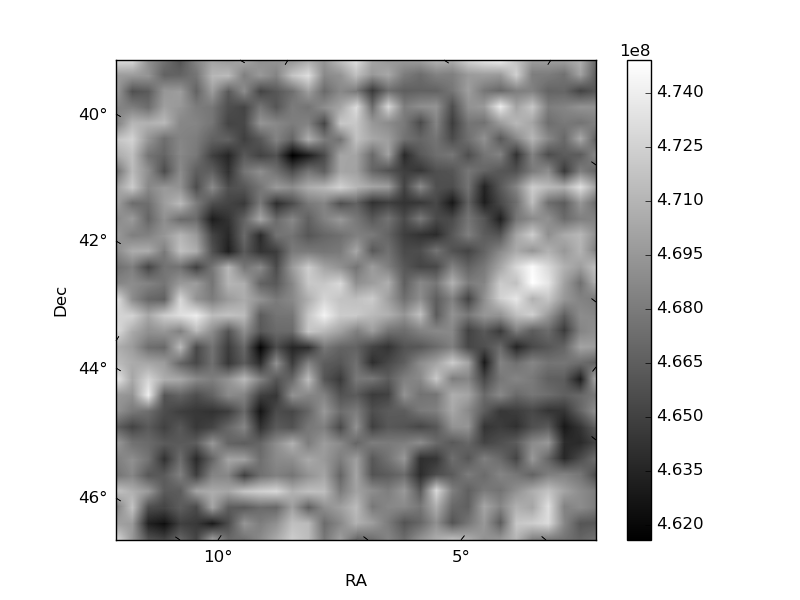
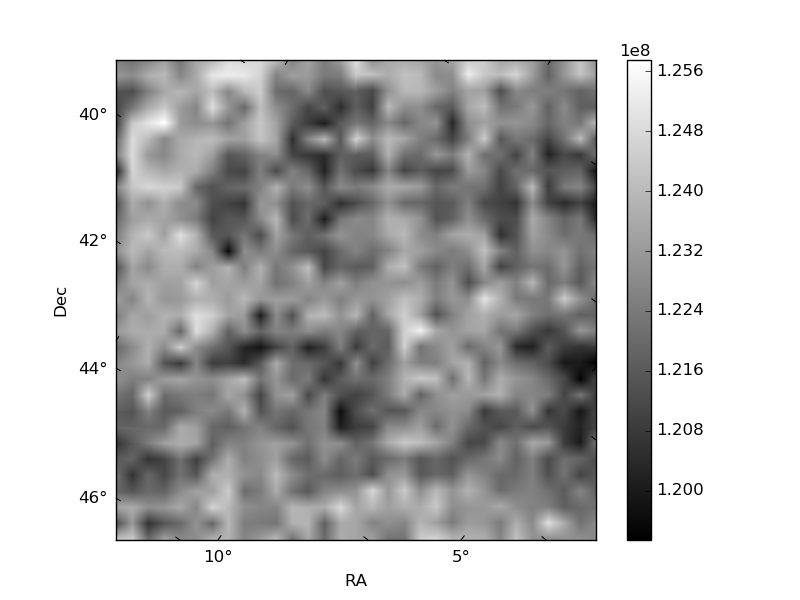
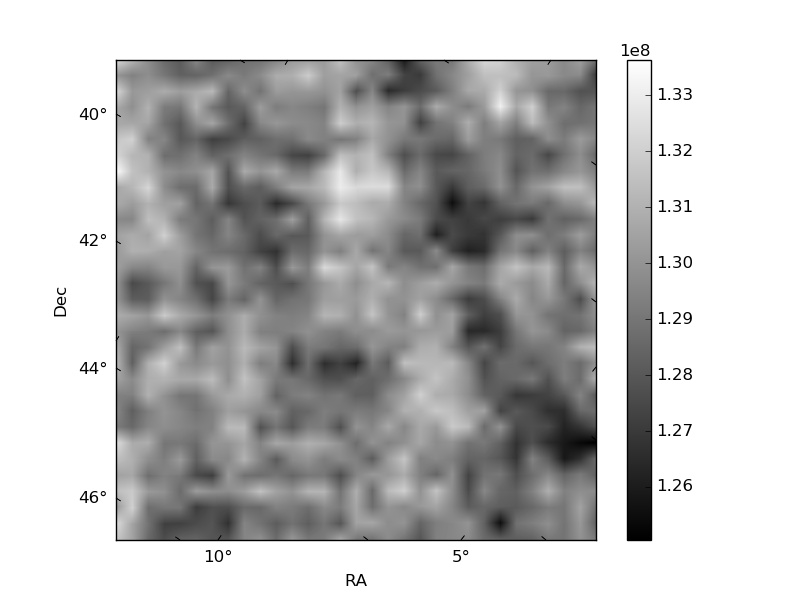
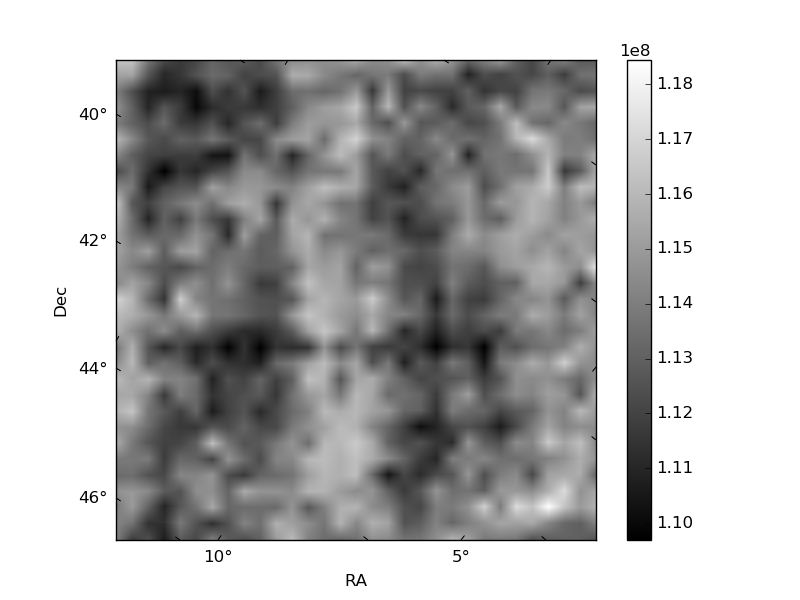
Histogram calculated using DETX and DETY for each event in the final _common_clean file
| Quadrant A | 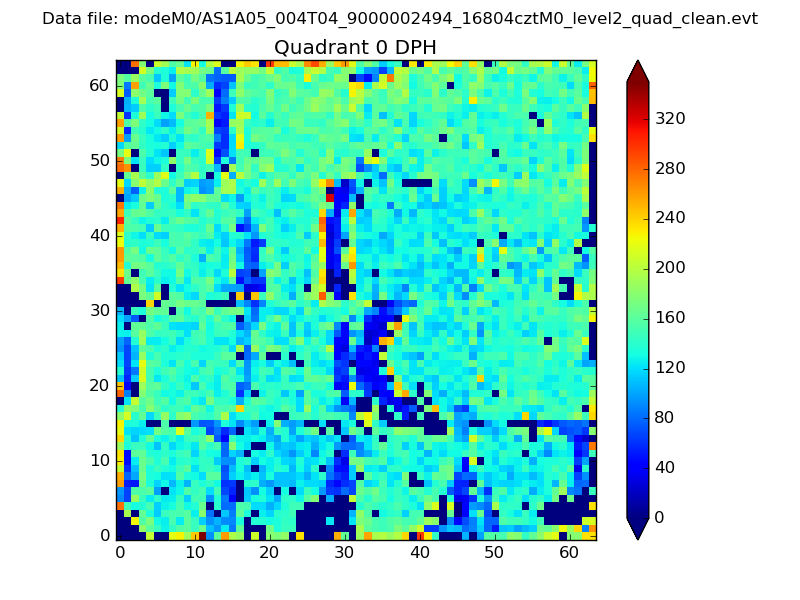 |
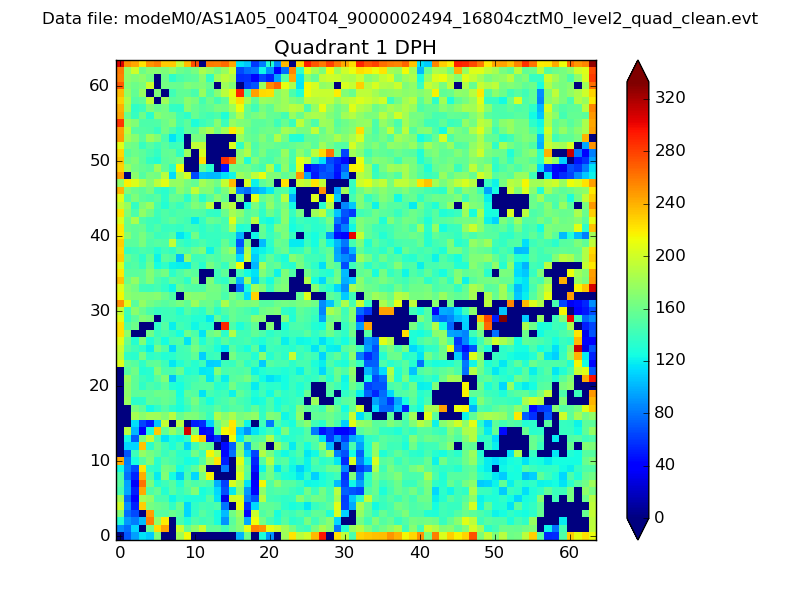 |
Quadrant B |
|---|---|---|---|
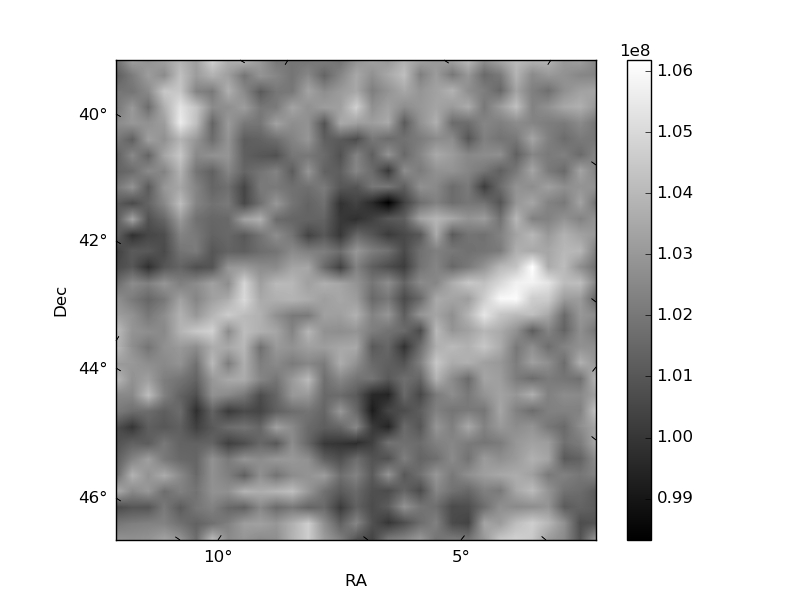
| Quadrant D |  |
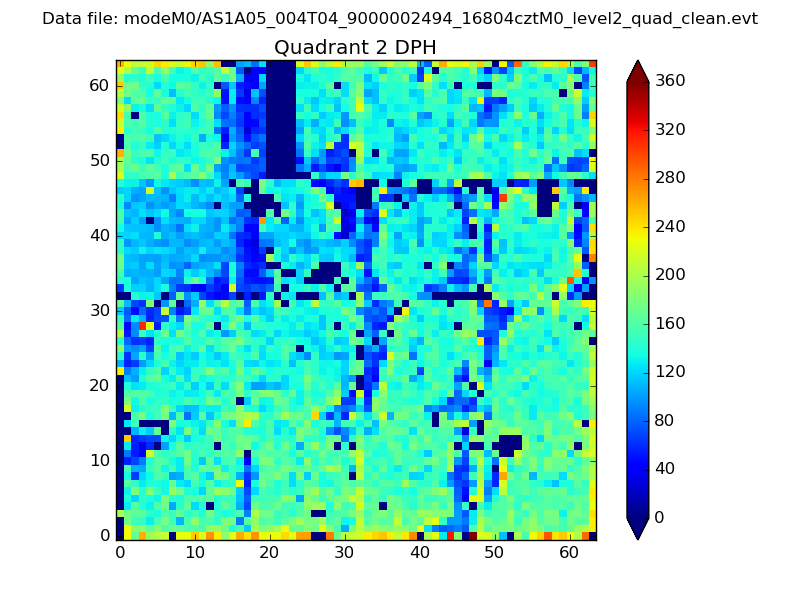 |
Quadrant C |
| Plot type | Count rate plots | Images |
|---|---|---|
| Comparison with Poisson distribution Blue bars denote a histogram of data divided into 1 sec bins. Red curve is a Poisson curve with rate = median count rate of data. |
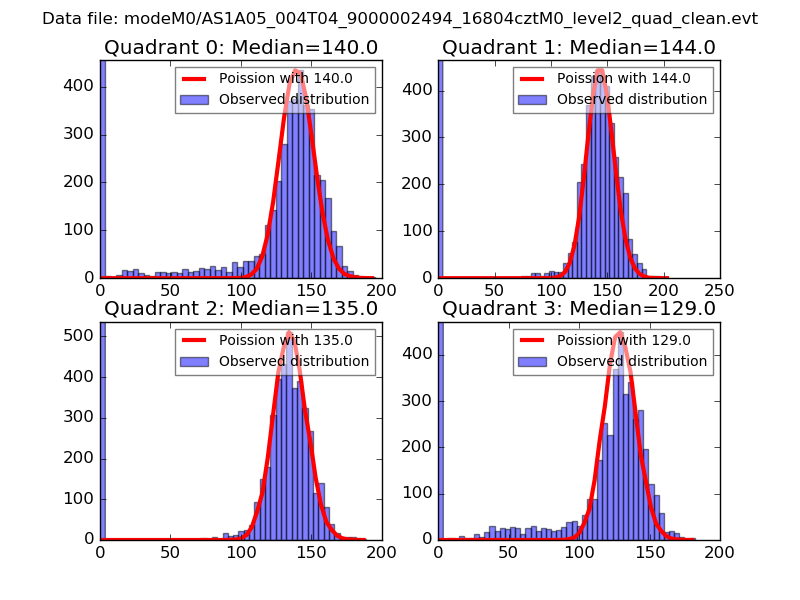 |
 |
| Quadrant-wise count rates Data is divided into 100 sec bins |
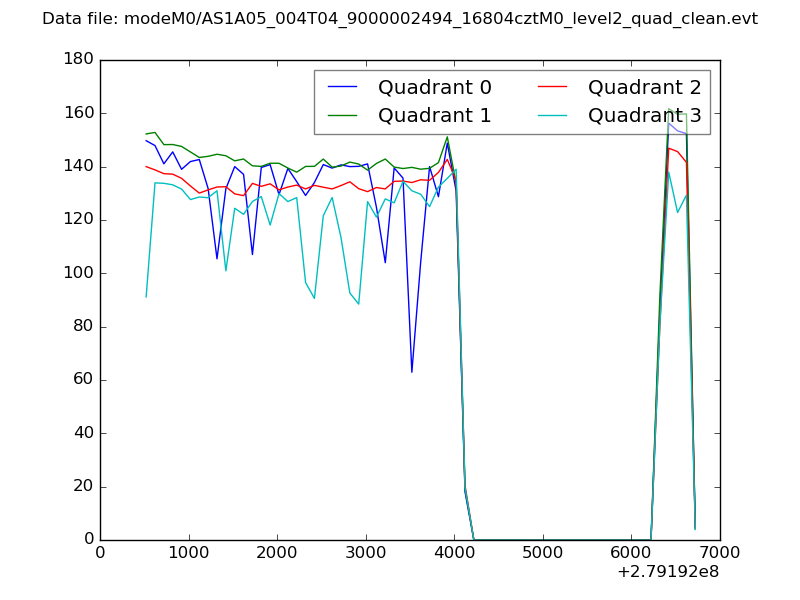 |
|
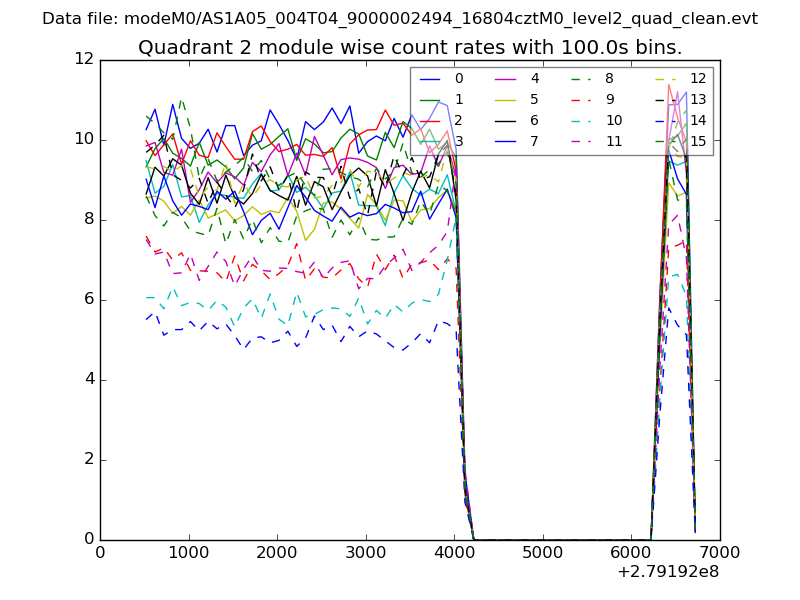
| Module-wise count rates for Quadrant A Data is divided into 100 sec bins |
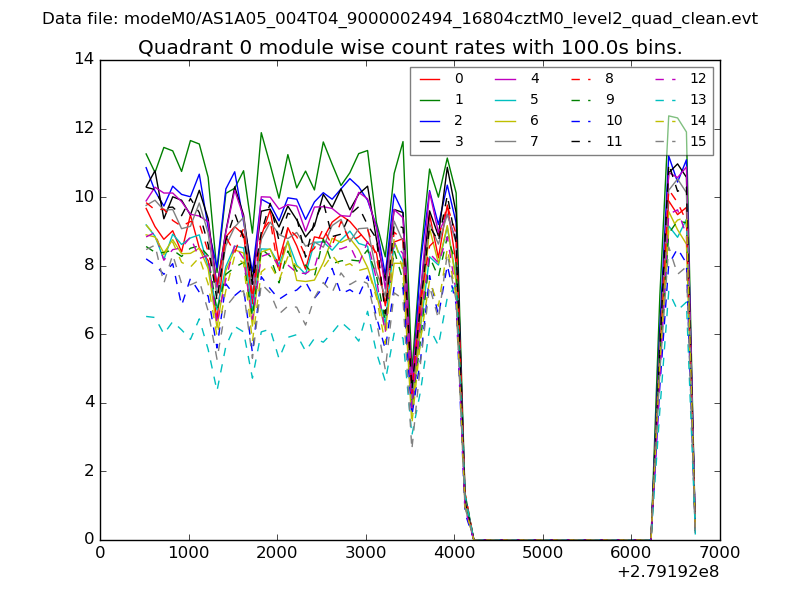 |
 |
| Module-wise count rates for Quadrant B Data is divided into 100 sec bins |
 |
 |
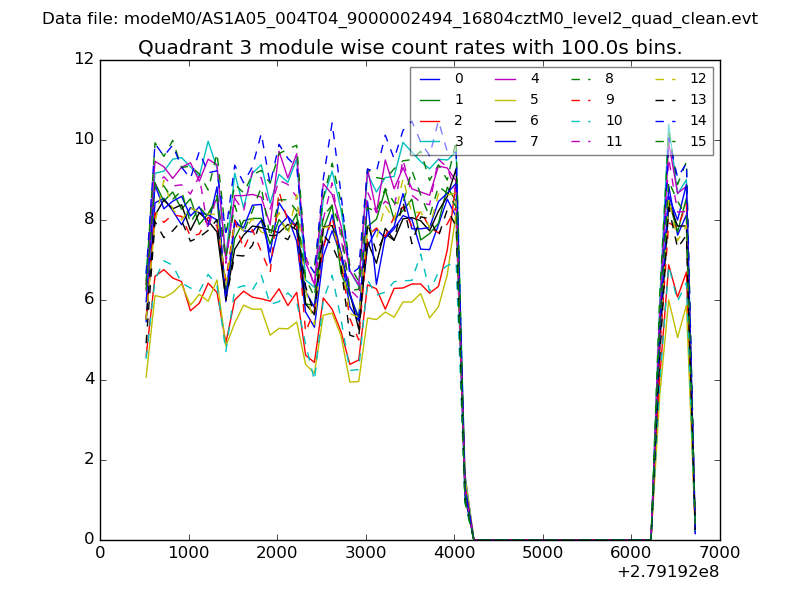
| Module-wise count rates for Quadrant C Data is divided into 100 sec bins |
 |
 |
| Module-wise count rates for Quadrant D Data is divided into 100 sec bins |
 |
 |
| Parameter | Plot |
|---|---|
| CZT HV Monitor | 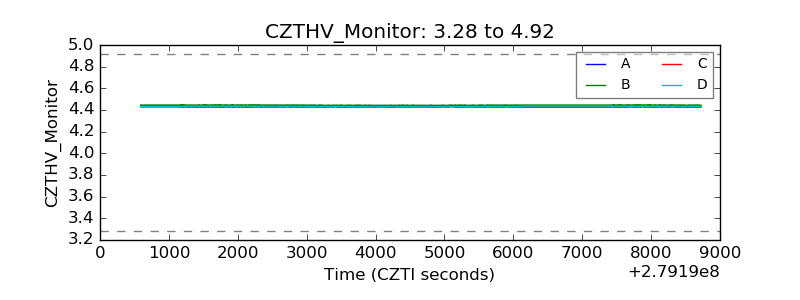 |
| D_VDD | 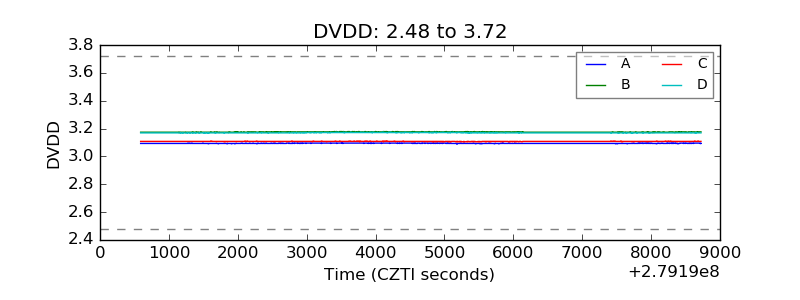 |
| Temperature 1 | 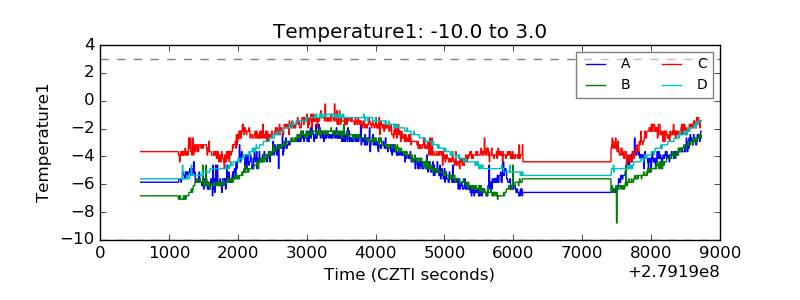 |
| Veto HV Monitor | 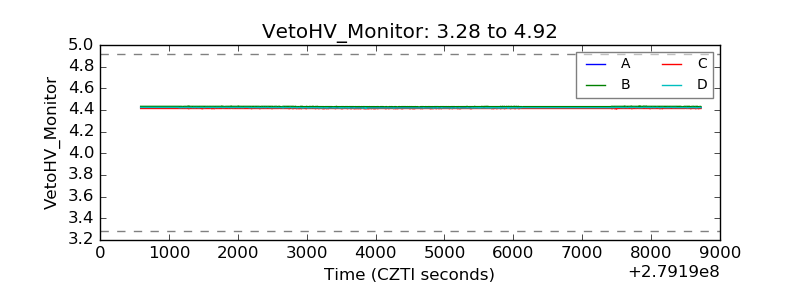 |
| Veto LLD |  |
| Alpha Counter | 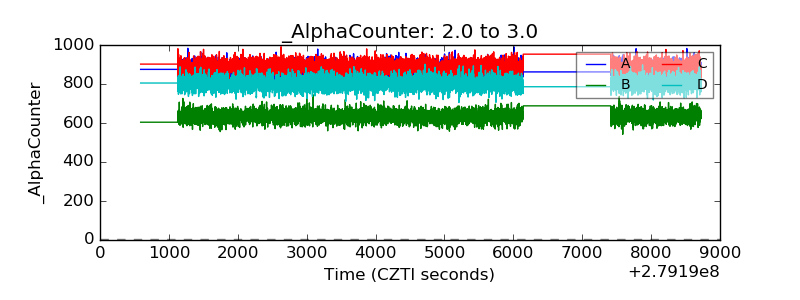 |
| _CPM_Rate | 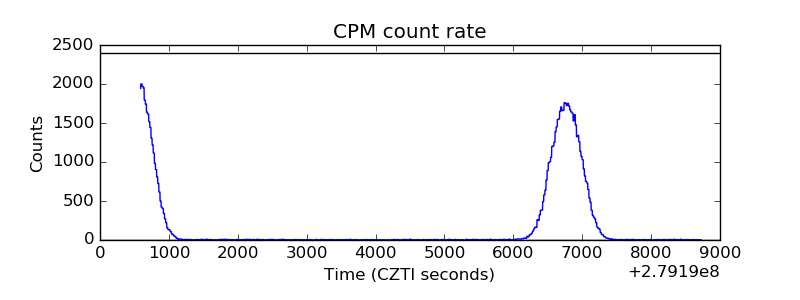 |
| CZT Counter | 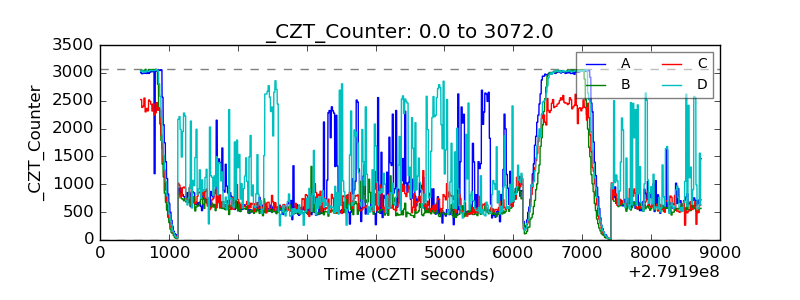 |
| +2.5 Volts monitor |  |
| +5 Volts monitor |  |
| _ROLL_ROT | 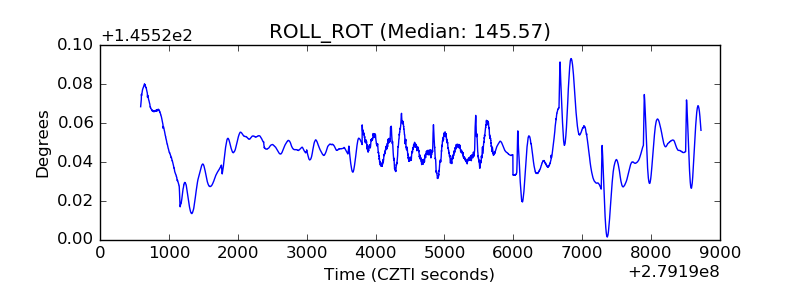 |
| _Roll_DEC | 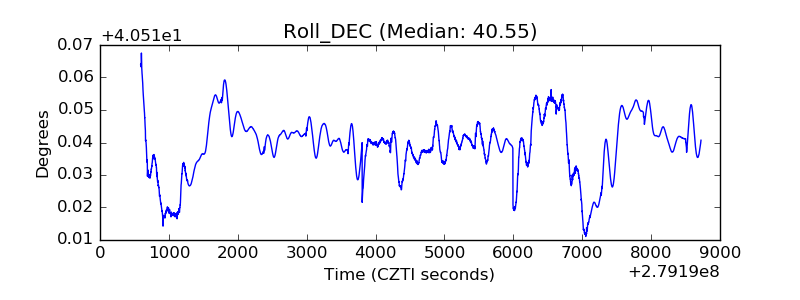 |
| _Roll_RA | 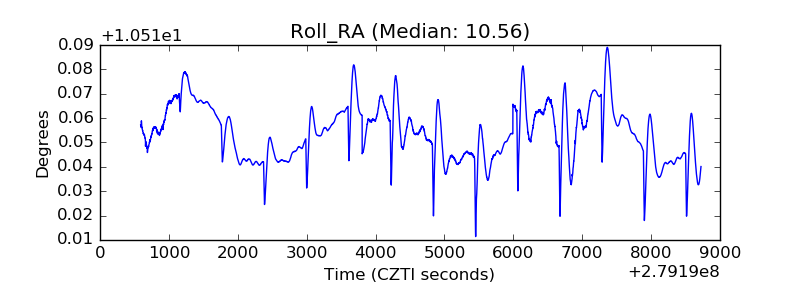 |
| Veto Counter | 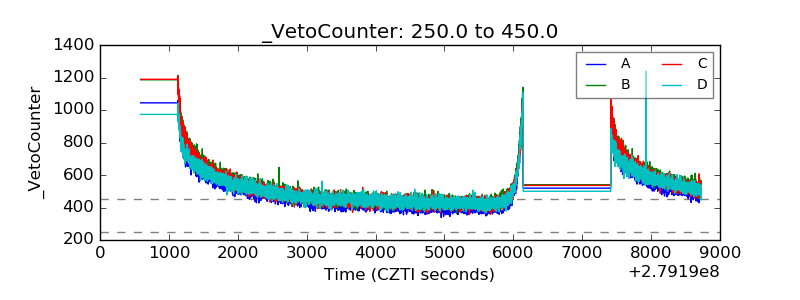 |