| Param | Original file | Final file |
|---|---|---|
| Filename | modeM0/AS1A05_004T04_9000002494_16806cztM0_level2.evt | modeM0/AS1A05_004T04_9000002494_16806cztM0_level2_quad_clean.evt |
| Size (bytes) | 505,549,440 | 105,926,400 |
| Size | 482.1 MB | 101.0 MB |
| Events in quadrant A | 4,712,453 | 706,587 |
| Events in quadrant B | 3,408,186 | 719,760 |
| Events in quadrant C | 3,123,825 | 682,737 |
| Events in quadrant D | 3,654,633 | 675,527 |
| Mode M9 | |||
|---|---|---|---|
| Quadrant | BADHDUFLAG | Total packets | Discarded packets |
| A | 0 | 11 | 0 |
| B | 0 | 11 | 0 |
| C | 0 | 11 | 0 |
| D | 0 | 11 | 0 |
| Mode M0 | |||
|---|---|---|---|
| Quadrant | BADHDUFLAG | Total packets | Discarded packets |
| A | 0 | 17855 | 2 |
| B | 0 | 13779 | 1 |
| C | 0 | 12812 | 1 |
| D | 0 | 14659 | 1 |
| Mode SS | |||
|---|---|---|---|
| Quadrant | BADHDUFLAG | Total packets | Discarded packets |
| A | 0 | 126 | 0 |
| B | 0 | 126 | 0 |
| C | 0 | 126 | 0 |
| D | 0 | 126 | 0 |
| Quadrant | Total seconds | Saturated seconds | Saturation percentage |
|---|---|---|---|
| A | 6053 | 606 | 10.011565% |
| B | 6053 | 138 | 2.279861% |
| C | 6053 | 131 | 2.164216% |
| D | 6053 | 148 | 2.445069% |
Noise dominated data is calculated using 1-second bins in cleaned event files. If a bin has >2000 counts, and if more than 50% of those come from <1% of pixels, then it is considered to be noise-dominated and hence unusable.
| Quadrant | # 1 sec bins | Bins with >0 counts | Bins with >2000 counts | High rate bins dominated by noise | Noise dominated (total time) | Noise dominated (detector-on time) | Marked lightcurve |
|---|---|---|---|---|---|---|---|
| A | 7229 | 6055 | 417 | 417 | 5.77% | 6.89% | 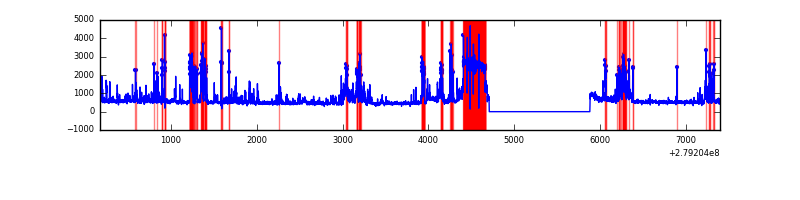 |
| B | 7229 | 6055 | 6 | 6 | 0.08% | 0.10% | 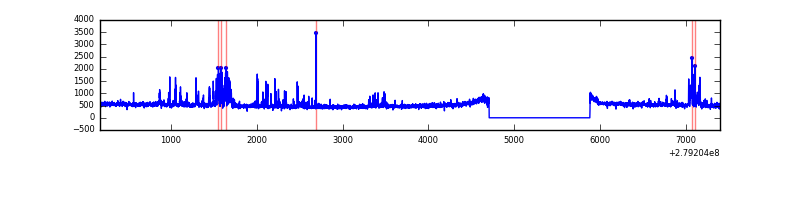 |
| C | 7229 | 6055 | 0 | 0 | 0.00% | 0.00% | 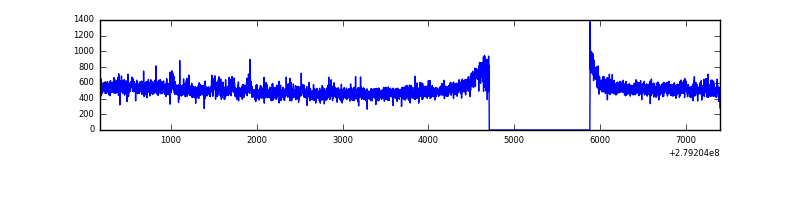 |
| D | 7229 | 6055 | 38 | 38 | 0.53% | 0.63% | 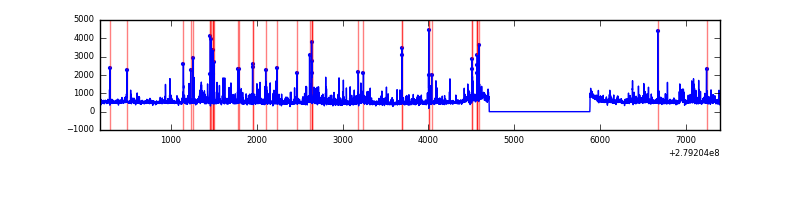 |
Top three noisy pixels from each quadrant. If the there are fewer than three noisy pixels in the level2.evt file, extra rows are filled as -1
| Pixel properties | Quadrant properties | ||||||
|---|---|---|---|---|---|---|---|
| Quadrant | DetID | PixID | Counts | Sigma | Mean | Median | Sigma |
| A | 15 | 174 | 1823918 | 12242.87 | 741 | 726 | 148.9 |
| A | 9 | 143 | 39919 | 263.18 | 741 | 726 | 148.9 |
| A | 0 | 226 | 6520 | 38.91 | 741 | 726 | 148.9 |
| B | 15 | 35 | 267639 | 1800.49 | 776 | 757 | 148.2 |
| B | 0 | 229 | 64196 | 427.98 | 776 | 757 | 148.2 |
| B | 0 | 189 | 20642 | 134.15 | 776 | 757 | 148.2 |
| C | 14 | 238 | 116203 | 670.34 | 745 | 752 | 172.2 |
| C | 3 | 233 | 92749 | 534.16 | 745 | 752 | 172.2 |
| C | 13 | 61 | 5315 | 26.49 | 745 | 752 | 172.2 |
| D | 1 | 52 | 600446 | 3207.16 | 766 | 743 | 187.0 |
| D | 12 | 218 | 85547 | 453.52 | 766 | 743 | 187.0 |
| D | 13 | 248 | 43030 | 226.15 | 766 | 743 | 187.0 |
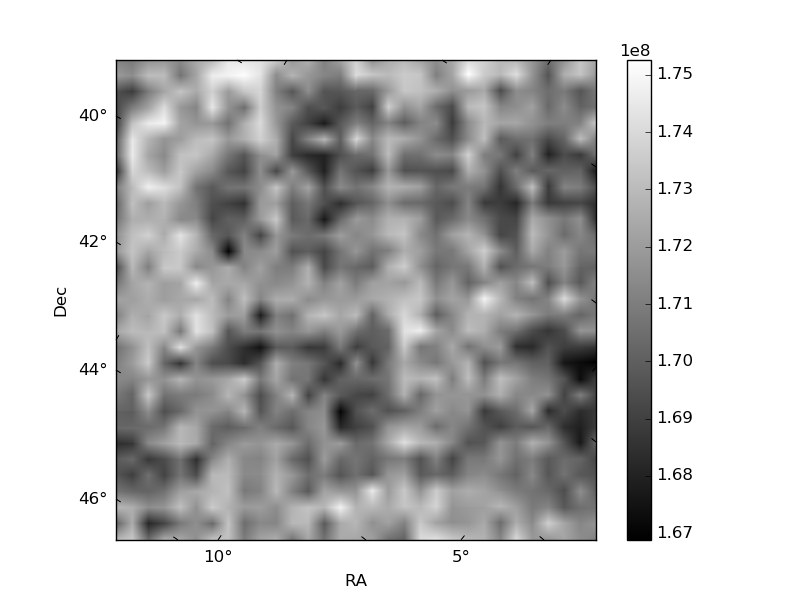
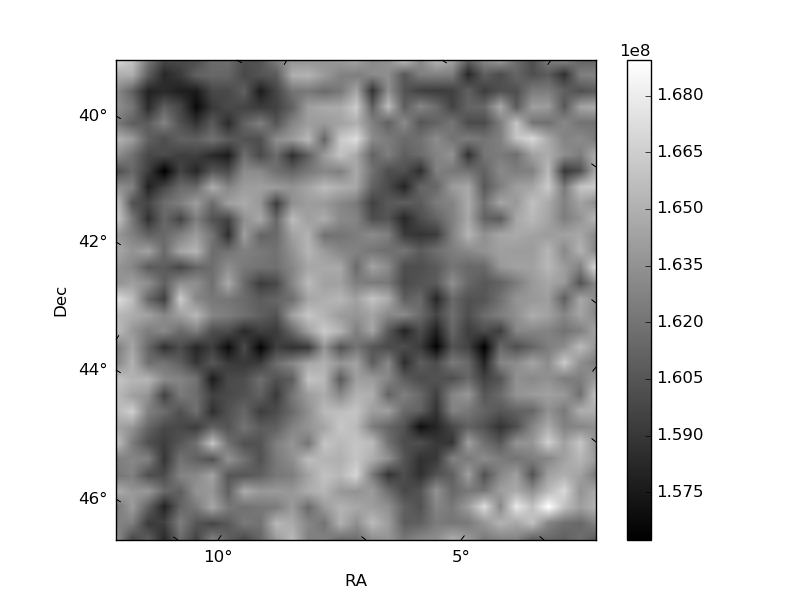
Histogram calculated using DETX and DETY for each event in the final _common_clean file
| Quadrant A |  |
 |
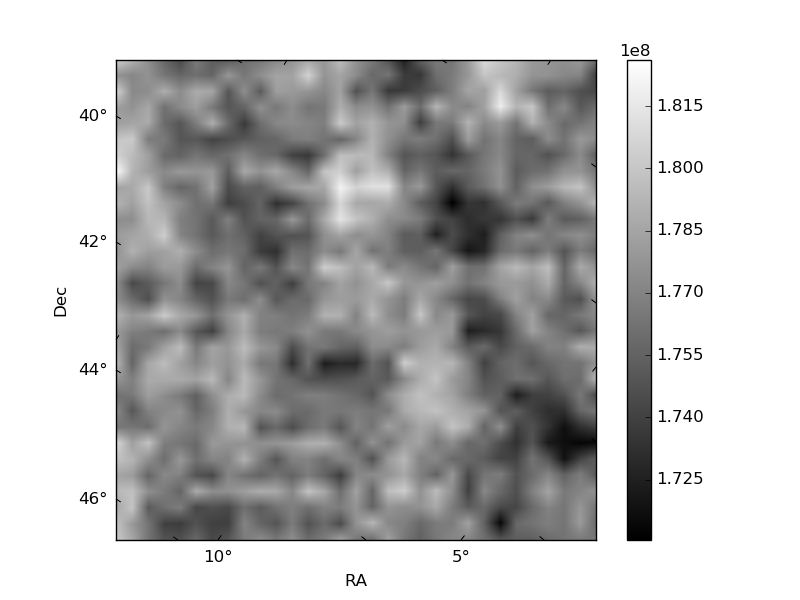
Quadrant B |
|---|---|---|---|
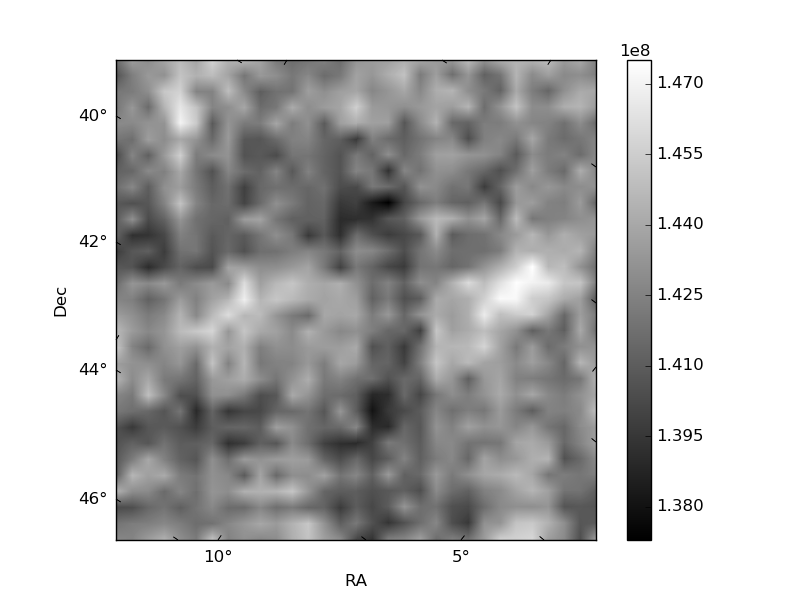
| Quadrant D |  |
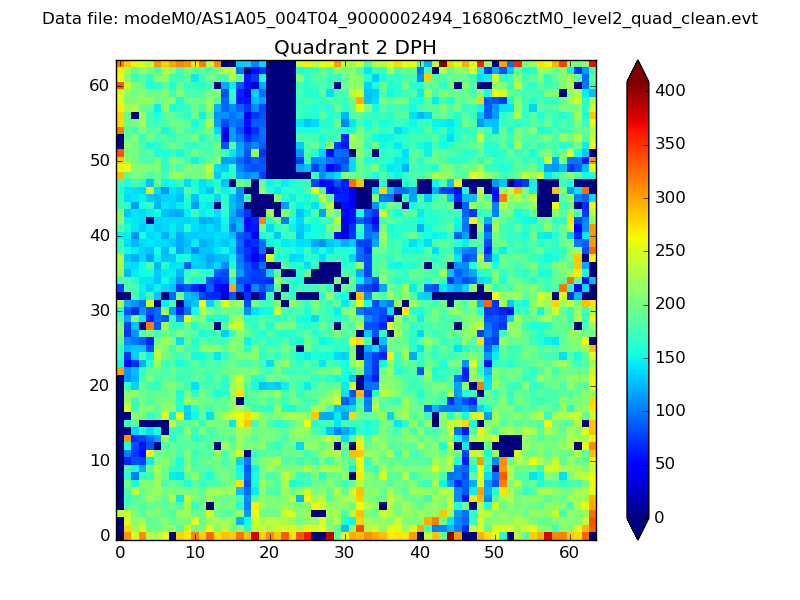 |
Quadrant C |
| Plot type | Count rate plots | Images |
|---|---|---|
| Comparison with Poisson distribution Blue bars denote a histogram of data divided into 1 sec bins. Red curve is a Poisson curve with rate = median count rate of data. |
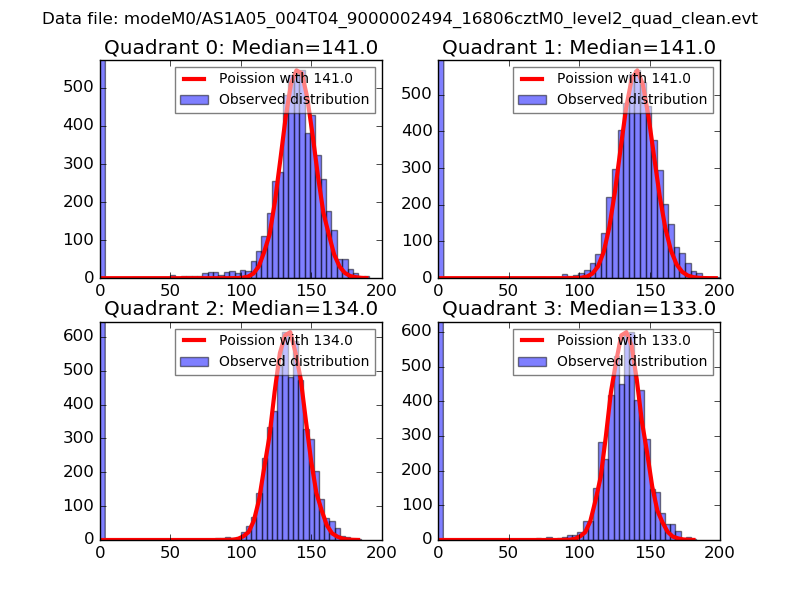 |
 |
| Quadrant-wise count rates Data is divided into 100 sec bins |
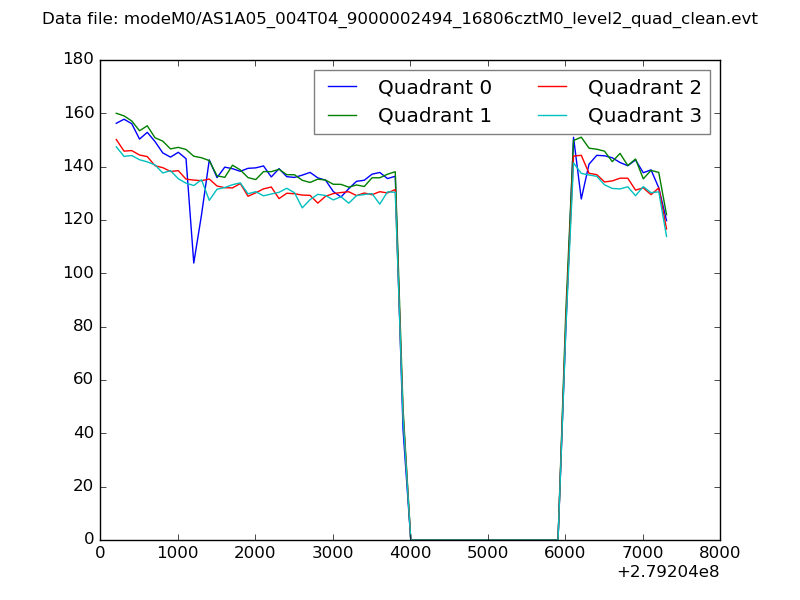 |
|
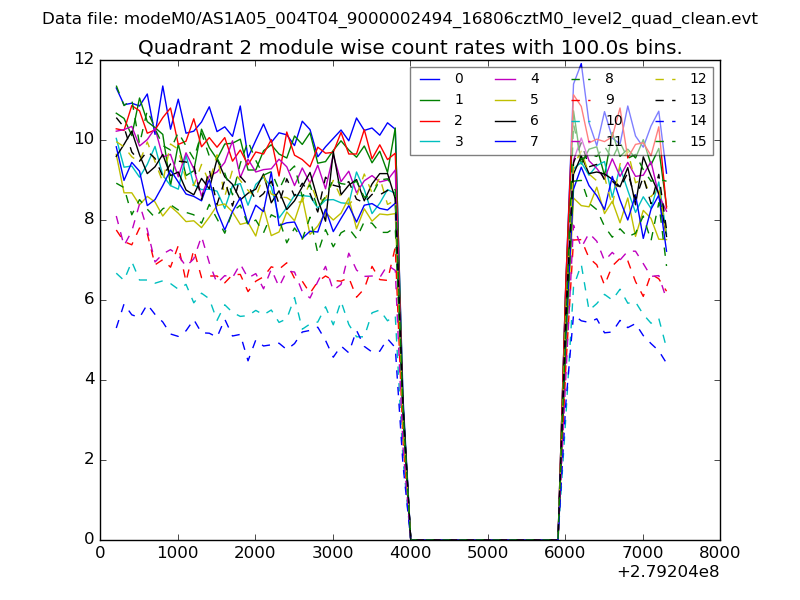
| Module-wise count rates for Quadrant A Data is divided into 100 sec bins |
 |
 |
| Module-wise count rates for Quadrant B Data is divided into 100 sec bins |
 |
 |
| Module-wise count rates for Quadrant C Data is divided into 100 sec bins |
 |
 |
| Module-wise count rates for Quadrant D Data is divided into 100 sec bins |
 |
 |
| Parameter | Plot |
|---|---|
| CZT HV Monitor |  |
| D_VDD | 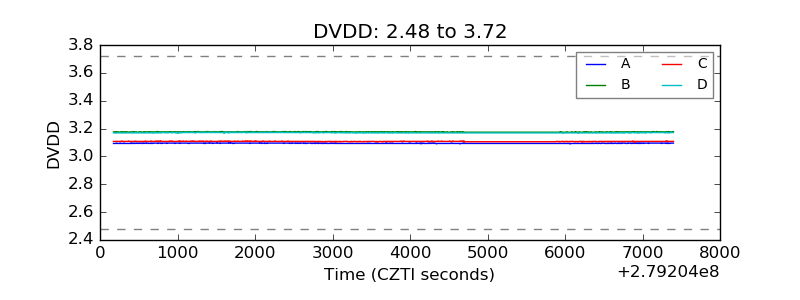 |
| Temperature 1 | 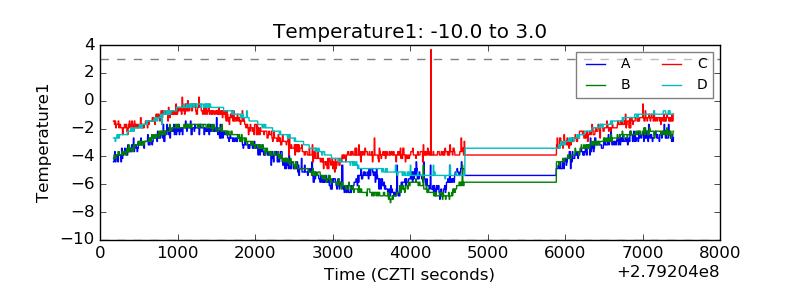 |
| Veto HV Monitor | 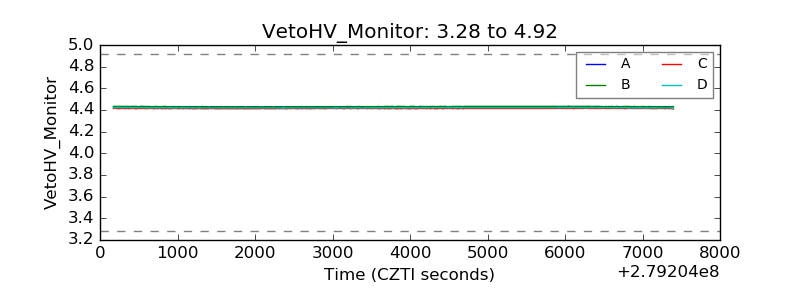 |
| Veto LLD | 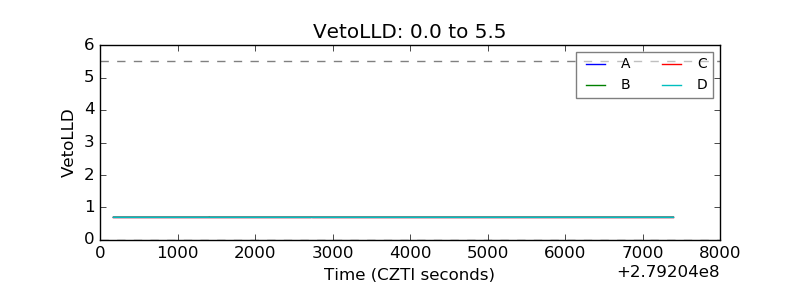 |
| Alpha Counter | 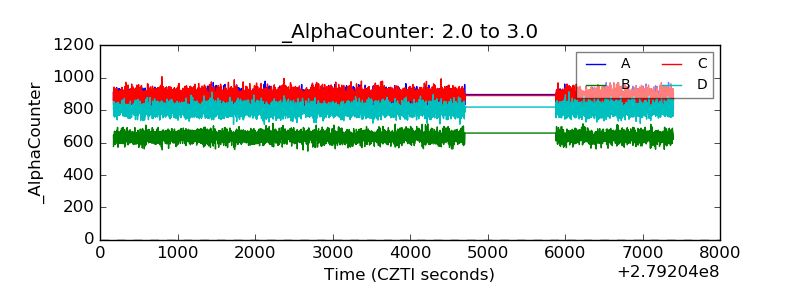 |
| _CPM_Rate | 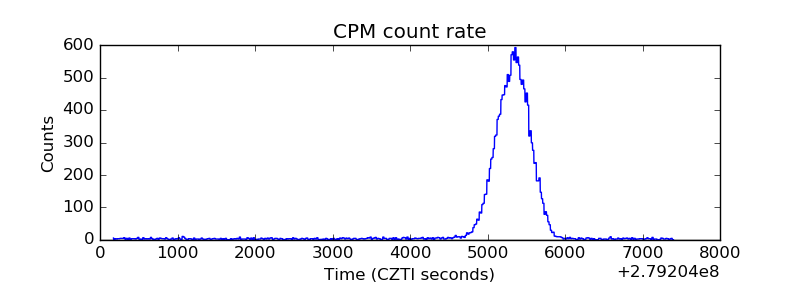 |
| CZT Counter | 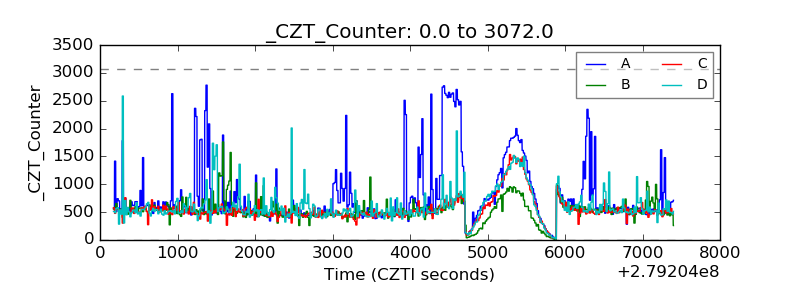 |
| +2.5 Volts monitor |  |
| +5 Volts monitor |  |
| _ROLL_ROT | 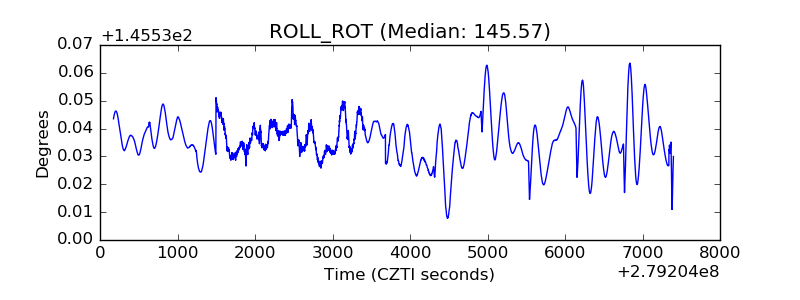 |
| _Roll_DEC | 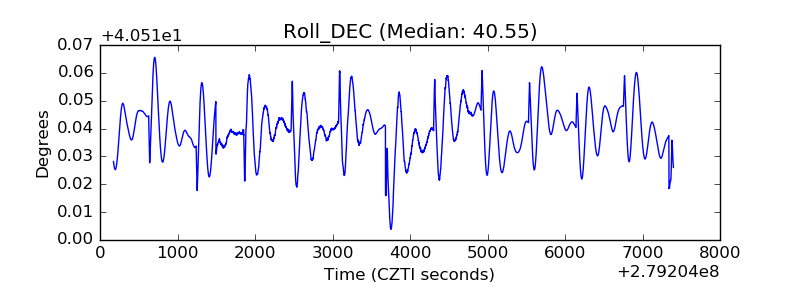 |
| _Roll_RA | 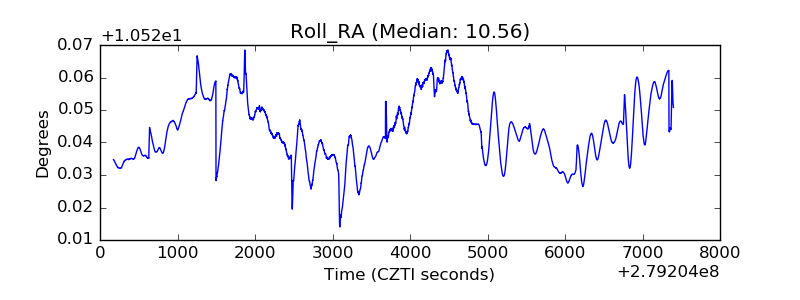 |
| Veto Counter | 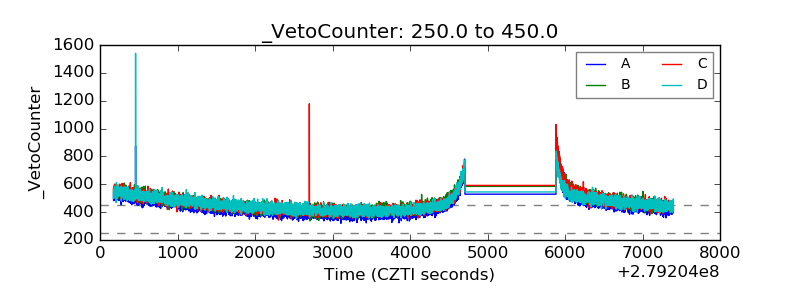 |