| Param | Original file | Final file |
|---|---|---|
| Filename | modeM0/AS1A05_004T04_9000002494_16807cztM0_level2.evt | modeM0/AS1A05_004T04_9000002494_16807cztM0_level2_quad_clean.evt |
| Size (bytes) | 519,099,840 | 105,413,760 |
| Size | 495.1 MB | 100.5 MB |
| Events in quadrant A | 4,191,241 | 683,638 |
| Events in quadrant B | 3,654,104 | 701,442 |
| Events in quadrant C | 3,389,838 | 673,371 |
| Events in quadrant D | 4,025,436 | 661,074 |
| Mode M9 | |||
|---|---|---|---|
| Quadrant | BADHDUFLAG | Total packets | Discarded packets |
| A | 0 | 12 | 0 |
| B | 0 | 12 | 0 |
| C | 0 | 12 | 0 |
| D | 0 | 13 | 0 |
| Mode M0 | |||
|---|---|---|---|
| Quadrant | BADHDUFLAG | Total packets | Discarded packets |
| A | 0 | 16864 | 3 |
| B | 0 | 15104 | 2 |
| C | 0 | 14238 | 2 |
| D | 0 | 16264 | 2 |
| Mode SS | |||
|---|---|---|---|
| Quadrant | BADHDUFLAG | Total packets | Discarded packets |
| A | 0 | 138 | 0 |
| B | 0 | 138 | 0 |
| C | 0 | 138 | 0 |
| D | 0 | 138 | 0 |
| Quadrant | Total seconds | Saturated seconds | Saturation percentage |
|---|---|---|---|
| A | 6778 | 384 | 5.665388% |
| B | 6778 | 90 | 1.327825% |
| C | 6778 | 114 | 1.681912% |
| D | 6778 | 112 | 1.652405% |
Noise dominated data is calculated using 1-second bins in cleaned event files. If a bin has >2000 counts, and if more than 50% of those come from <1% of pixels, then it is considered to be noise-dominated and hence unusable.
| Quadrant | # 1 sec bins | Bins with >0 counts | Bins with >2000 counts | High rate bins dominated by noise | Noise dominated (total time) | Noise dominated (detector-on time) | Marked lightcurve |
|---|---|---|---|---|---|---|---|
| A | 7719 | 6780 | 191 | 191 | 2.47% | 2.82% | 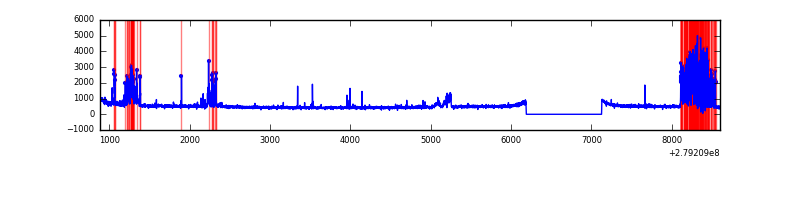 |
| B | 7719 | 6780 | 2 | 2 | 0.03% | 0.03% | 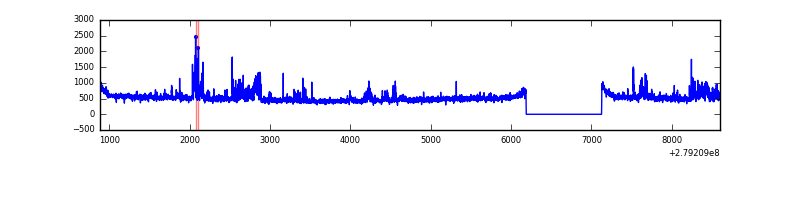 |
| C | 7719 | 6780 | 0 | 0 | 0.00% | 0.00% | 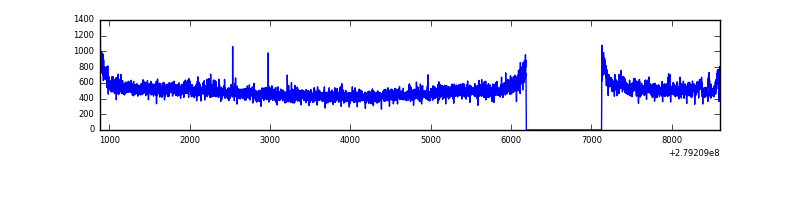 |
| D | 7719 | 6780 | 32 | 32 | 0.41% | 0.47% | 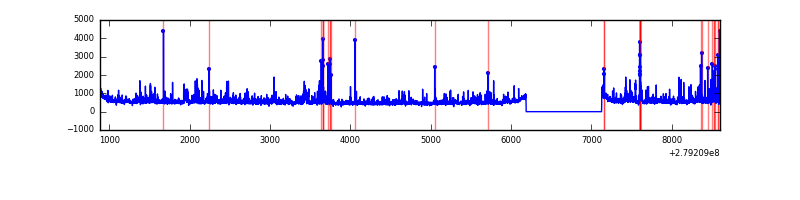 |
Top three noisy pixels from each quadrant. If the there are fewer than three noisy pixels in the level2.evt file, extra rows are filled as -1
| Pixel properties | Quadrant properties | ||||||
|---|---|---|---|---|---|---|---|
| Quadrant | DetID | PixID | Counts | Sigma | Mean | Median | Sigma |
| A | 15 | 174 | 901979 | 5353.98 | 842 | 827 | 168.3 |
| A | 9 | 143 | 36968 | 214.72 | 842 | 827 | 168.3 |
| A | 15 | 190 | 17460 | 98.82 | 842 | 827 | 168.3 |
| B | 15 | 35 | 267940 | 1649.9 | 843 | 821 | 161.9 |
| B | 0 | 189 | 31121 | 187.15 | 843 | 821 | 161.9 |
| B | 12 | 111 | 18543 | 109.46 | 843 | 821 | 161.9 |
| C | 14 | 238 | 127226 | 667.86 | 815 | 820 | 189.3 |
| C | 3 | 233 | 79622 | 416.35 | 815 | 820 | 189.3 |
| C | 13 | 61 | 5836 | 26.5 | 815 | 820 | 189.3 |
| D | 1 | 52 | 727180 | 3568.74 | 831 | 807 | 203.5 |
| D | 13 | 248 | 66449 | 322.51 | 831 | 807 | 203.5 |
| D | 12 | 218 | 40419 | 194.62 | 831 | 807 | 203.5 |
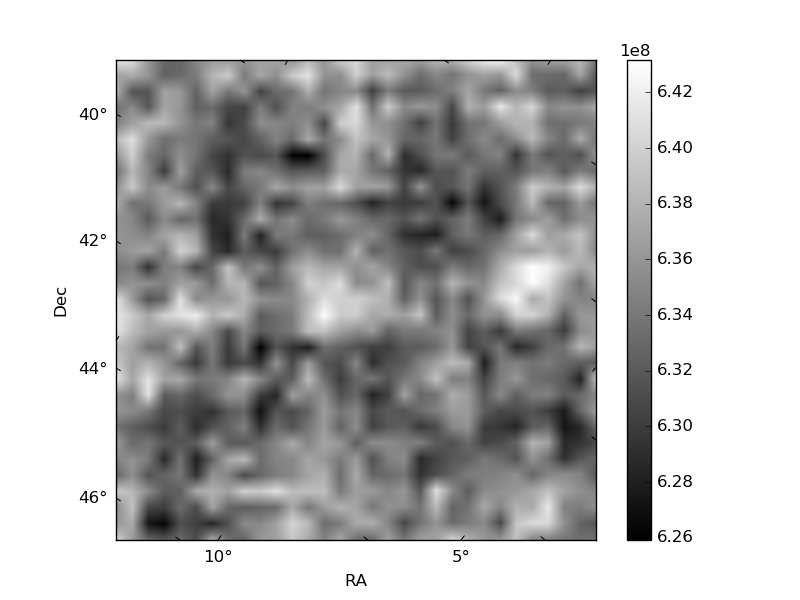
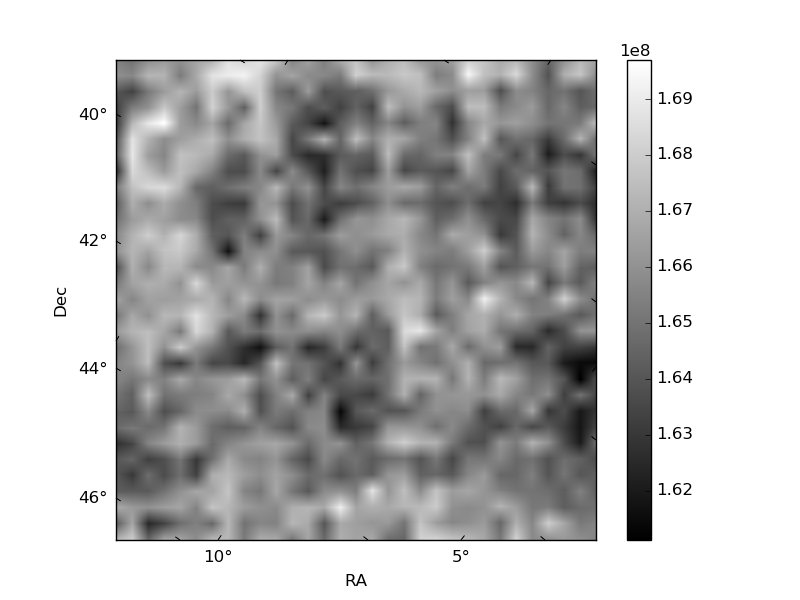
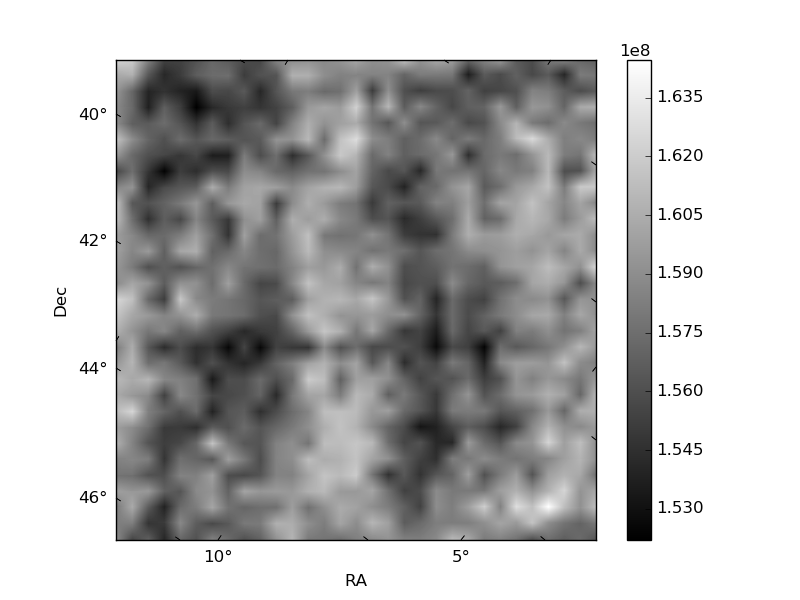
Histogram calculated using DETX and DETY for each event in the final _common_clean file
| Quadrant A | 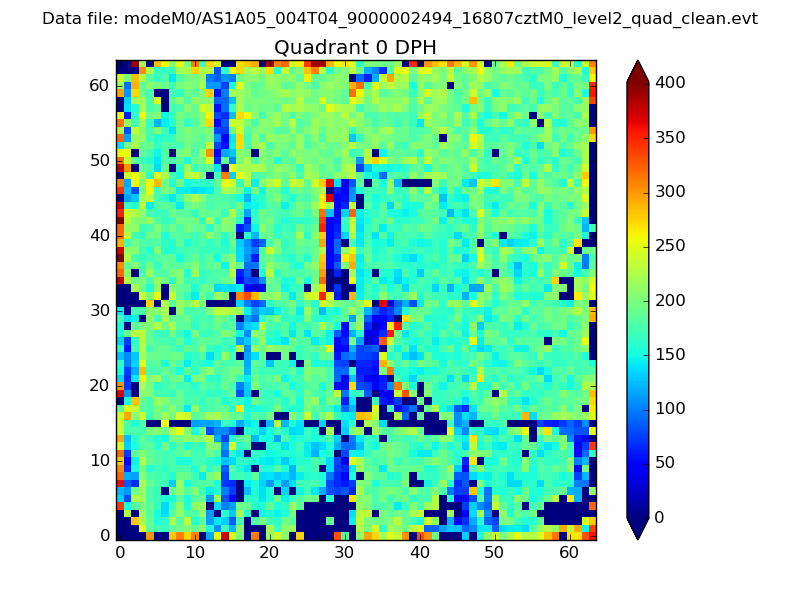 |
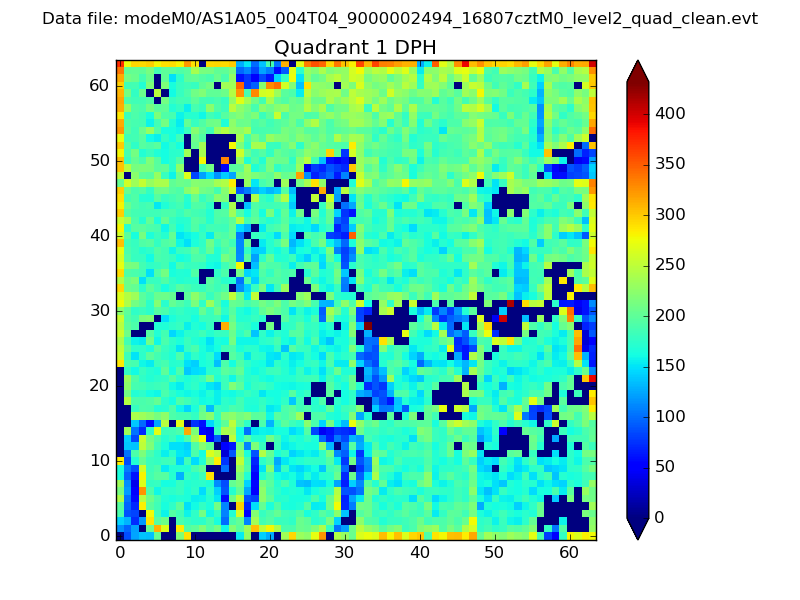 |
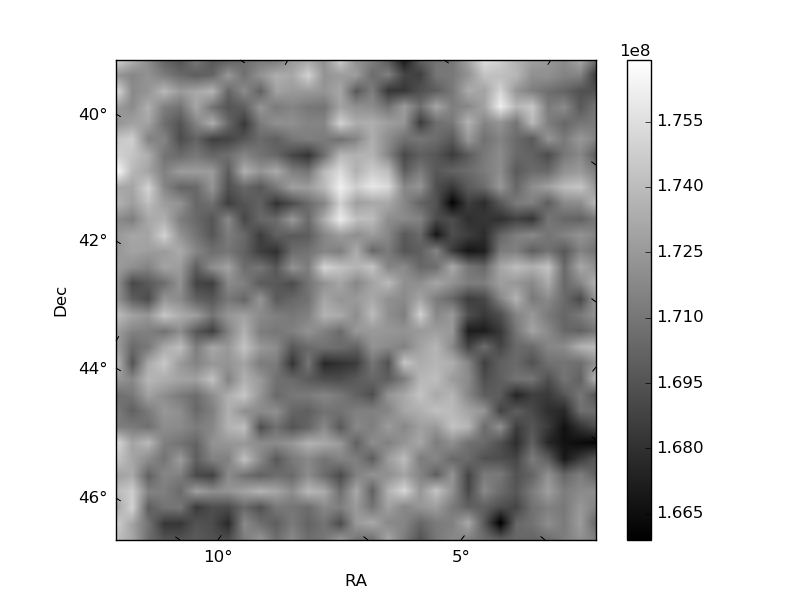
Quadrant B |
|---|---|---|---|
| Quadrant D | 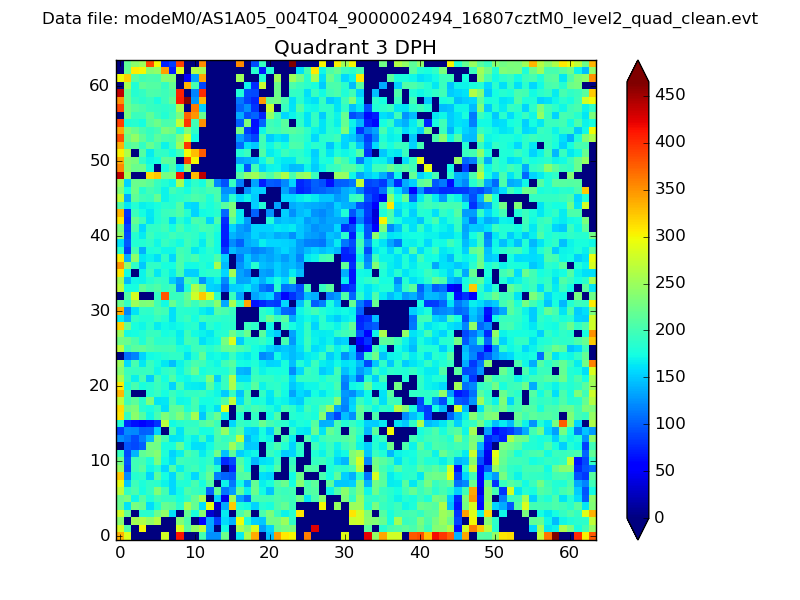 |
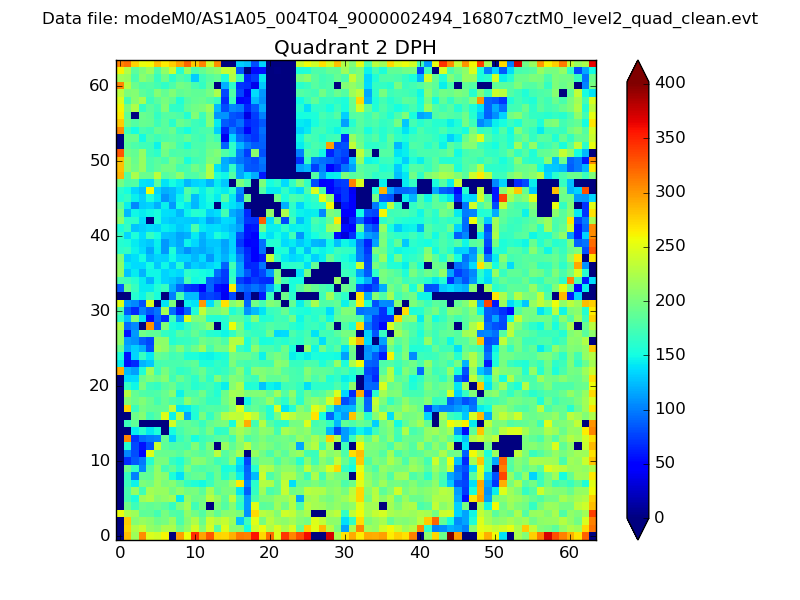 |
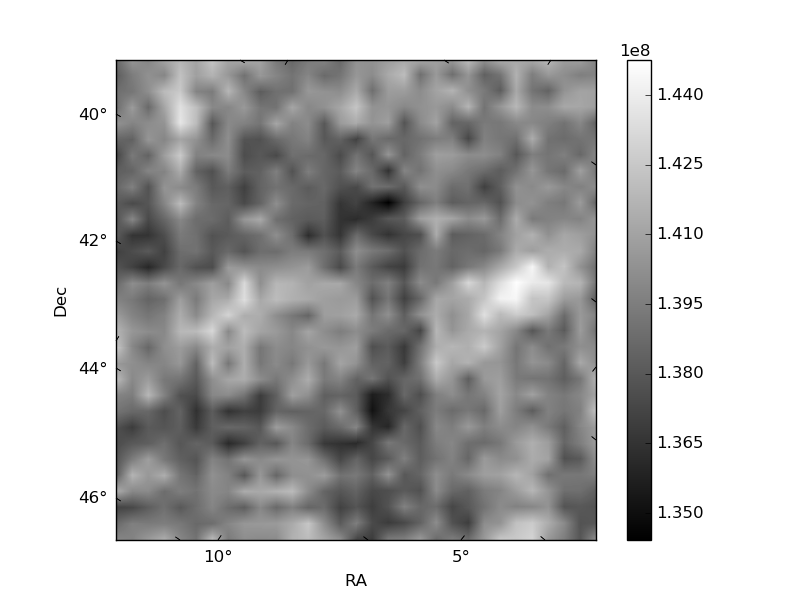
Quadrant C |
| Plot type | Count rate plots | Images |
|---|---|---|
| Comparison with Poisson distribution Blue bars denote a histogram of data divided into 1 sec bins. Red curve is a Poisson curve with rate = median count rate of data. |
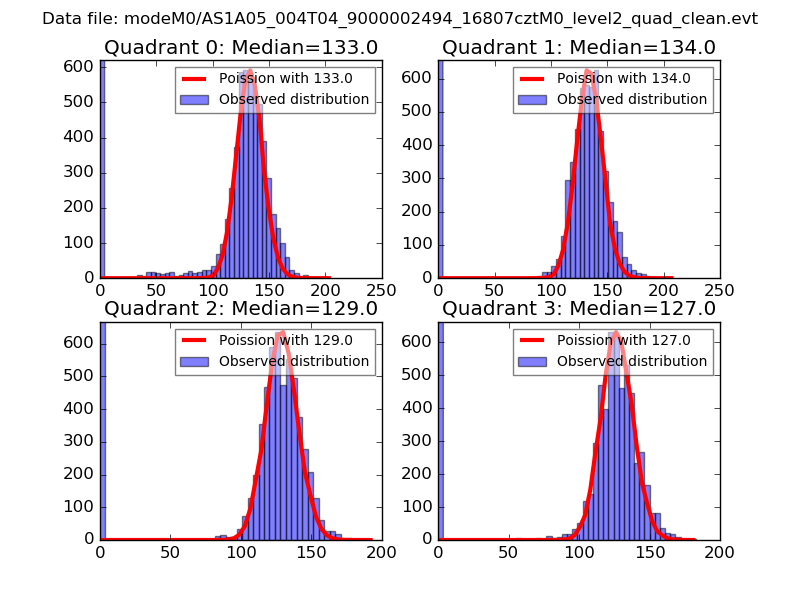 |
 |
| Quadrant-wise count rates Data is divided into 100 sec bins |
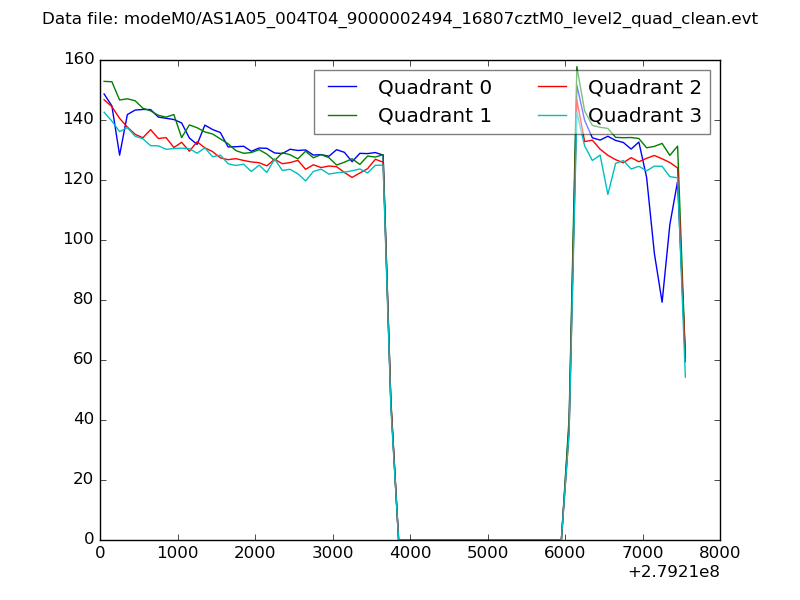 |
|
| Module-wise count rates for Quadrant A Data is divided into 100 sec bins |
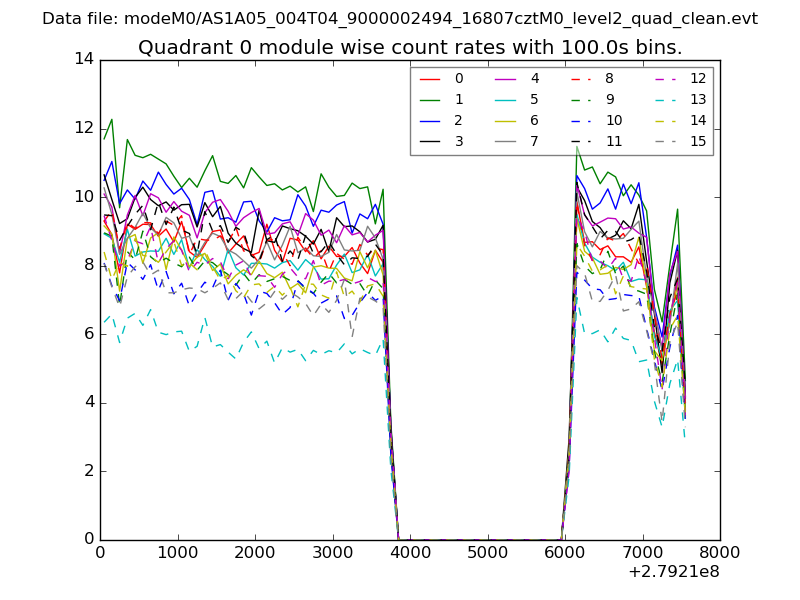 |
 |
| Module-wise count rates for Quadrant B Data is divided into 100 sec bins |
 |
 |
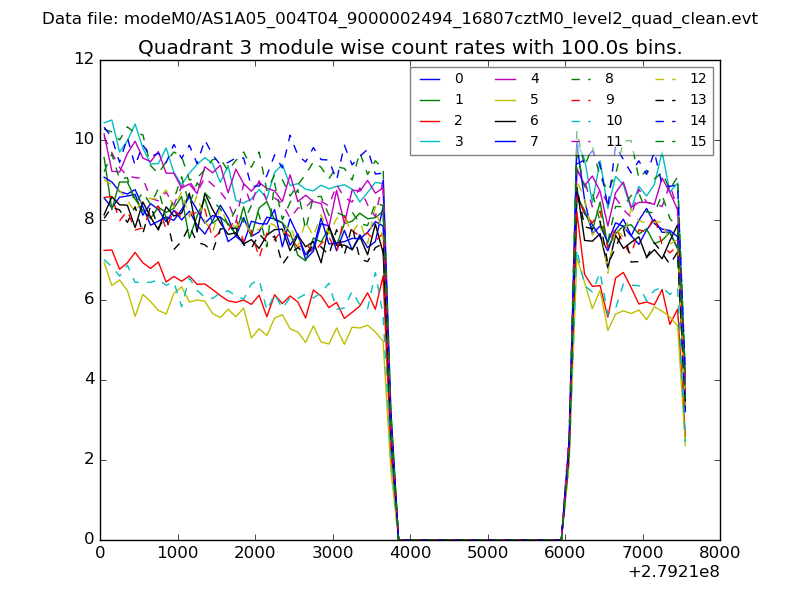
| Module-wise count rates for Quadrant C Data is divided into 100 sec bins |
 |
 |
| Module-wise count rates for Quadrant D Data is divided into 100 sec bins |
 |
 |
| Parameter | Plot |
|---|---|
| CZT HV Monitor | 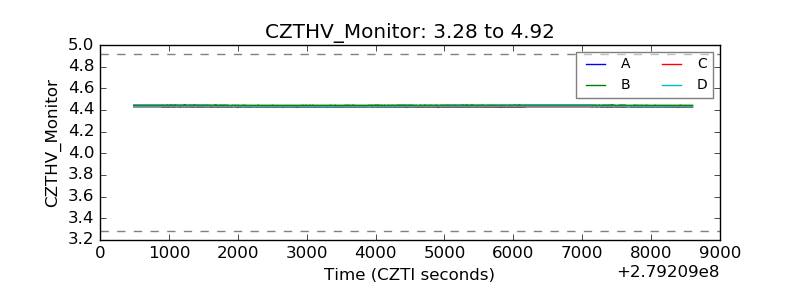 |
| D_VDD | 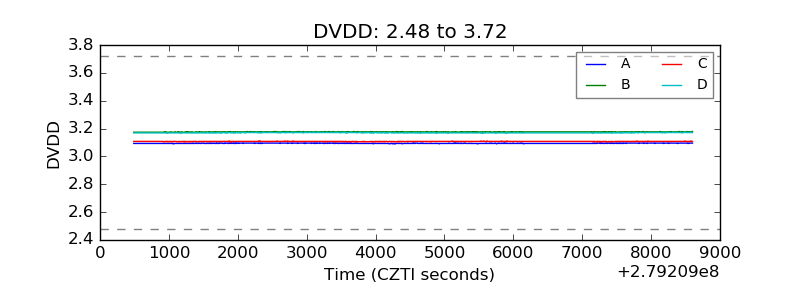 |
| Temperature 1 | 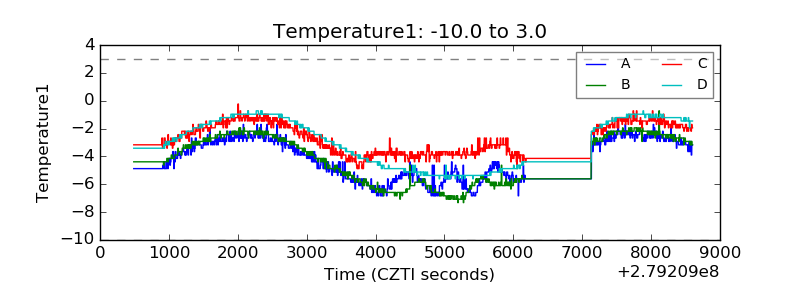 |
| Veto HV Monitor | 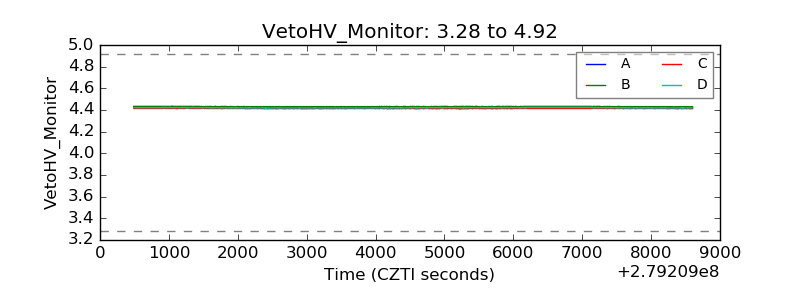 |
| Veto LLD | 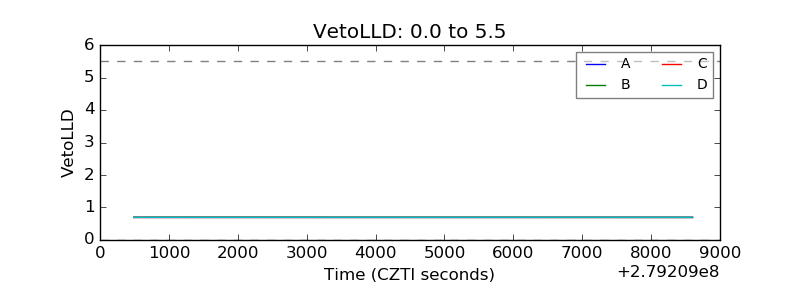 |
| Alpha Counter | 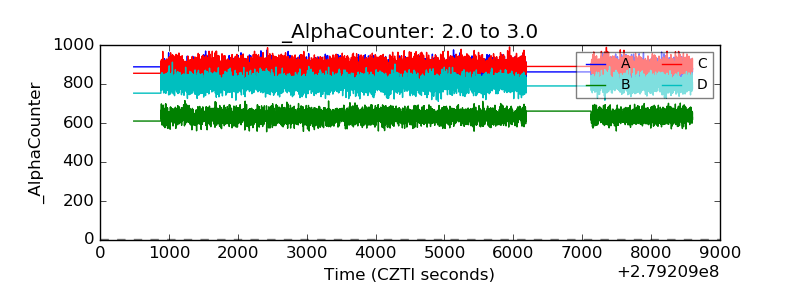 |
| _CPM_Rate |  |
| CZT Counter | 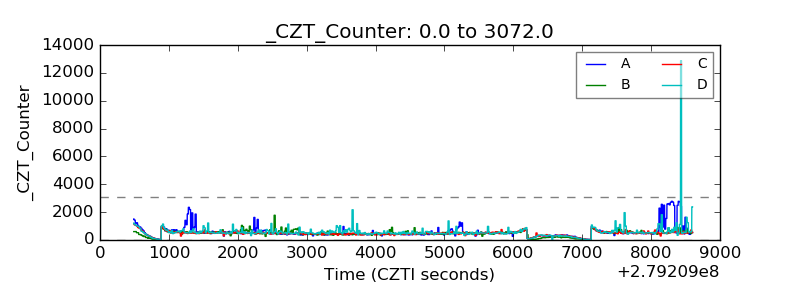 |
| +2.5 Volts monitor |  |
| +5 Volts monitor |  |
| _ROLL_ROT |  |
| _Roll_DEC | 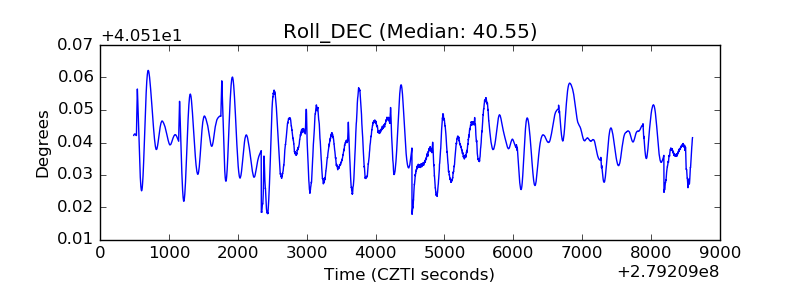 |
| _Roll_RA | 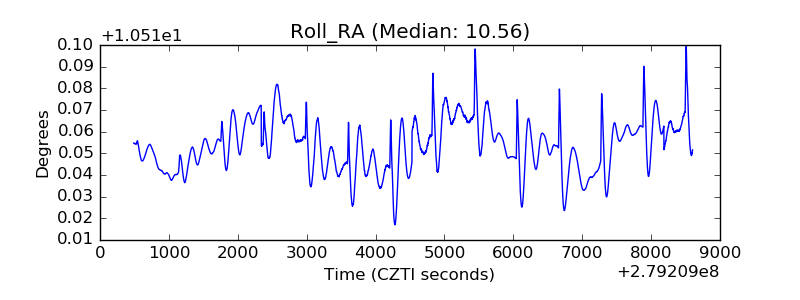 |
| Veto Counter | 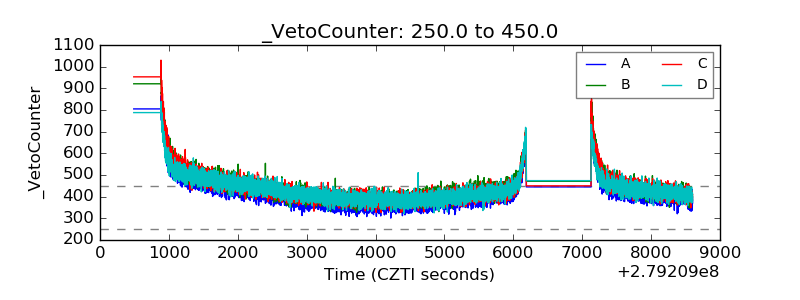 |