| Param | Original file | Final file |
|---|---|---|
| Filename | modeM0/AS1A05_004T04_9000002494_16808cztM0_level2.evt | modeM0/AS1A05_004T04_9000002494_16808cztM0_level2_quad_clean.evt |
| Size (bytes) | 210,300,480 | 48,294,720 |
| Size | 200.6 MB | 46.1 MB |
| Events in quadrant A | 1,703,318 | 317,108 |
| Events in quadrant B | 1,324,432 | 331,139 |
| Events in quadrant C | 1,263,636 | 320,286 |
| Events in quadrant D | 1,899,681 | 308,026 |
| Mode M0 | |||
|---|---|---|---|
| Quadrant | BADHDUFLAG | Total packets | Discarded packets |
| A | 0 | 6852 | 0 |
| B | 0 | 5700 | 0 |
| C | 0 | 5368 | 0 |
| D | 0 | 7348 | 0 |
| Mode SS | |||
|---|---|---|---|
| Quadrant | BADHDUFLAG | Total packets | Discarded packets |
| A | 0 | 50 | 0 |
| B | 0 | 50 | 0 |
| C | 0 | 50 | 0 |
| D | 0 | 50 | 0 |
| Quadrant | Total seconds | Saturated seconds | Saturation percentage |
|---|---|---|---|
| A | 2595 | 211 | 8.131021% |
| B | 2595 | 7 | 0.269750% |
| C | 2595 | 6 | 0.231214% |
| D | 2595 | 115 | 4.431599% |
Noise dominated data is calculated using 1-second bins in cleaned event files. If a bin has >2000 counts, and if more than 50% of those come from <1% of pixels, then it is considered to be noise-dominated and hence unusable.
| Quadrant | # 1 sec bins | Bins with >0 counts | Bins with >2000 counts | High rate bins dominated by noise | Noise dominated (total time) | Noise dominated (detector-on time) | Marked lightcurve |
|---|---|---|---|---|---|---|---|
| A | 2596 | 2596 | 152 | 152 | 5.86% | 5.86% | 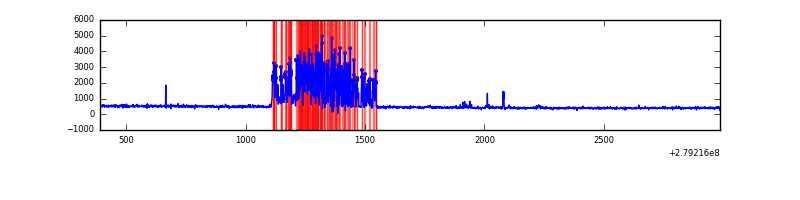 |
| B | 2596 | 2596 | 0 | 0 | 0.00% | 0.00% | 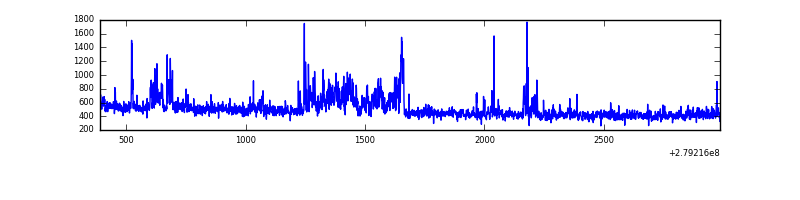 |
| C | 2596 | 2596 | 0 | 0 | 0.00% | 0.00% | 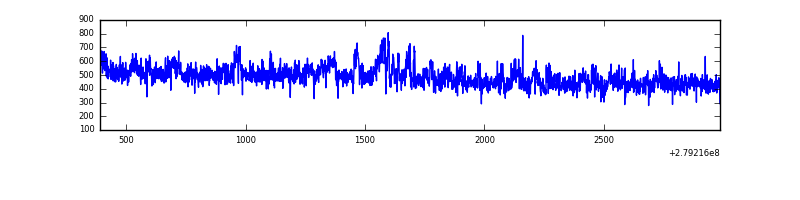 |
| D | 2596 | 2596 | 95 | 95 | 3.66% | 3.66% | 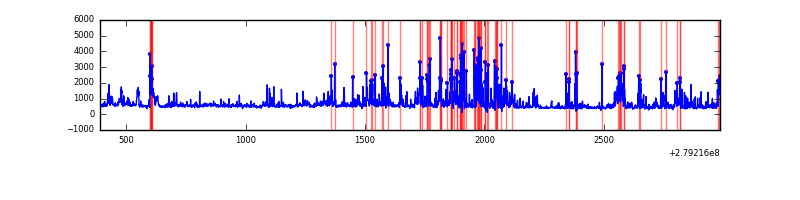 |
Top three noisy pixels from each quadrant. If the there are fewer than three noisy pixels in the level2.evt file, extra rows are filled as -1
| Pixel properties | Quadrant properties | ||||||
|---|---|---|---|---|---|---|---|
| Quadrant | DetID | PixID | Counts | Sigma | Mean | Median | Sigma |
| A | 15 | 174 | 560459 | 9328.43 | 290 | 284 | 60.1 |
| A | 15 | 190 | 14042 | 229.11 | 290 | 284 | 60.1 |
| A | 9 | 143 | 12947 | 210.87 | 290 | 284 | 60.1 |
| B | 15 | 35 | 134529 | 2302.47 | 298 | 292 | 58.3 |
| B | 12 | 111 | 6234 | 101.92 | 298 | 292 | 58.3 |
| B | 11 | 111 | 5579 | 90.68 | 298 | 292 | 58.3 |
| C | 3 | 233 | 82636 | 1187.35 | 290 | 291 | 69.4 |
| C | 14 | 238 | 45860 | 657.07 | 290 | 291 | 69.4 |
| C | 13 | 61 | 2017 | 24.89 | 290 | 291 | 69.4 |
| D | 1 | 52 | 739418 | 10290.89 | 291 | 282 | 71.8 |
| D | 12 | 218 | 27506 | 379.04 | 291 | 282 | 71.8 |
| D | 2 | 234 | 10459 | 141.69 | 291 | 282 | 71.8 |
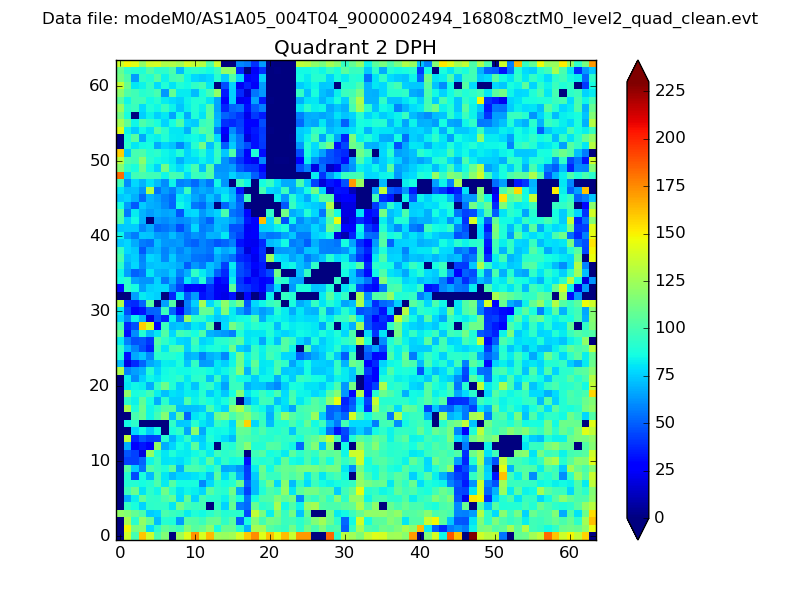
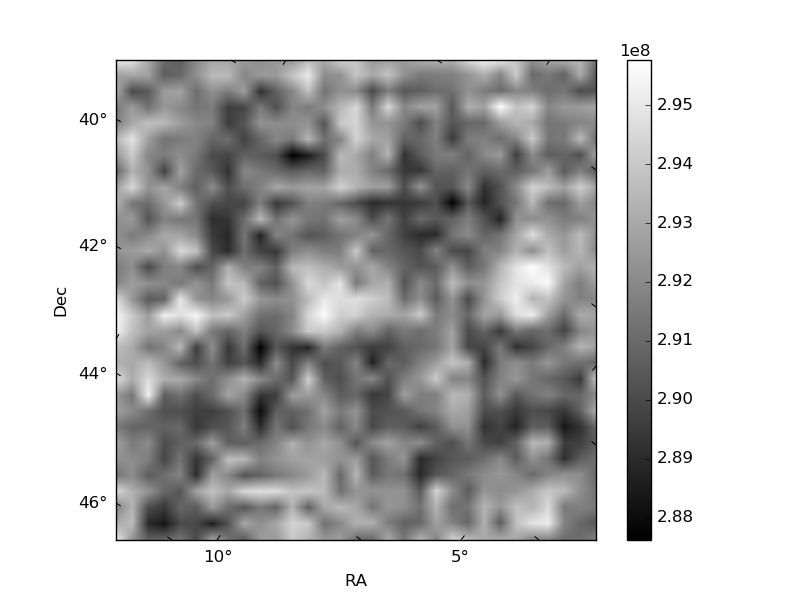
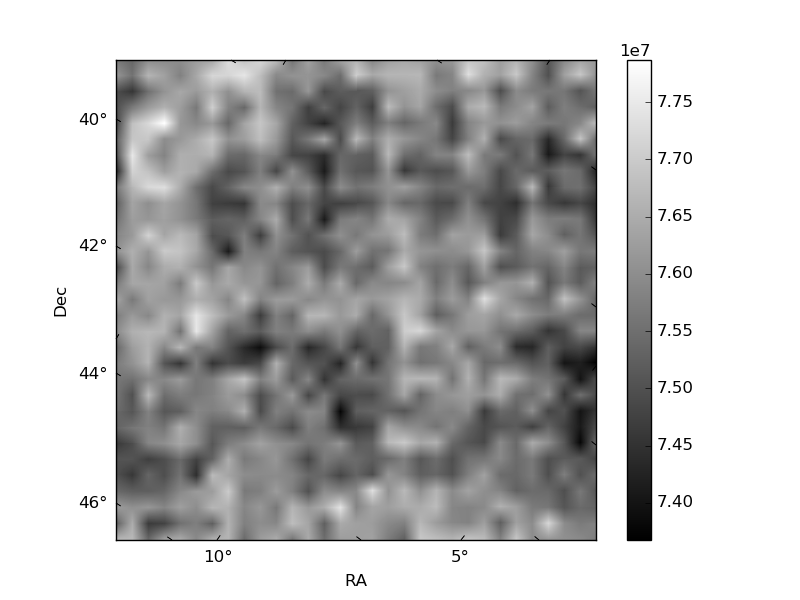
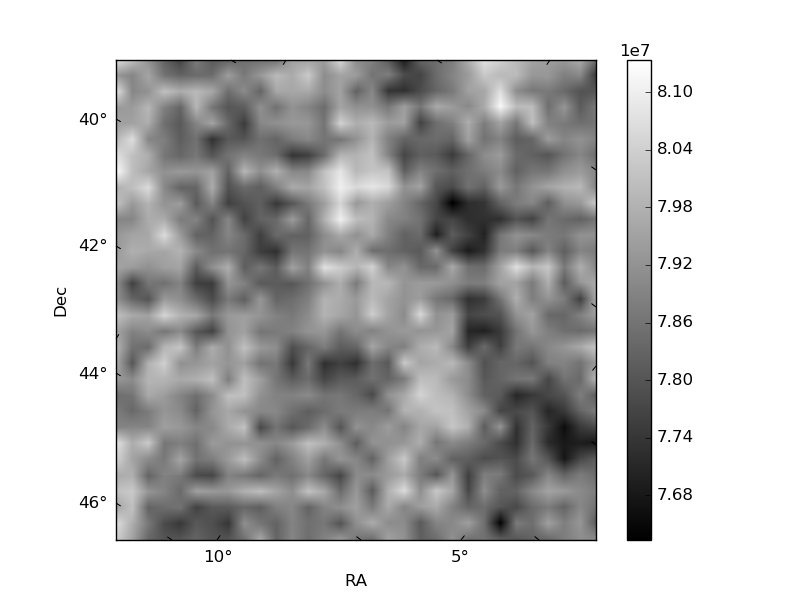
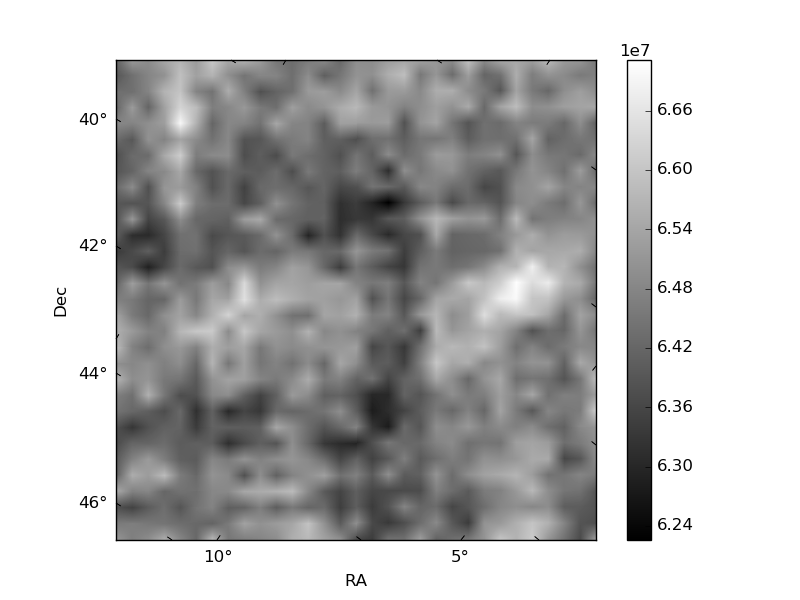
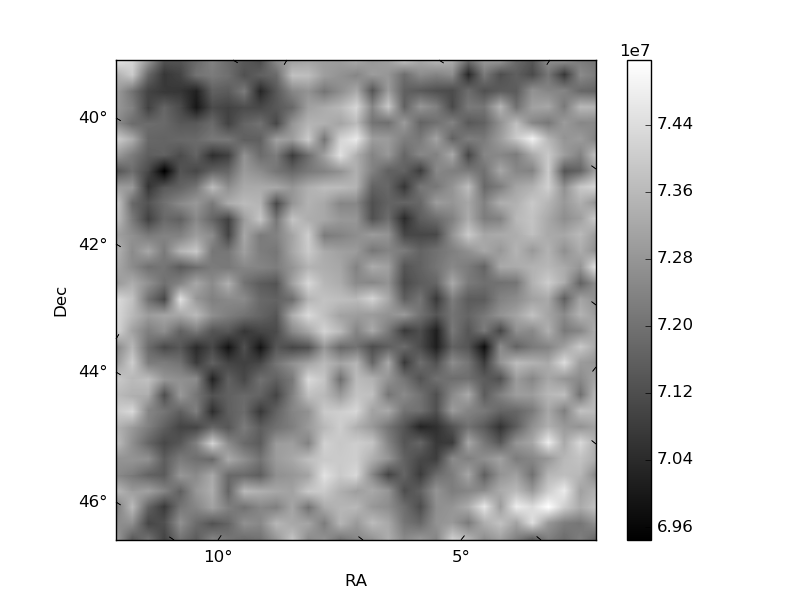
Histogram calculated using DETX and DETY for each event in the final _common_clean file
| Quadrant A | 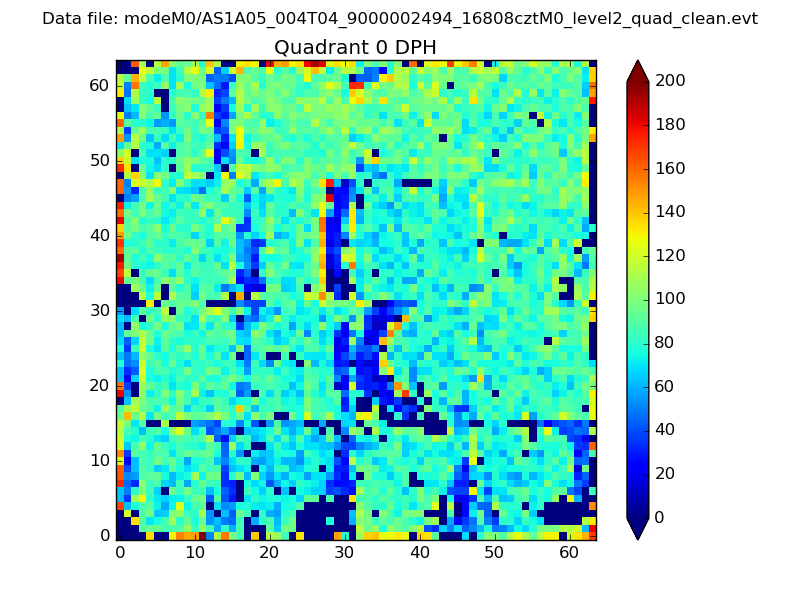 |
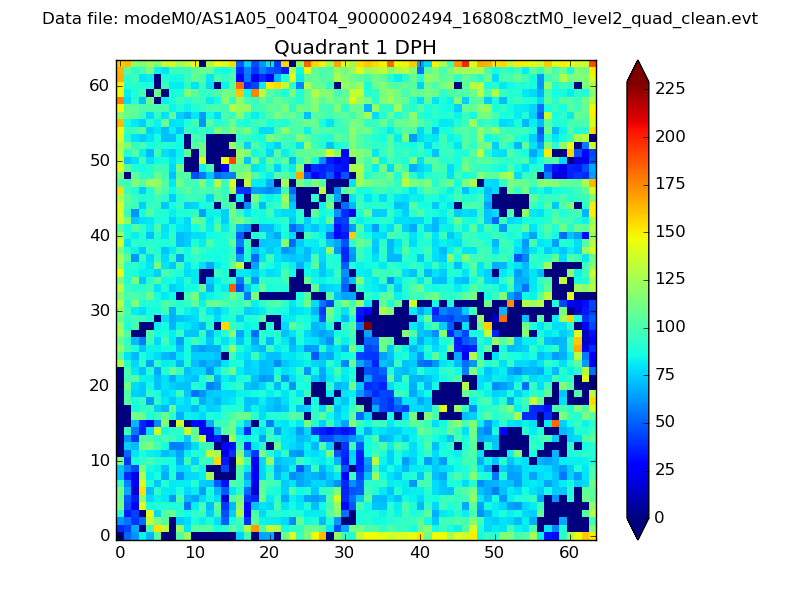 |
Quadrant B |
|---|---|---|---|
| Quadrant D | 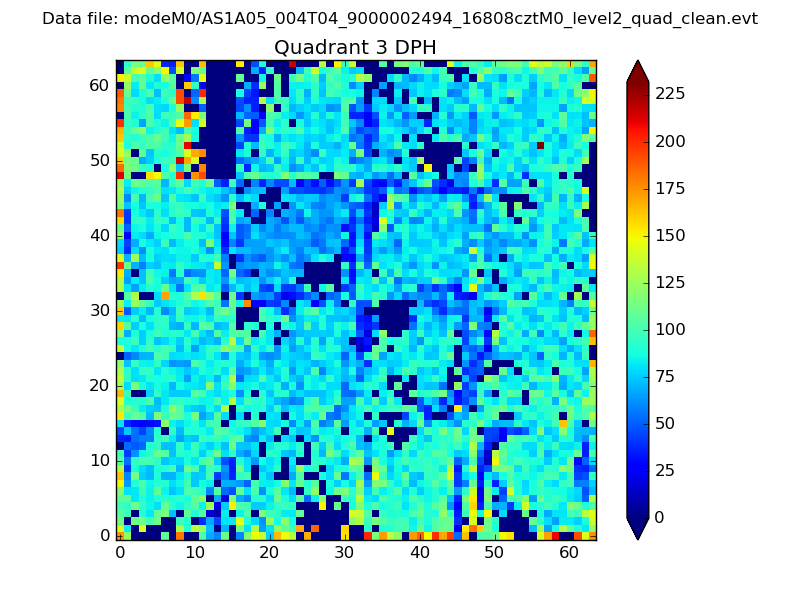 |
 |
Quadrant C |
| Plot type | Count rate plots | Images |
|---|---|---|
| Comparison with Poisson distribution Blue bars denote a histogram of data divided into 1 sec bins. Red curve is a Poisson curve with rate = median count rate of data. |
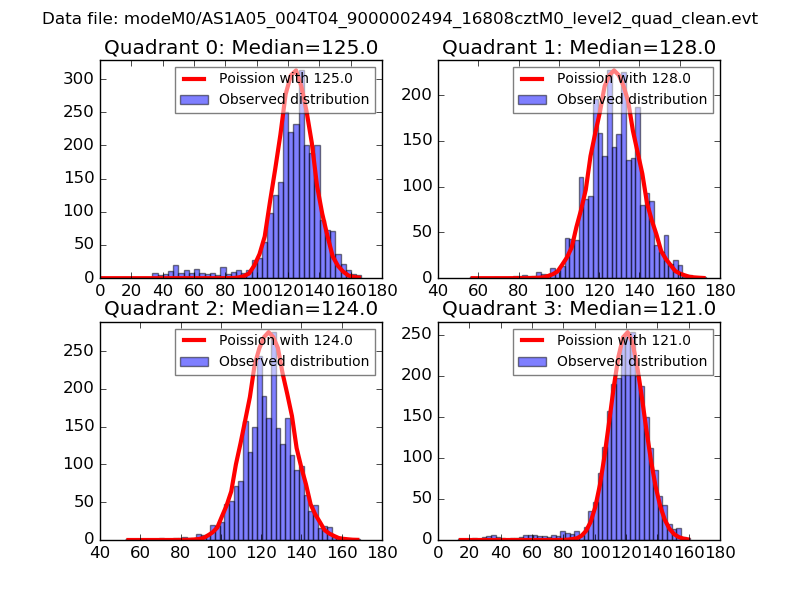 |
 |
| Quadrant-wise count rates Data is divided into 100 sec bins |
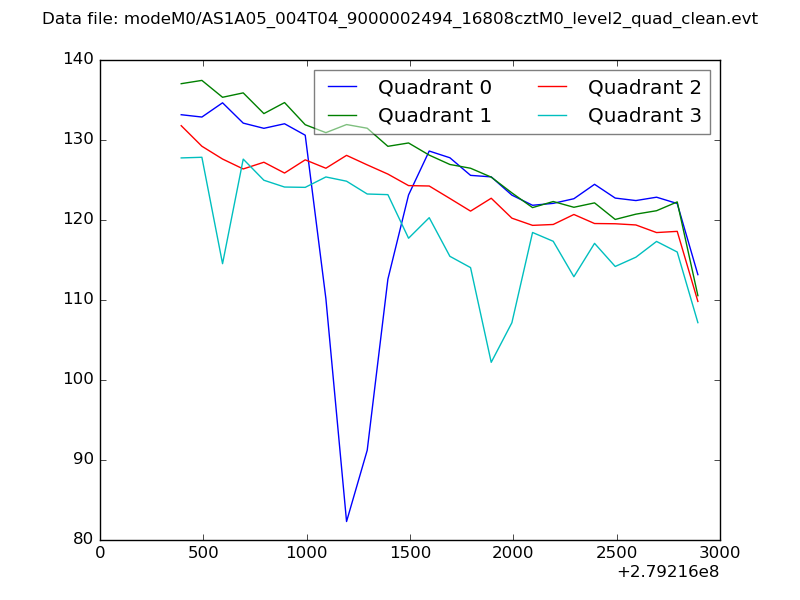 |
|
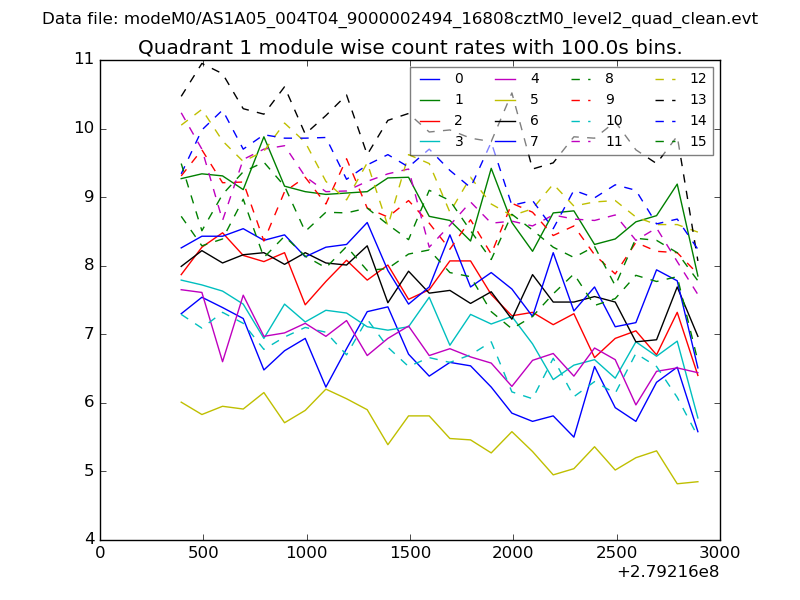
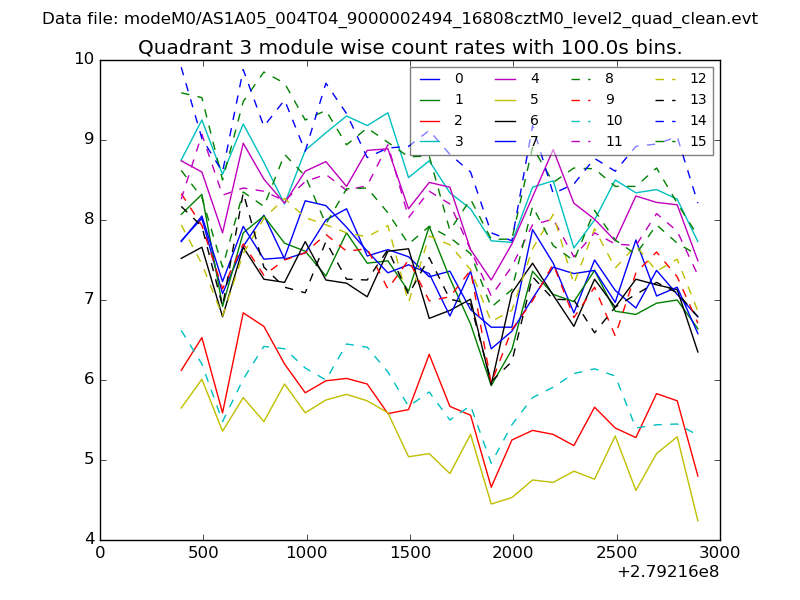
| Module-wise count rates for Quadrant A Data is divided into 100 sec bins |
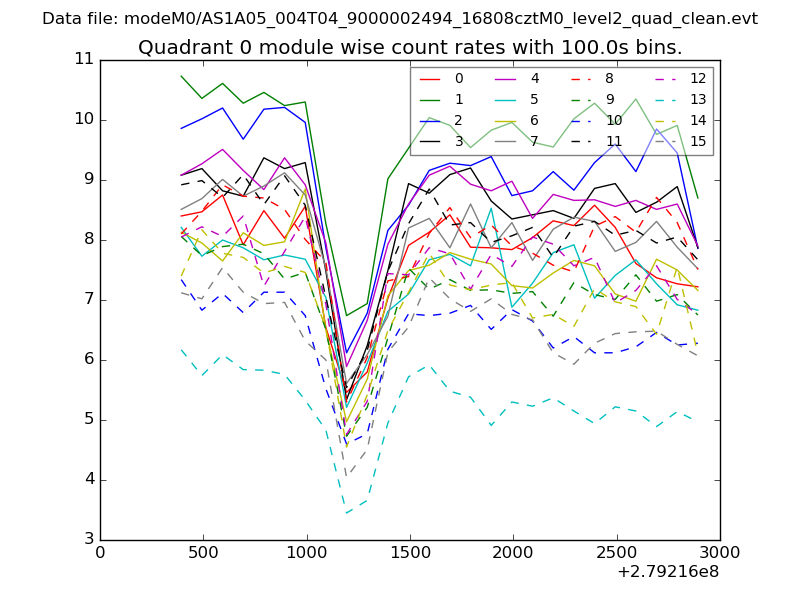 |
 |
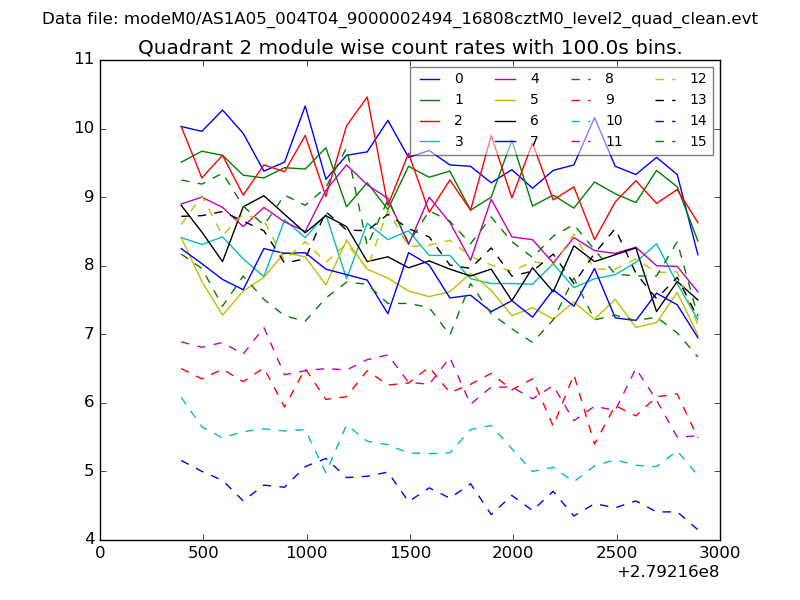
| Module-wise count rates for Quadrant B Data is divided into 100 sec bins |
 |
 |
| Module-wise count rates for Quadrant C Data is divided into 100 sec bins |
 |
 |
| Module-wise count rates for Quadrant D Data is divided into 100 sec bins |
 |
 |
| Parameter | Plot |
|---|---|
| CZT HV Monitor | 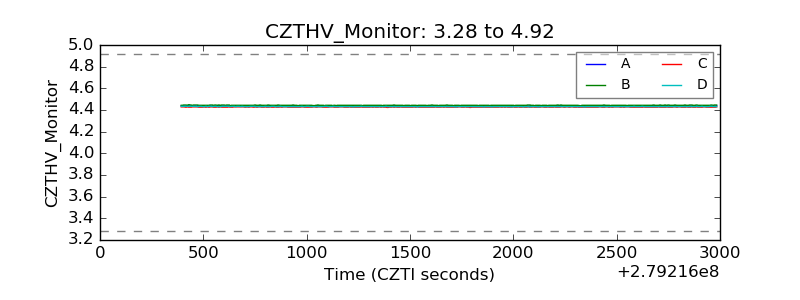 |
| D_VDD | 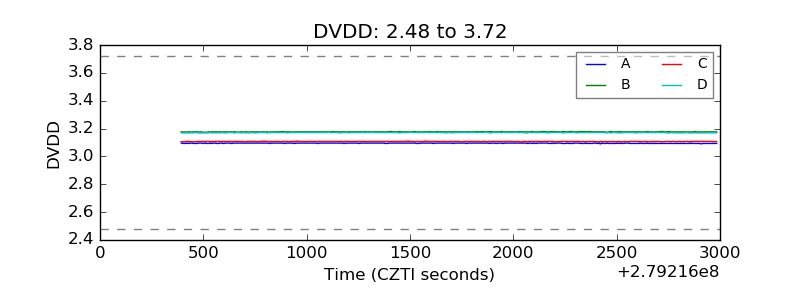 |
| Temperature 1 | 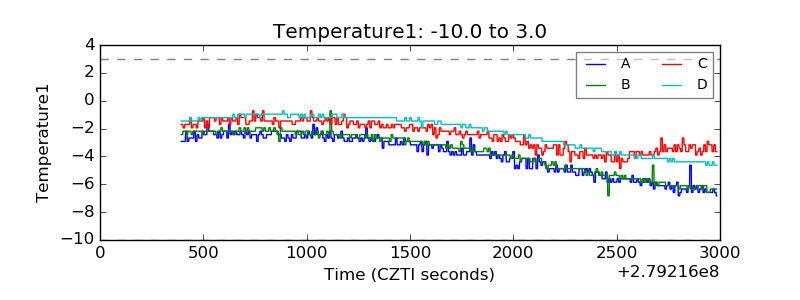 |
| Veto HV Monitor | 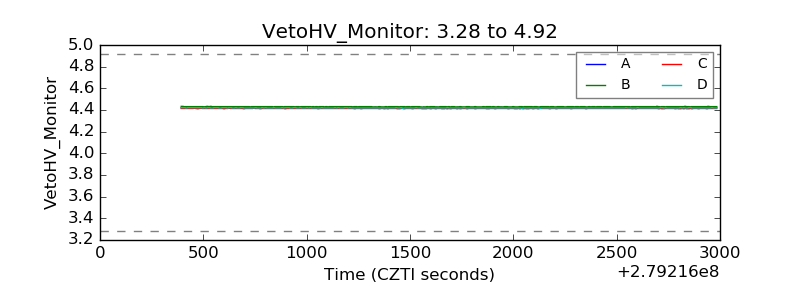 |
| Veto LLD | 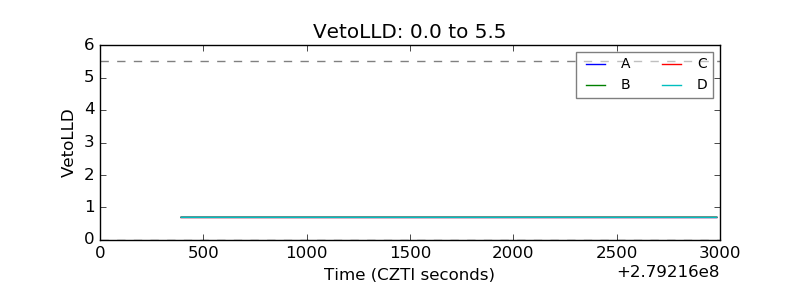 |
| Alpha Counter | 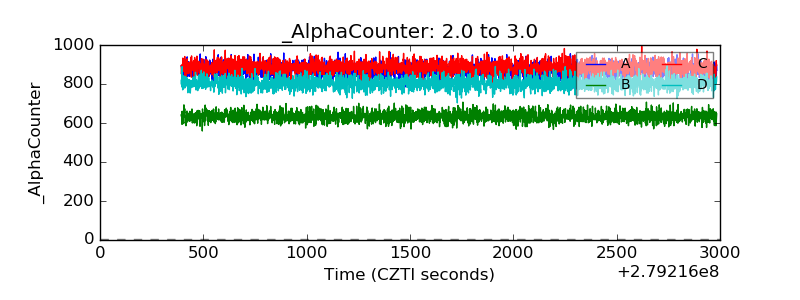 |
| _CPM_Rate | 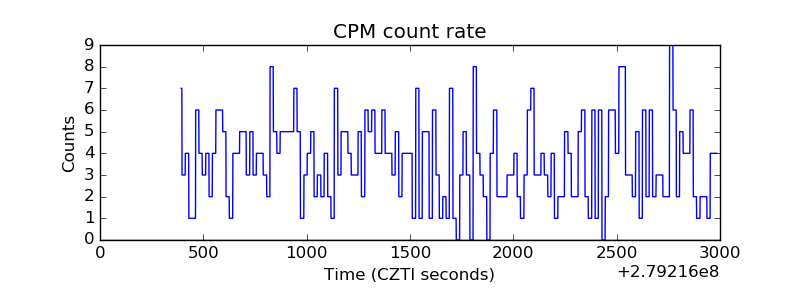 |
| CZT Counter | 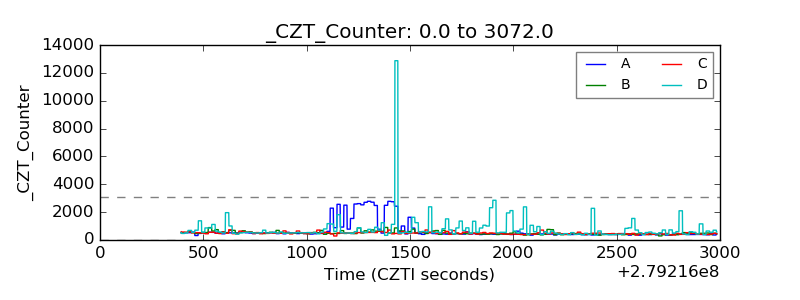 |
| +2.5 Volts monitor |  |
| +5 Volts monitor |  |
| _ROLL_ROT | 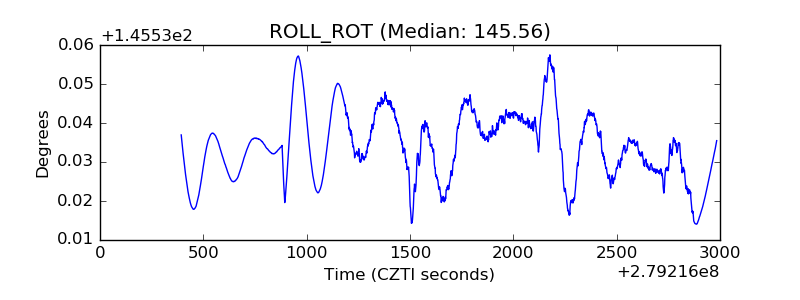 |
| _Roll_DEC | 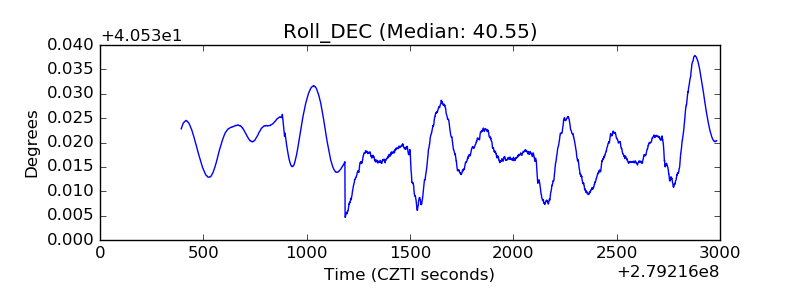 |
| _Roll_RA | 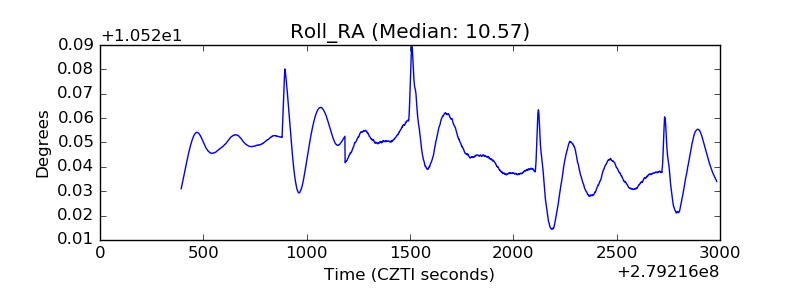 |
| Veto Counter | 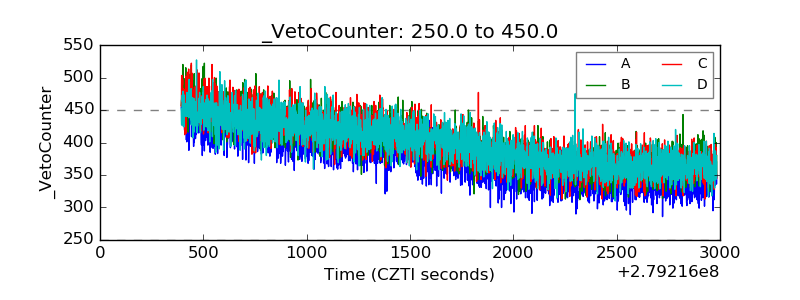 |