| Param | Original file | Final file |
|---|---|---|
| Filename | modeM0/AS1A05_004T07_9000002492_16784cztM0_level2.evt | modeM0/AS1A05_004T07_9000002492_16784cztM0_level2_quad_clean.evt |
| Size (bytes) | 872,343,360 | 122,901,120 |
| Size | 831.9 MB | 117.2 MB |
| Events in quadrant A | 6,613,697 | 742,623 |
| Events in quadrant B | 5,253,133 | 781,151 |
| Events in quadrant C | 5,655,308 | 748,472 |
| Events in quadrant D | 8,184,309 | 719,106 |
| Mode M9 | |||
|---|---|---|---|
| Quadrant | BADHDUFLAG | Total packets | Discarded packets |
| A | 0 | 14 | 0 |
| B | 0 | 14 | 0 |
| C | 0 | 14 | 0 |
| D | 0 | 14 | 0 |
| Mode SS | |||
|---|---|---|---|
| Quadrant | BADHDUFLAG | Total packets | Discarded packets |
| A | 0 | 216 | 0 |
| B | 0 | 216 | 0 |
| C | 0 | 216 | 0 |
| D | 0 | 216 | 0 |
| Mode M0 | |||
|---|---|---|---|
| Quadrant | BADHDUFLAG | Total packets | Discarded packets |
| A | 0 | 26739 | 3 |
| B | 0 | 22343 | 2 |
| C | 0 | 23669 | 2 |
| D | 0 | 31672 | 2 |
| Quadrant | Total seconds | Saturated seconds | Saturation percentage |
|---|---|---|---|
| A | 10542 | 539 | 5.112882% |
| B | 10542 | 82 | 0.777841% |
| C | 10542 | 146 | 1.384936% |
| D | 10542 | 310 | 2.940618% |
Noise dominated data is calculated using 1-second bins in cleaned event files. If a bin has >2000 counts, and if more than 50% of those come from <1% of pixels, then it is considered to be noise-dominated and hence unusable.
| Quadrant | # 1 sec bins | Bins with >0 counts | Bins with >2000 counts | High rate bins dominated by noise | Noise dominated (total time) | Noise dominated (detector-on time) | Marked lightcurve |
|---|---|---|---|---|---|---|---|
| A | 11968 | 10545 | 265 | 265 | 2.21% | 2.51% | 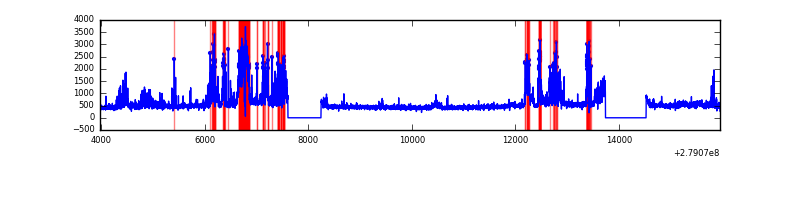 |
| B | 11968 | 10545 | 9 | 9 | 0.08% | 0.09% | 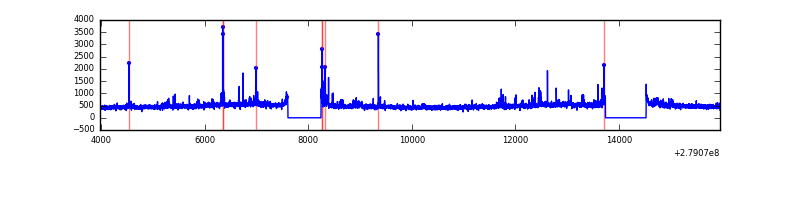 |
| C | 11968 | 10545 | 17 | 17 | 0.14% | 0.16% | 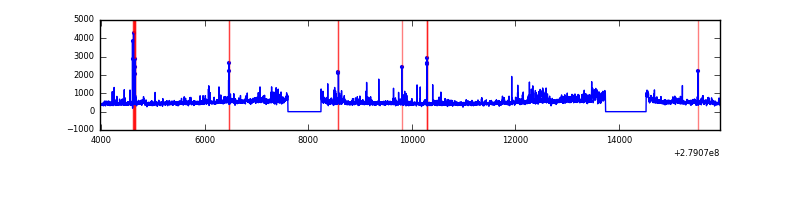 |
| D | 11968 | 10545 | 179 | 179 | 1.50% | 1.70% | 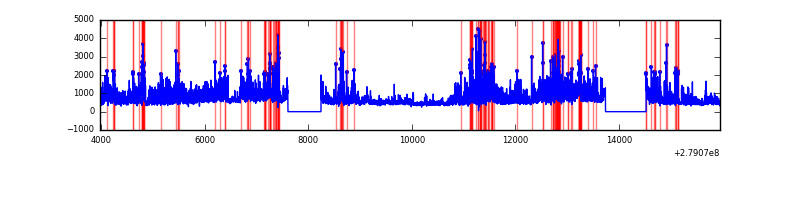 |
Top three noisy pixels from each quadrant. If the there are fewer than three noisy pixels in the level2.evt file, extra rows are filled as -1
| Pixel properties | Quadrant properties | ||||||
|---|---|---|---|---|---|---|---|
| Quadrant | DetID | PixID | Counts | Sigma | Mean | Median | Sigma |
| A | 15 | 174 | 1852594 | 7412.05 | 1235 | 1207 | 249.8 |
| A | 9 | 143 | 18520 | 69.31 | 1235 | 1207 | 249.8 |
| A | 0 | 226 | 10762 | 38.25 | 1235 | 1207 | 249.8 |
| B | 0 | 229 | 154045 | 635.76 | 1257 | 1224 | 240.4 |
| B | 15 | 35 | 77483 | 317.25 | 1257 | 1224 | 240.4 |
| B | 0 | 189 | 30255 | 120.77 | 1257 | 1224 | 240.4 |
| C | 3 | 233 | 461127 | 1616.96 | 1209 | 1217 | 284.4 |
| C | 0 | 207 | 286356 | 1002.5 | 1209 | 1217 | 284.4 |
| C | 14 | 238 | 183640 | 641.37 | 1209 | 1217 | 284.4 |
| D | 1 | 52 | 1991990 | 6702.29 | 1212 | 1174 | 297.0 |
| D | 12 | 110 | 1149911 | 3867.34 | 1212 | 1174 | 297.0 |
| D | 12 | 218 | 259377 | 869.27 | 1212 | 1174 | 297.0 |
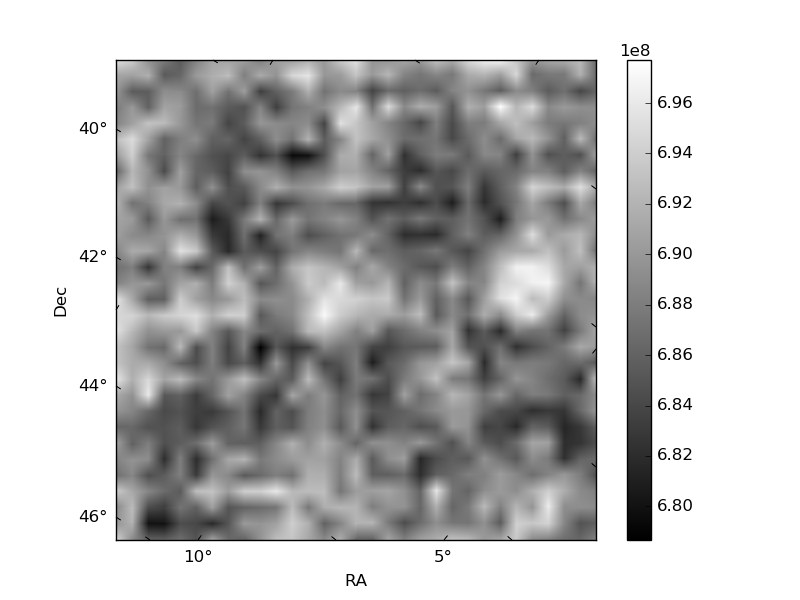
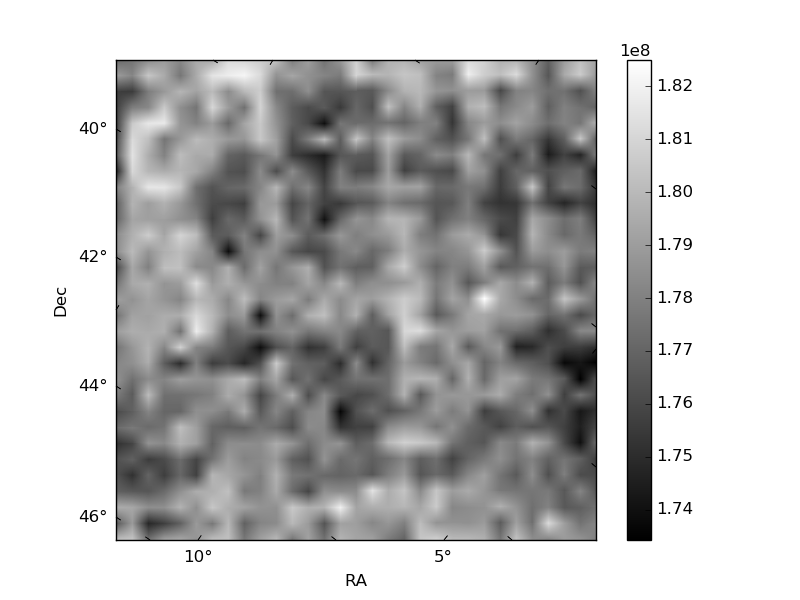
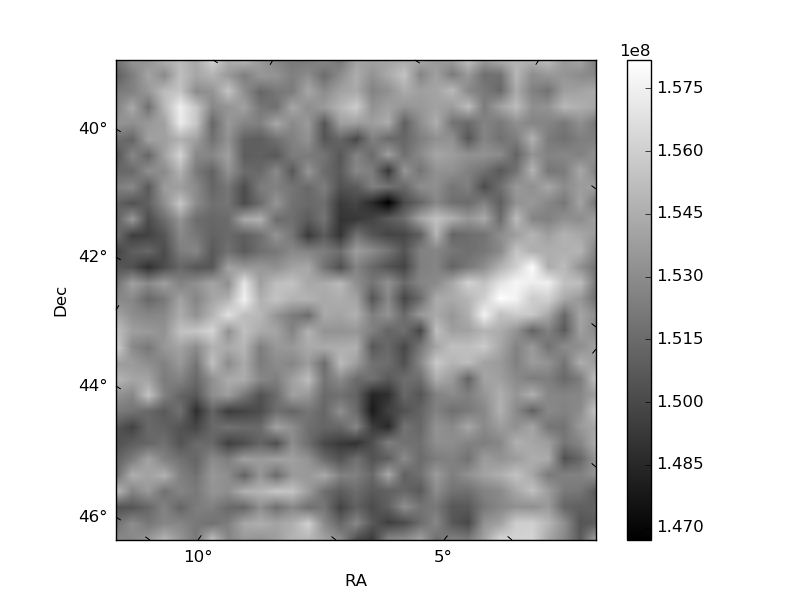
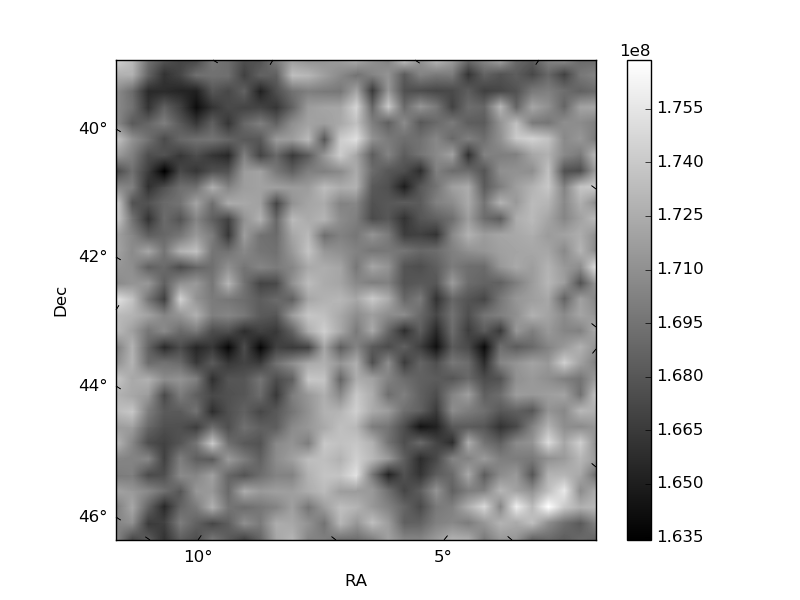
Histogram calculated using DETX and DETY for each event in the final _common_clean file
| Quadrant A | 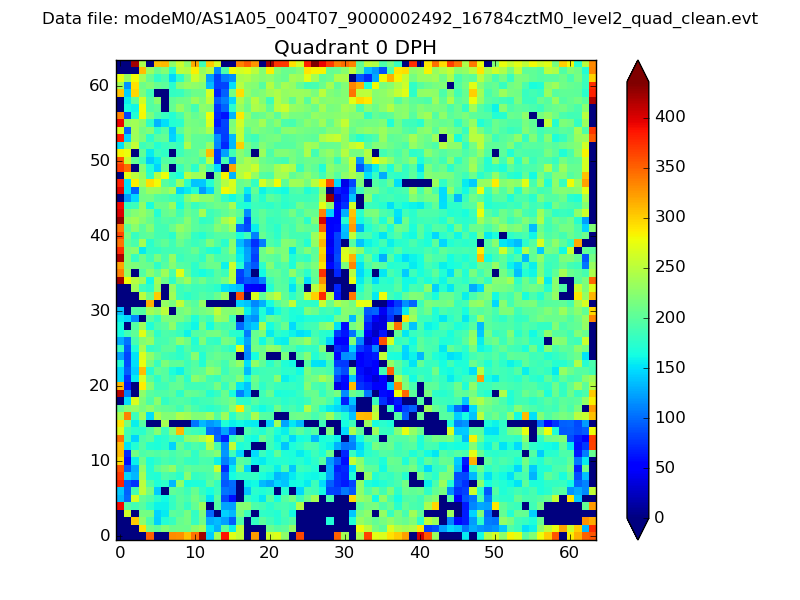 |
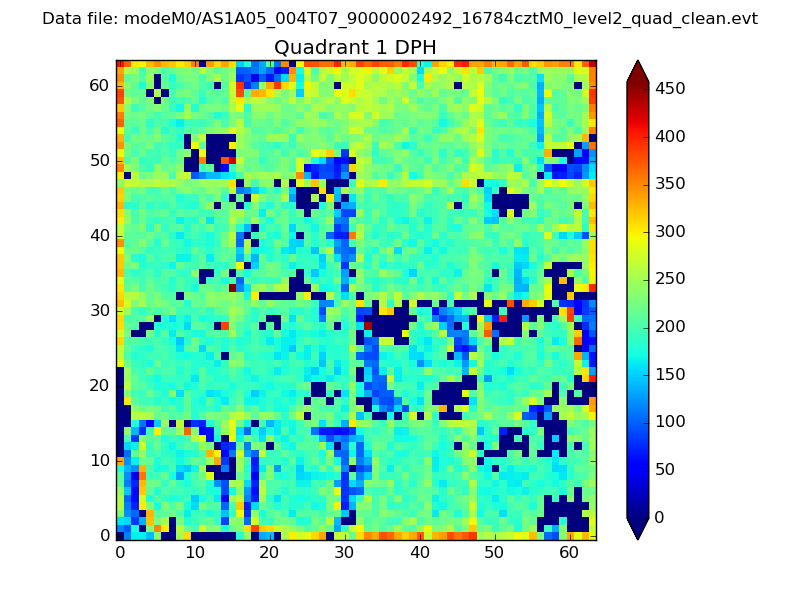 |
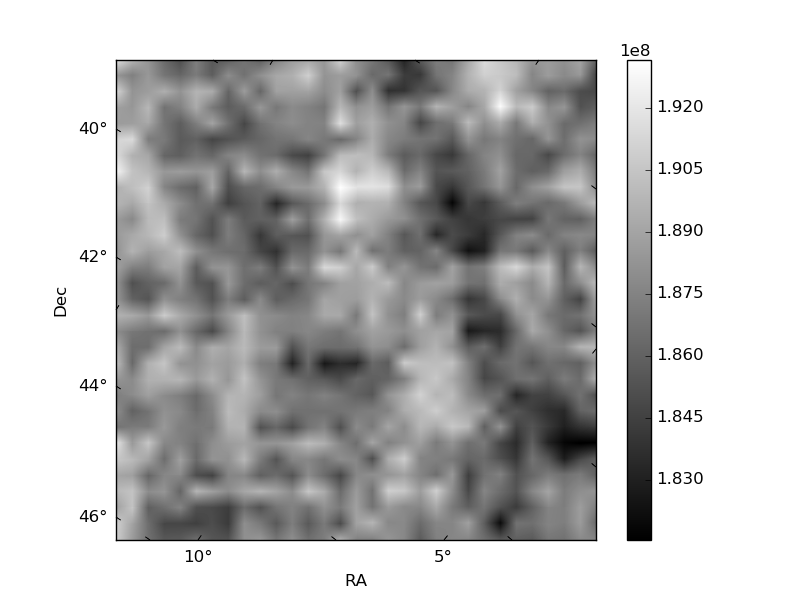
Quadrant B |
|---|---|---|---|
| Quadrant D | 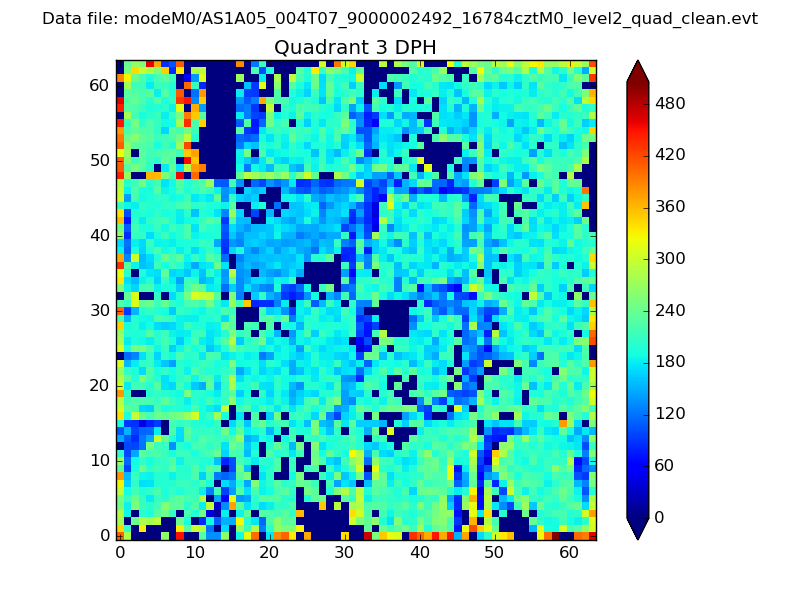 |
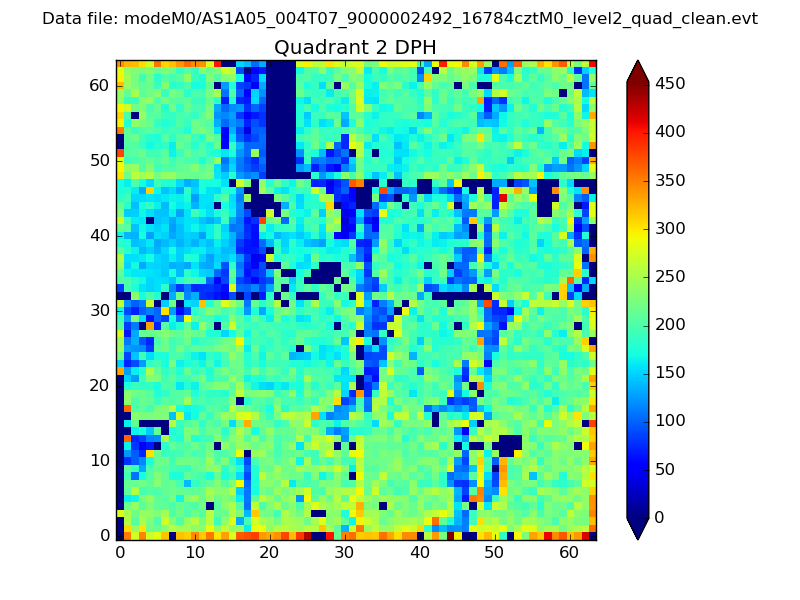 |
Quadrant C |
| Plot type | Count rate plots | Images |
|---|---|---|
| Comparison with Poisson distribution Blue bars denote a histogram of data divided into 1 sec bins. Red curve is a Poisson curve with rate = median count rate of data. |
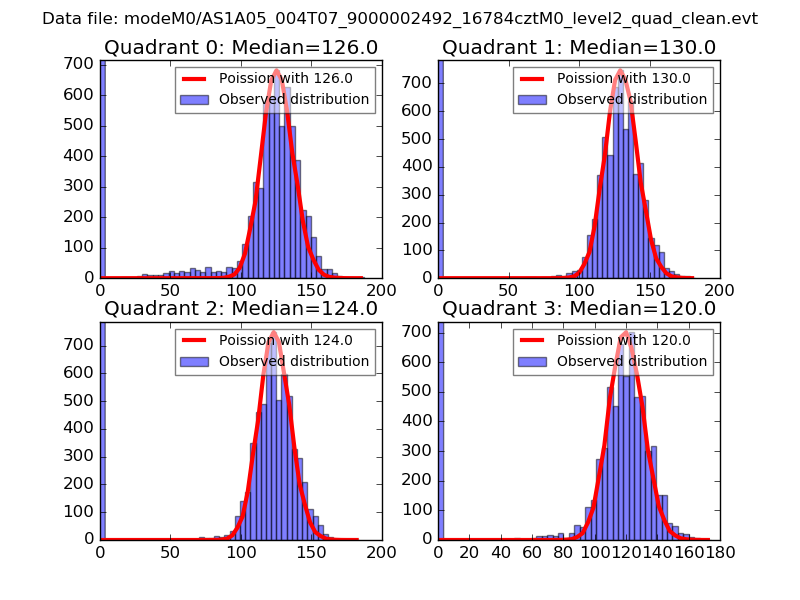 |
 |
| Quadrant-wise count rates Data is divided into 100 sec bins |
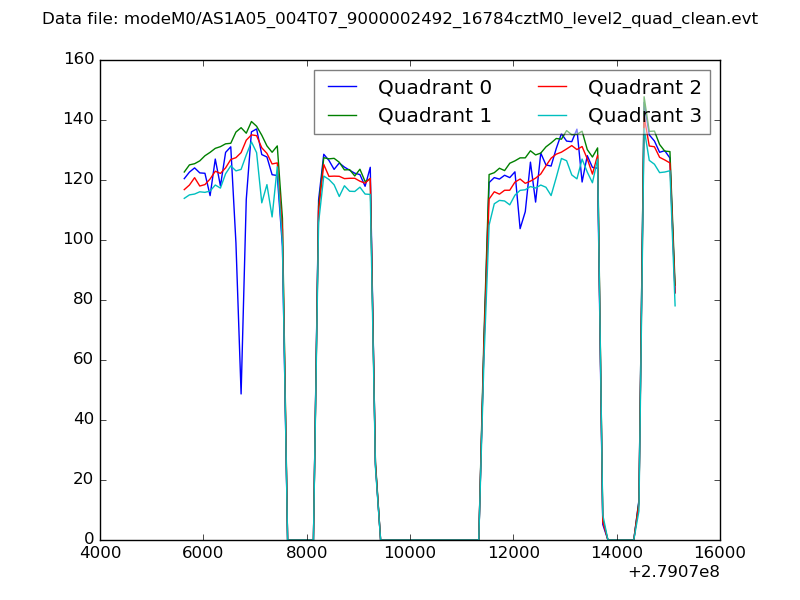 |
|
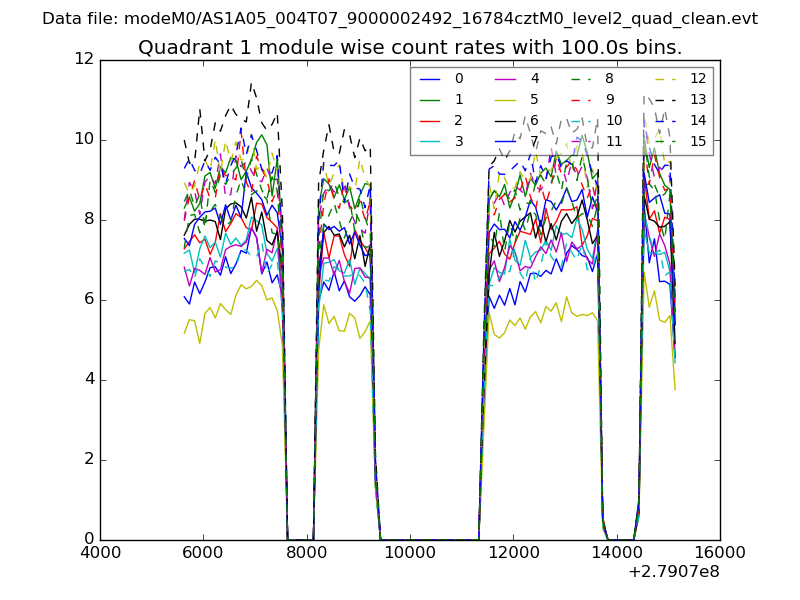
| Module-wise count rates for Quadrant A Data is divided into 100 sec bins |
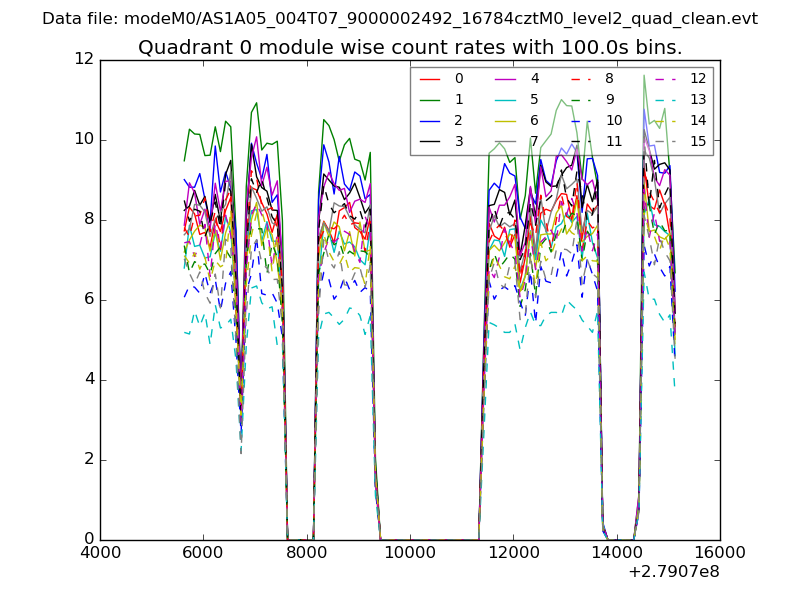 |
 |
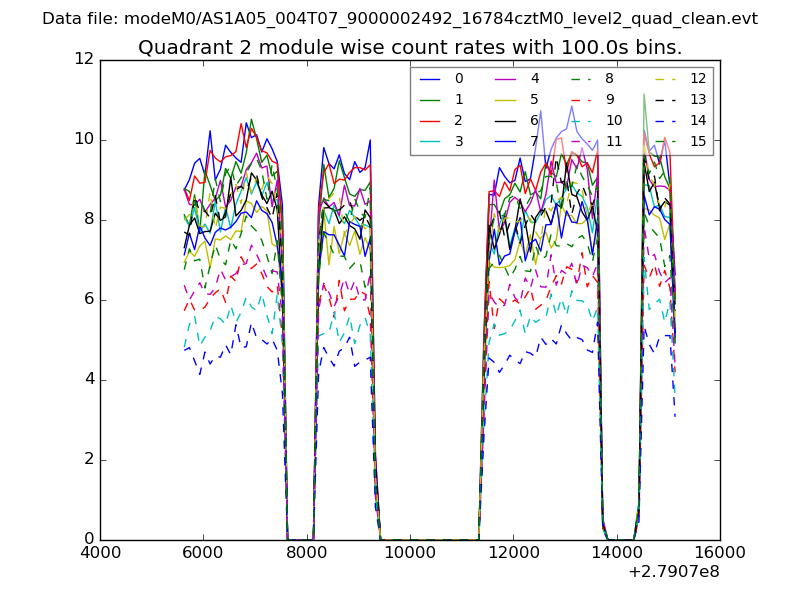
| Module-wise count rates for Quadrant B Data is divided into 100 sec bins |
 |
 |
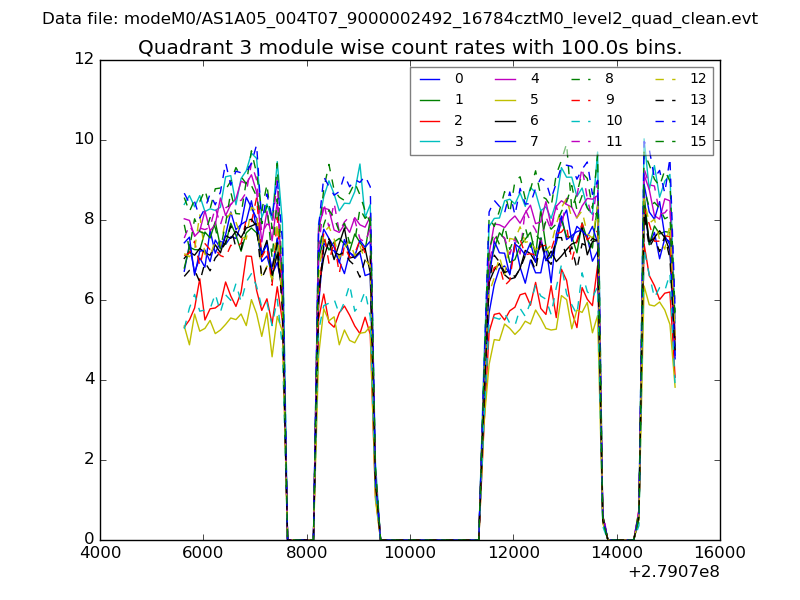
| Module-wise count rates for Quadrant C Data is divided into 100 sec bins |
 |
 |
| Module-wise count rates for Quadrant D Data is divided into 100 sec bins |
 |
 |
| Parameter | Plot |
|---|---|
| CZT HV Monitor | 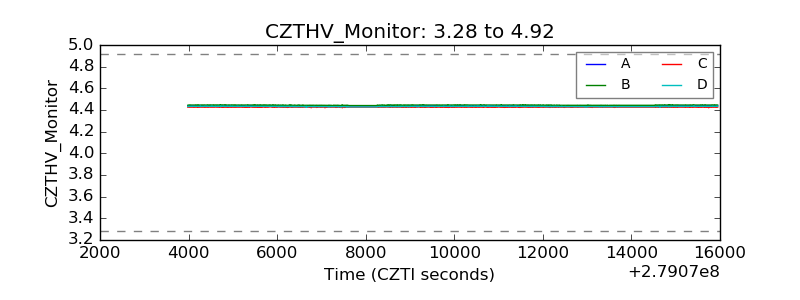 |
| D_VDD | 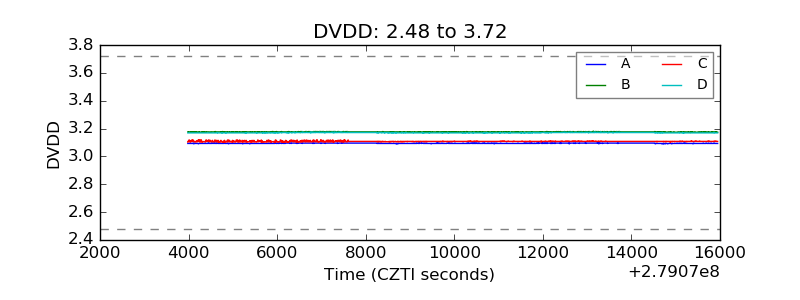 |
| Temperature 1 | 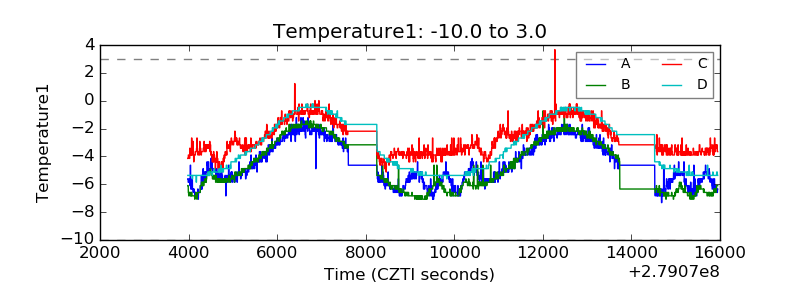 |
| Veto HV Monitor | 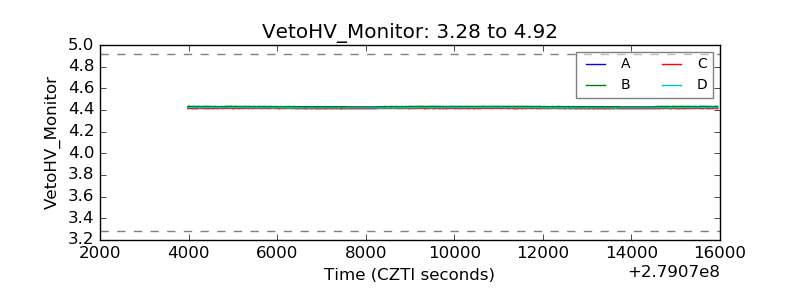 |
| Veto LLD | 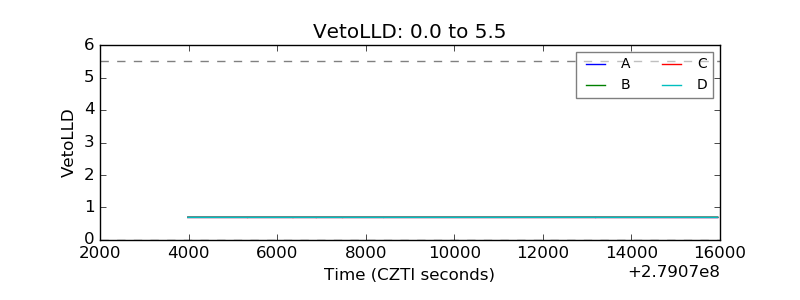 |
| Alpha Counter | 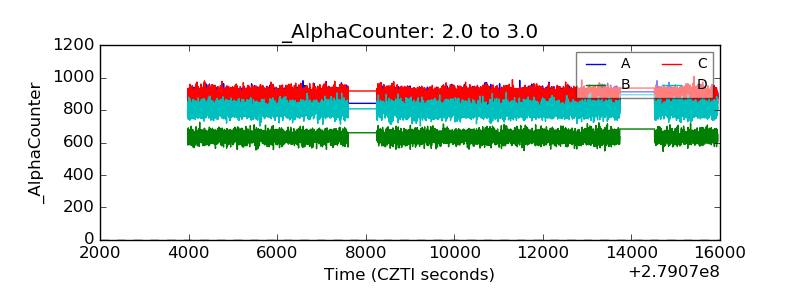 |
| _CPM_Rate | 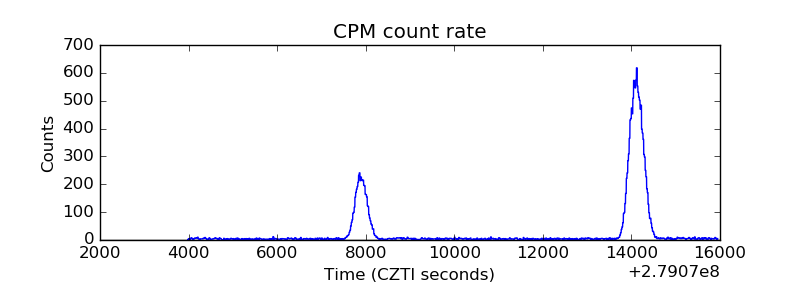 |
| CZT Counter | 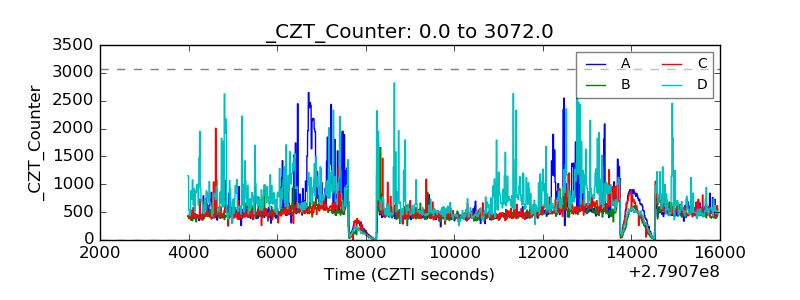 |
| +2.5 Volts monitor |  |
| +5 Volts monitor |  |
| _ROLL_ROT | 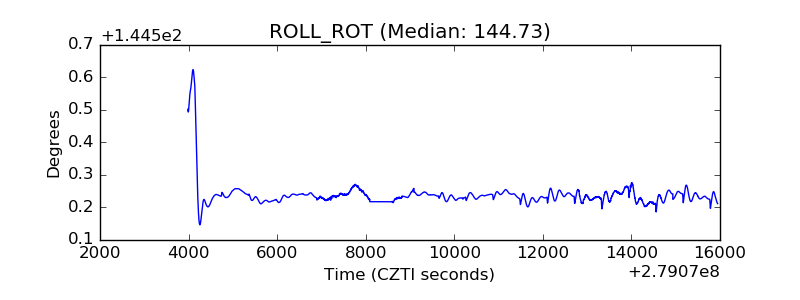 |
| _Roll_DEC | 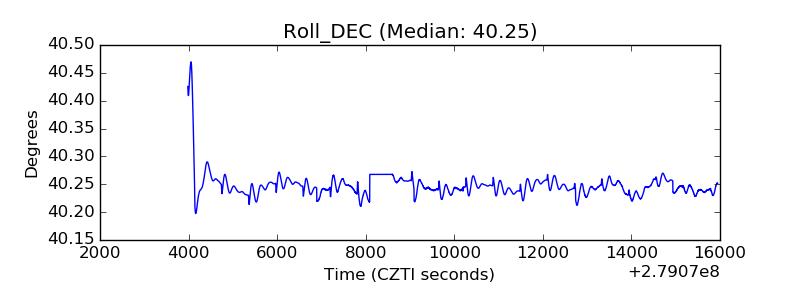 |
| _Roll_RA | 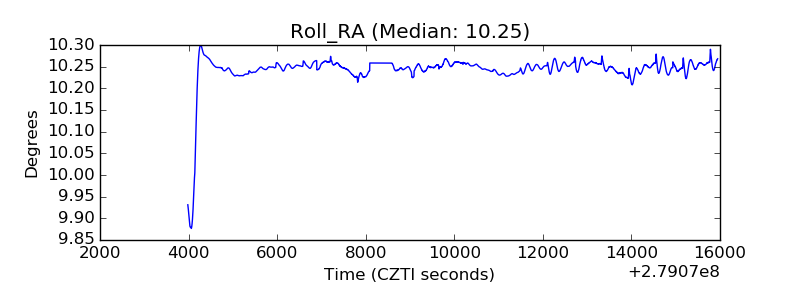 |
| Veto Counter | 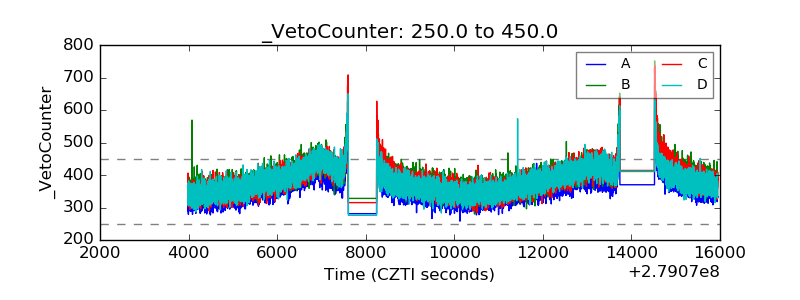 |