| Param | Original file | Final file |
|---|---|---|
| Filename | modeM0/AS1A05_004T07_9000002492_16785cztM0_level2.evt | modeM0/AS1A05_004T07_9000002492_16785cztM0_level2_quad_clean.evt |
| Size (bytes) | 566,916,480 | 72,371,520 |
| Size | 540.7 MB | 69.0 MB |
| Events in quadrant A | 4,885,664 | 424,496 |
| Events in quadrant B | 3,345,777 | 453,179 |
| Events in quadrant C | 3,655,062 | 434,690 |
| Events in quadrant D | 4,834,070 | 416,906 |
| Mode M9 | |||
|---|---|---|---|
| Quadrant | BADHDUFLAG | Total packets | Discarded packets |
| A | 0 | 11 | 0 |
| B | 0 | 11 | 0 |
| C | 0 | 11 | 0 |
| D | 0 | 12 | 0 |
| Mode SS | |||
|---|---|---|---|
| Quadrant | BADHDUFLAG | Total packets | Discarded packets |
| A | 0 | 134 | 0 |
| B | 0 | 134 | 0 |
| C | 0 | 134 | 0 |
| D | 0 | 134 | 0 |
| Mode M0 | |||
|---|---|---|---|
| Quadrant | BADHDUFLAG | Total packets | Discarded packets |
| A | 0 | 18744 | 3 |
| B | 0 | 14114 | 2 |
| C | 0 | 15039 | 2 |
| D | 0 | 18869 | 2 |
| Quadrant | Total seconds | Saturated seconds | Saturation percentage |
|---|---|---|---|
| A | 6624 | 470 | 7.095411% |
| B | 6624 | 50 | 0.754831% |
| C | 6624 | 86 | 1.298309% |
| D | 6624 | 252 | 3.804348% |
Noise dominated data is calculated using 1-second bins in cleaned event files. If a bin has >2000 counts, and if more than 50% of those come from <1% of pixels, then it is considered to be noise-dominated and hence unusable.
| Quadrant | # 1 sec bins | Bins with >0 counts | Bins with >2000 counts | High rate bins dominated by noise | Noise dominated (total time) | Noise dominated (detector-on time) | Marked lightcurve |
|---|---|---|---|---|---|---|---|
| A | 7565 | 6626 | 344 | 344 | 4.55% | 5.19% | 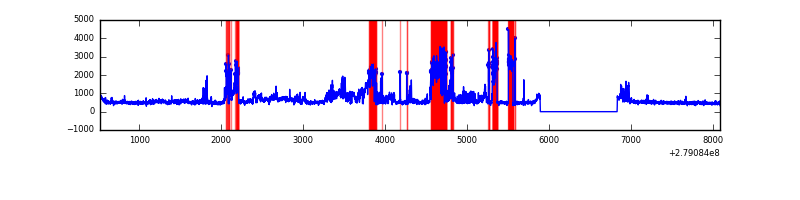 |
| B | 7565 | 6626 | 1 | 1 | 0.01% | 0.02% | 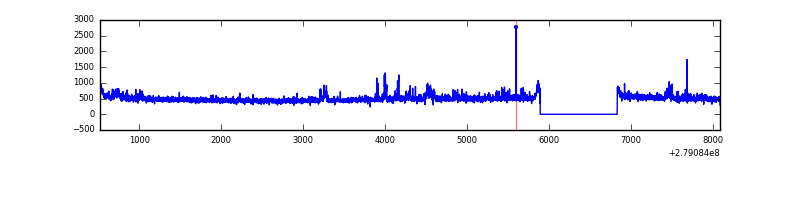 |
| C | 7565 | 6626 | 3 | 3 | 0.04% | 0.05% | 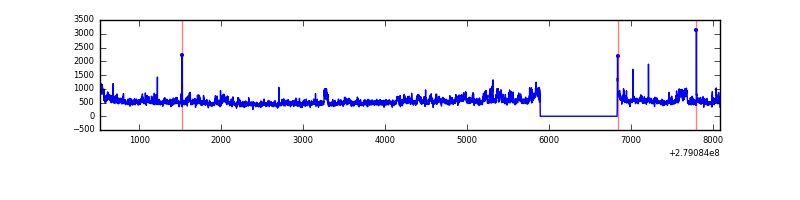 |
| D | 7565 | 6626 | 166 | 166 | 2.19% | 2.51% | 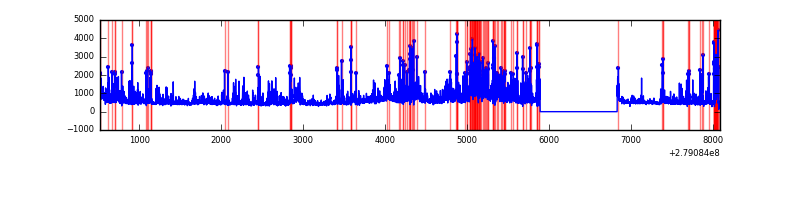 |
Top three noisy pixels from each quadrant. If the there are fewer than three noisy pixels in the level2.evt file, extra rows are filled as -1
| Pixel properties | Quadrant properties | ||||||
|---|---|---|---|---|---|---|---|
| Quadrant | DetID | PixID | Counts | Sigma | Mean | Median | Sigma |
| A | 15 | 174 | 1784561 | 11256.3 | 781 | 765 | 158.5 |
| A | 15 | 190 | 59201 | 368.75 | 781 | 765 | 158.5 |
| A | 9 | 143 | 22699 | 138.41 | 781 | 765 | 158.5 |
| B | 15 | 35 | 80635 | 515.22 | 805 | 785 | 155.0 |
| B | 0 | 229 | 41369 | 261.86 | 805 | 785 | 155.0 |
| B | 0 | 230 | 21725 | 135.11 | 805 | 785 | 155.0 |
| C | 3 | 233 | 476559 | 2623.84 | 772 | 779 | 181.3 |
| C | 14 | 238 | 119551 | 655.01 | 772 | 779 | 181.3 |
| C | 0 | 207 | 44716 | 242.3 | 772 | 779 | 181.3 |
| D | 1 | 52 | 1819469 | 9711.48 | 767 | 743 | 187.3 |
| D | 12 | 218 | 48592 | 255.5 | 767 | 743 | 187.3 |
| D | 10 | 70 | 33463 | 174.72 | 767 | 743 | 187.3 |
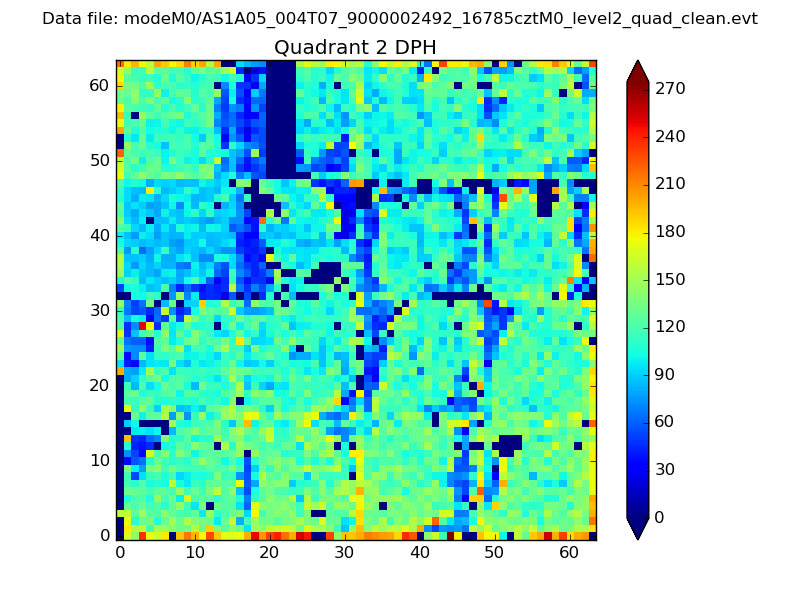
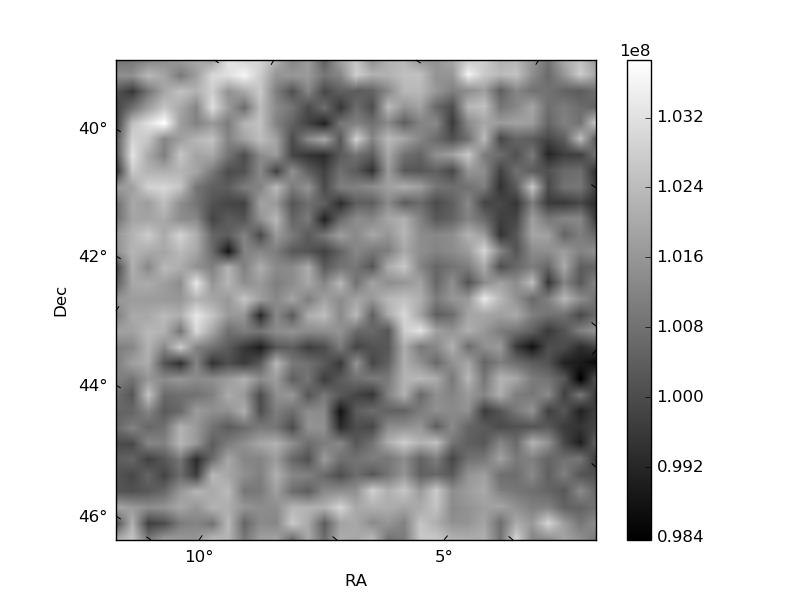
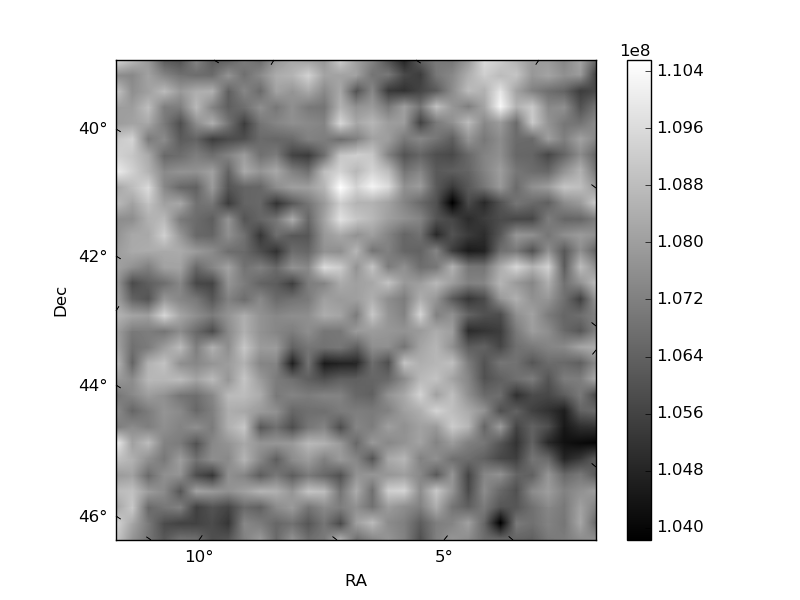
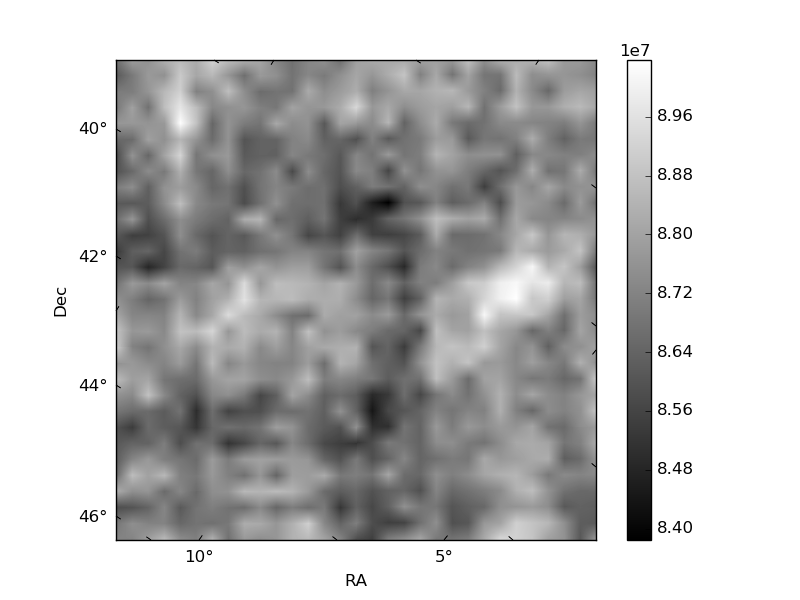
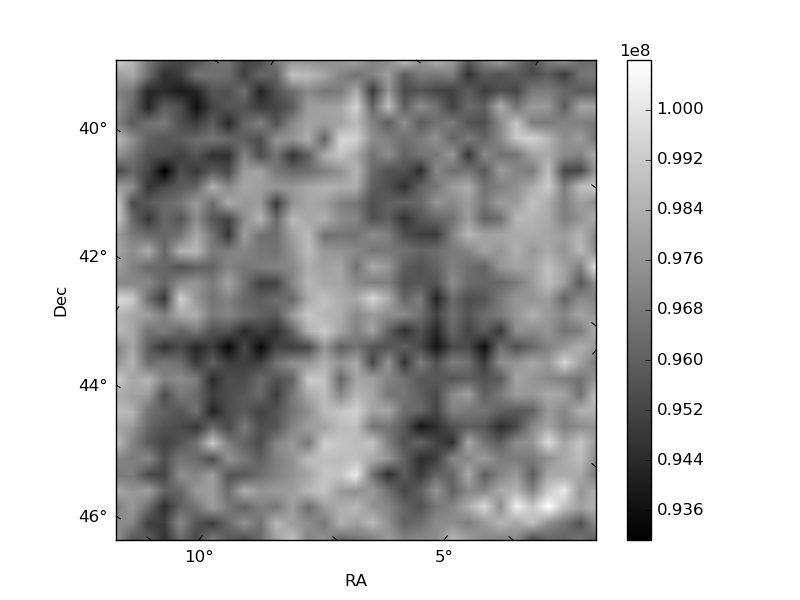
Histogram calculated using DETX and DETY for each event in the final _common_clean file
| Quadrant A | 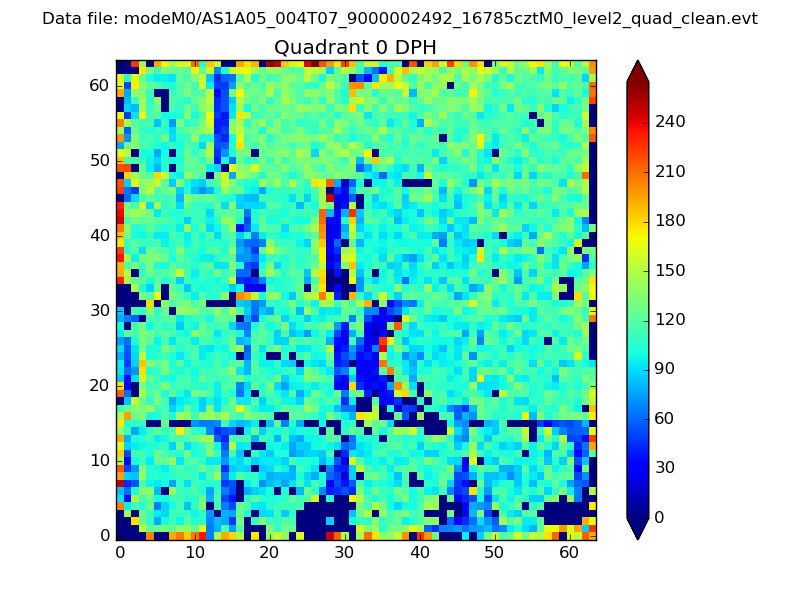 |
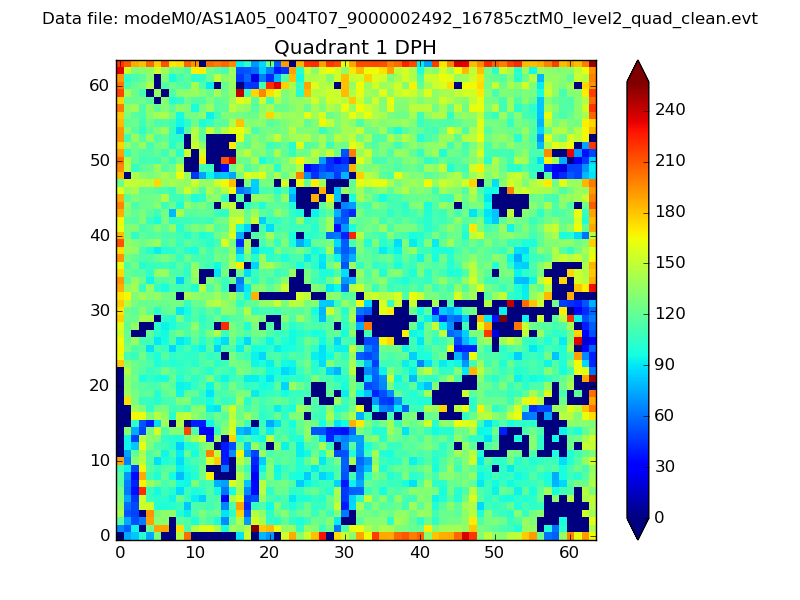 |
Quadrant B |
|---|---|---|---|
| Quadrant D | 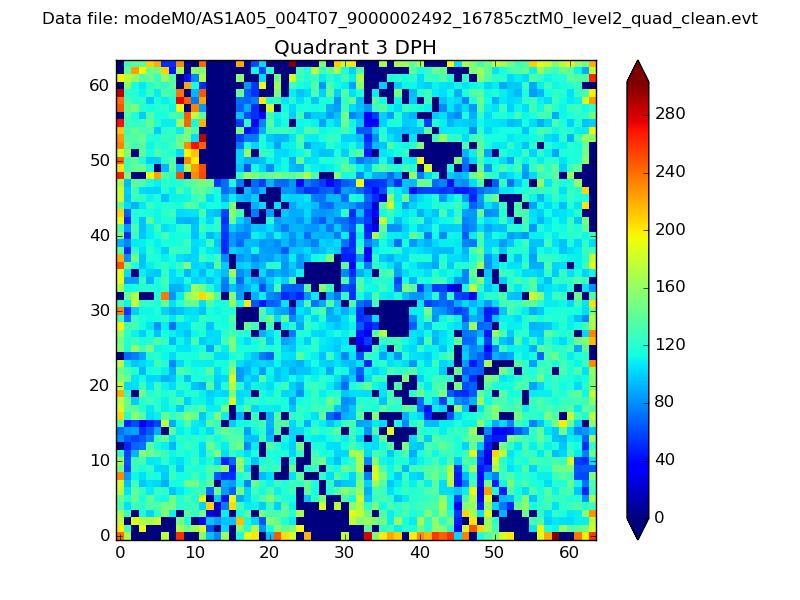 |
 |
Quadrant C |
| Plot type | Count rate plots | Images |
|---|---|---|
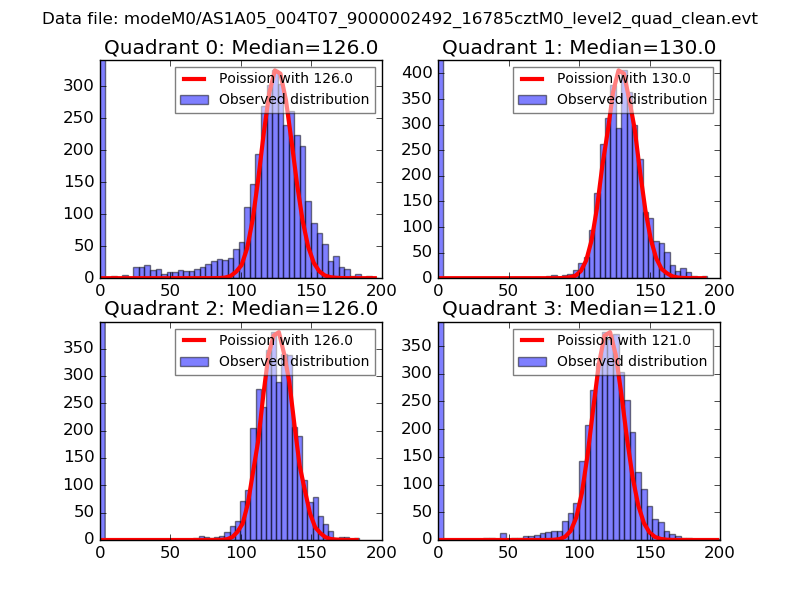
| Comparison with Poisson distribution Blue bars denote a histogram of data divided into 1 sec bins. Red curve is a Poisson curve with rate = median count rate of data. |
 |
 |
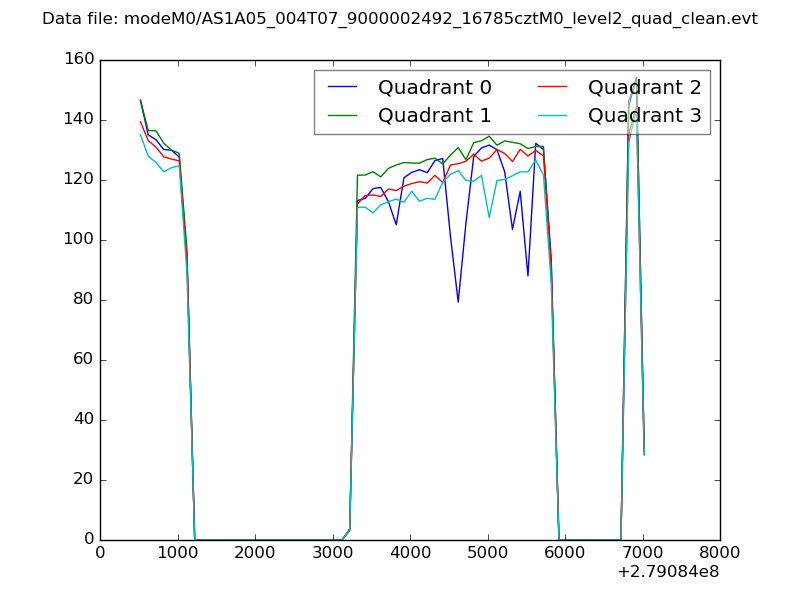
| Quadrant-wise count rates Data is divided into 100 sec bins |
 |
|
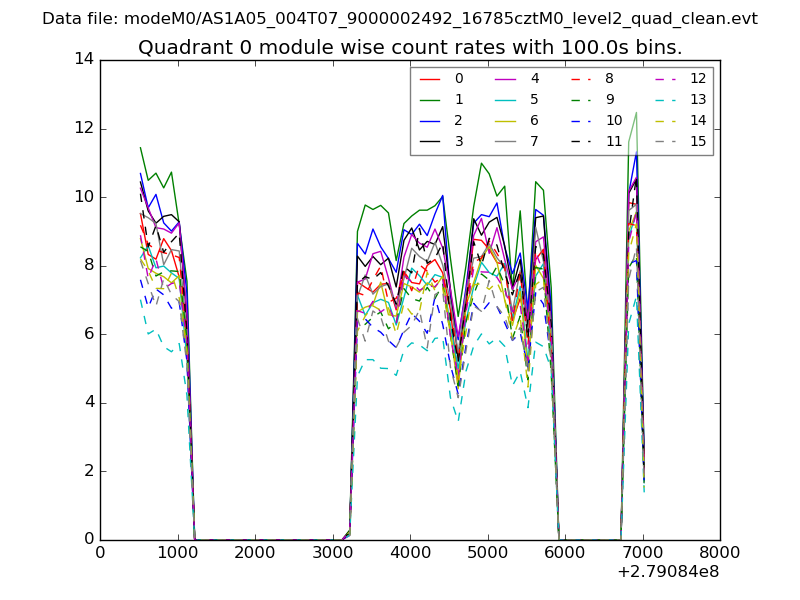
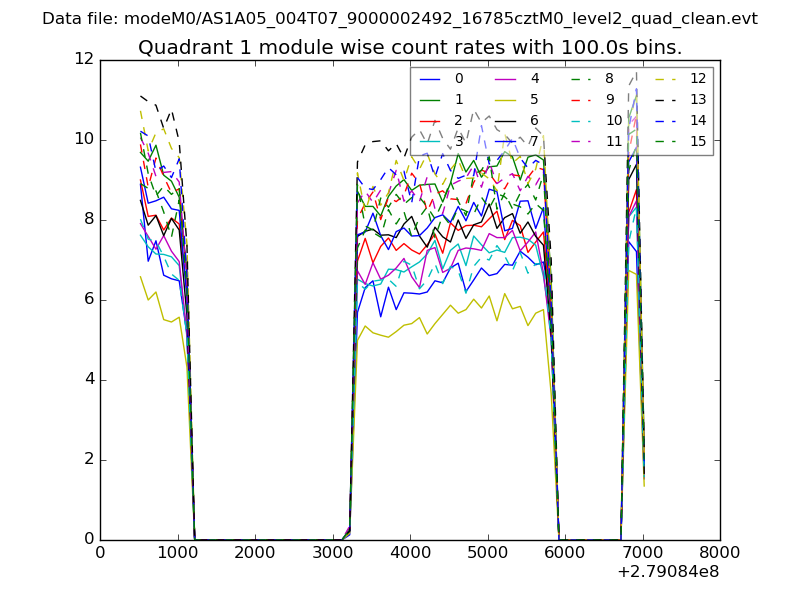
| Module-wise count rates for Quadrant A Data is divided into 100 sec bins |
 |
 |
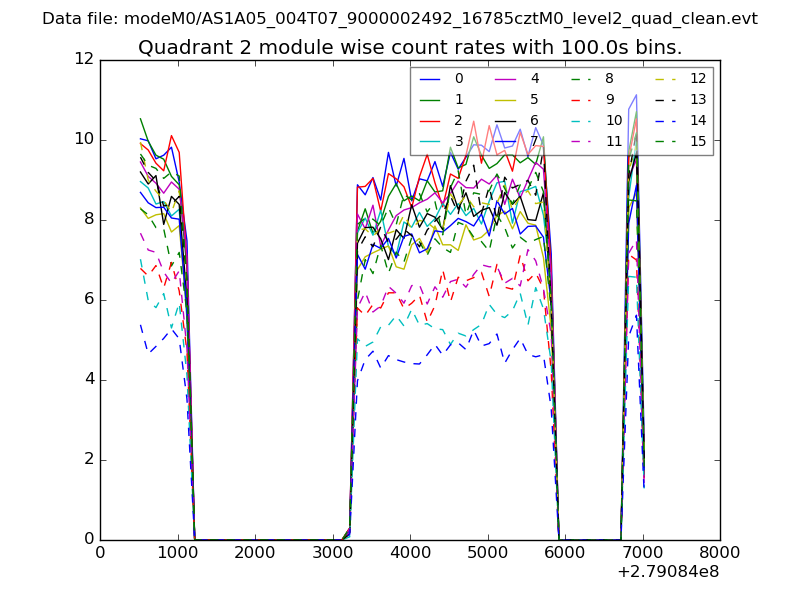
| Module-wise count rates for Quadrant B Data is divided into 100 sec bins |
 |
 |
| Module-wise count rates for Quadrant C Data is divided into 100 sec bins |
 |
 |
| Module-wise count rates for Quadrant D Data is divided into 100 sec bins |
 |
 |
| Parameter | Plot |
|---|---|
| CZT HV Monitor | 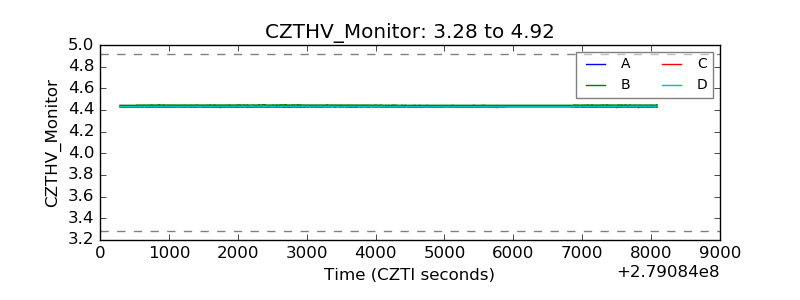 |
| D_VDD | 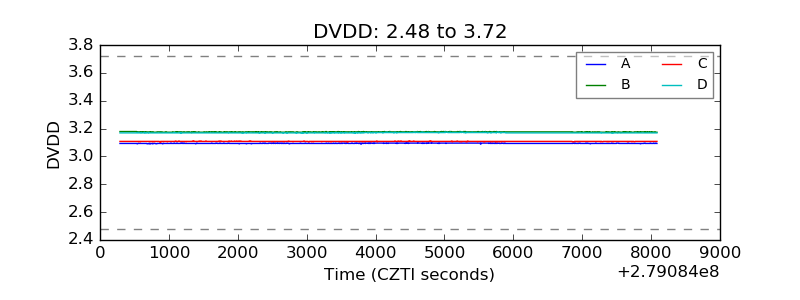 |
| Temperature 1 | 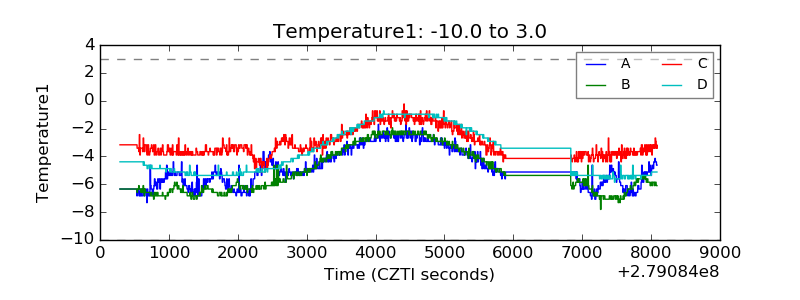 |
| Veto HV Monitor | 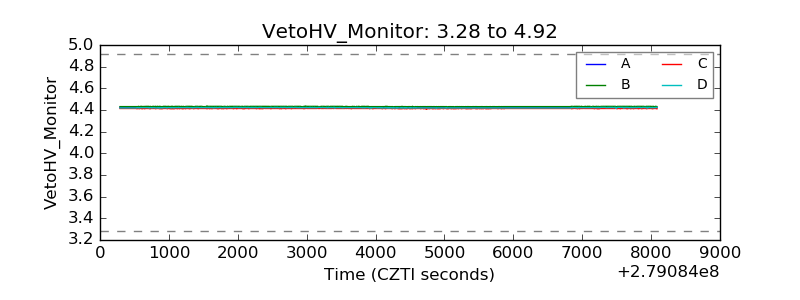 |
| Veto LLD | 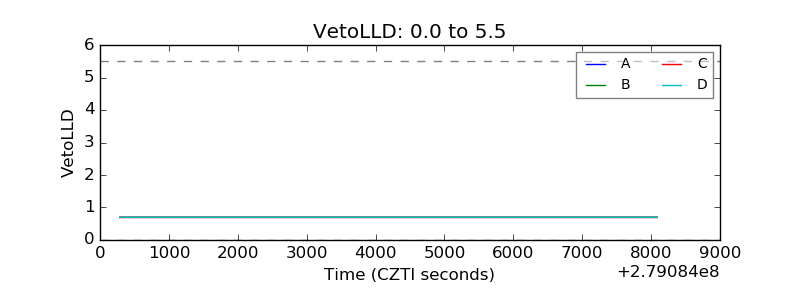 |
| Alpha Counter | 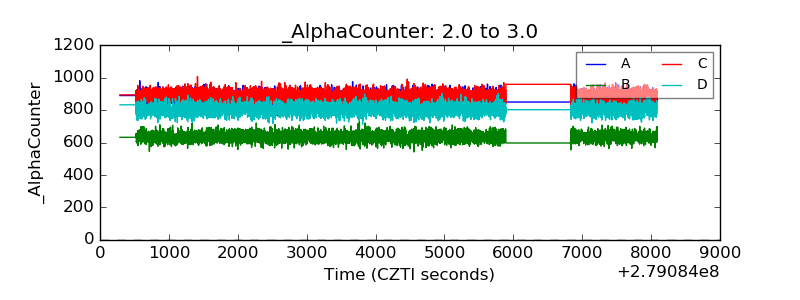 |
| _CPM_Rate | 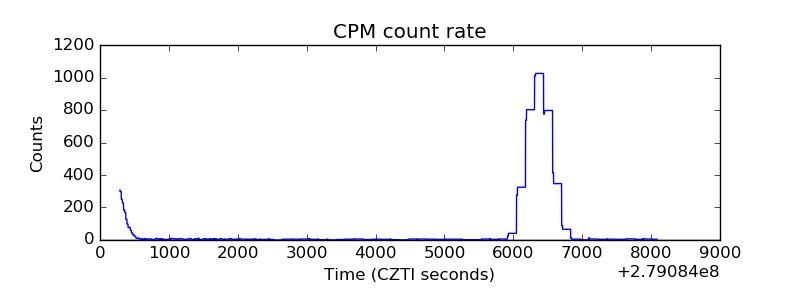 |
| CZT Counter | 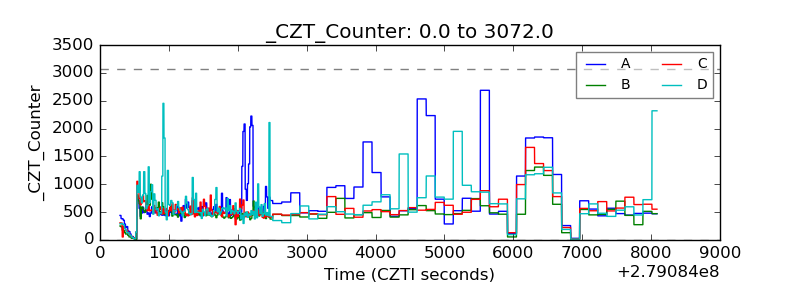 |
| +2.5 Volts monitor |  |
| +5 Volts monitor |  |
| _ROLL_ROT | 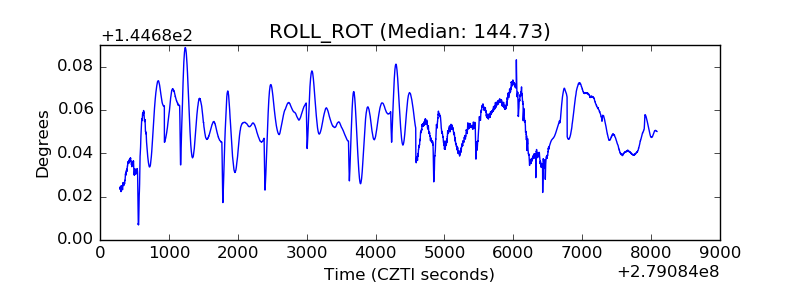 |
| _Roll_DEC | 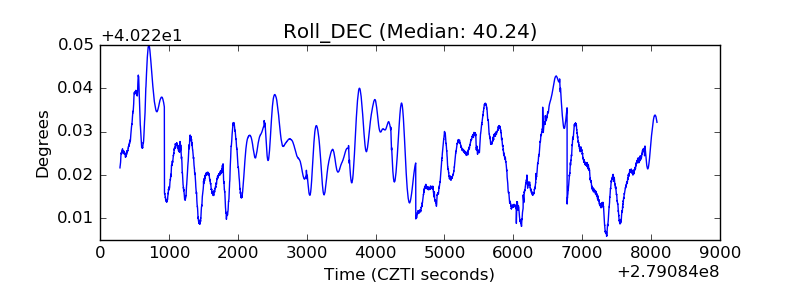 |
| _Roll_RA | 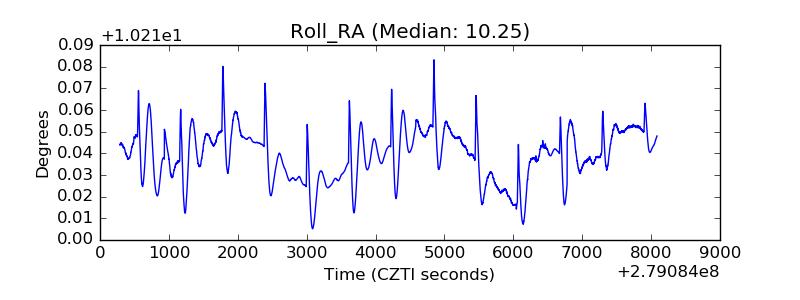 |
| Veto Counter | 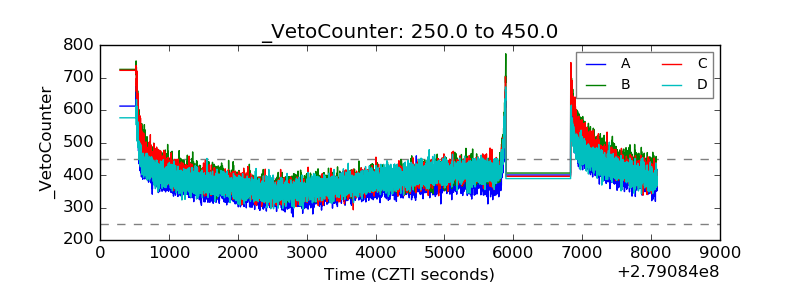 |