| Param | Original file | Final file |
|---|---|---|
| Filename | modeM0/AS1A05_004T07_9000002492_16789cztM0_level2.evt | modeM0/AS1A05_004T07_9000002492_16789cztM0_level2_quad_clean.evt |
| Size (bytes) | 622,013,760 | 88,911,360 |
| Size | 593.2 MB | 84.8 MB |
| Events in quadrant A | 3,802,133 | 586,660 |
| Events in quadrant B | 3,766,501 | 581,039 |
| Events in quadrant C | 3,900,838 | 552,301 |
| Events in quadrant D | 6,919,977 | 510,230 |
| Mode M9 | |||
|---|---|---|---|
| Quadrant | BADHDUFLAG | Total packets | Discarded packets |
| A | 0 | 25 | 0 |
| B | 0 | 25 | 0 |
| C | 0 | 25 | 0 |
| D | 0 | 25 | 0 |
| Mode SS | |||
|---|---|---|---|
| Quadrant | BADHDUFLAG | Total packets | Discarded packets |
| A | 0 | 134 | 0 |
| B | 0 | 134 | 0 |
| C | 0 | 134 | 0 |
| D | 0 | 134 | 0 |
| Mode M0 | |||
|---|---|---|---|
| Quadrant | BADHDUFLAG | Total packets | Discarded packets |
| A | 0 | 15441 | 3 |
| B | 0 | 15315 | 2 |
| C | 0 | 15802 | 2 |
| D | 0 | 25166 | 2 |
| Quadrant | Total seconds | Saturated seconds | Saturation percentage |
|---|---|---|---|
| A | 6633 | 150 | 2.261420% |
| B | 6633 | 179 | 2.698628% |
| C | 6633 | 194 | 2.924770% |
| D | 6633 | 856 | 12.905171% |
Noise dominated data is calculated using 1-second bins in cleaned event files. If a bin has >2000 counts, and if more than 50% of those come from <1% of pixels, then it is considered to be noise-dominated and hence unusable.
| Quadrant | # 1 sec bins | Bins with >0 counts | Bins with >2000 counts | High rate bins dominated by noise | Noise dominated (total time) | Noise dominated (detector-on time) | Marked lightcurve |
|---|---|---|---|---|---|---|---|
| A | 9059 | 6636 | 5 | 5 | 0.06% | 0.08% | 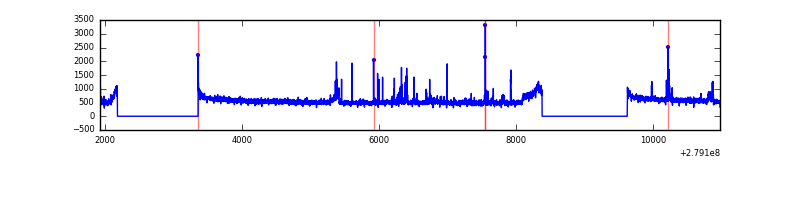 |
| B | 9059 | 6635 | 17 | 17 | 0.19% | 0.26% | 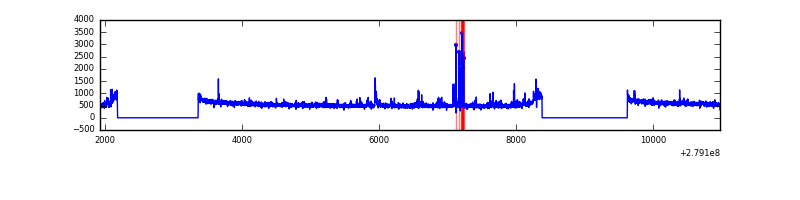 |
| C | 9059 | 6636 | 10 | 10 | 0.11% | 0.15% | 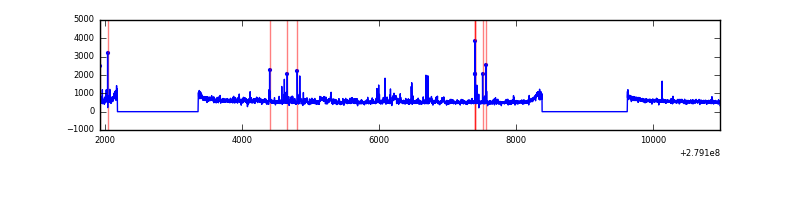 |
| D | 9059 | 6636 | 551 | 551 | 6.08% | 8.30% | 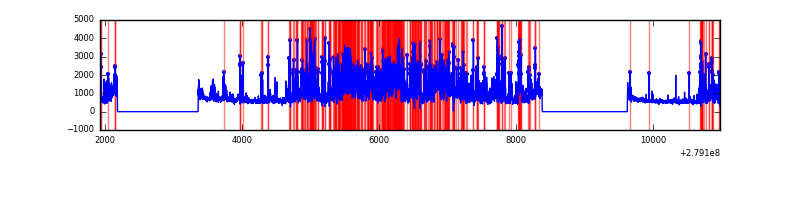 |
Top three noisy pixels from each quadrant. If the there are fewer than three noisy pixels in the level2.evt file, extra rows are filled as -1
| Pixel properties | Quadrant properties | ||||||
|---|---|---|---|---|---|---|---|
| Quadrant | DetID | PixID | Counts | Sigma | Mean | Median | Sigma |
| A | 15 | 174 | 181659 | 976.0 | 928 | 913 | 185.2 |
| A | 9 | 143 | 47120 | 249.51 | 928 | 913 | 185.2 |
| A | 10 | 234 | 8992 | 43.63 | 928 | 913 | 185.2 |
| B | 0 | 189 | 70210 | 405.97 | 912 | 892 | 170.7 |
| B | 15 | 35 | 63696 | 367.82 | 912 | 892 | 170.7 |
| B | 12 | 111 | 19511 | 109.05 | 912 | 892 | 170.7 |
| C | 3 | 233 | 272994 | 1371.39 | 862 | 873 | 198.4 |
| C | 14 | 238 | 135298 | 677.45 | 862 | 873 | 198.4 |
| C | 0 | 207 | 124763 | 624.36 | 862 | 873 | 198.4 |
| D | 1 | 52 | 2315823 | 11309.64 | 858 | 835 | 204.7 |
| D | 12 | 110 | 986932 | 4817.48 | 858 | 835 | 204.7 |
| D | 10 | 70 | 226295 | 1101.46 | 858 | 835 | 204.7 |
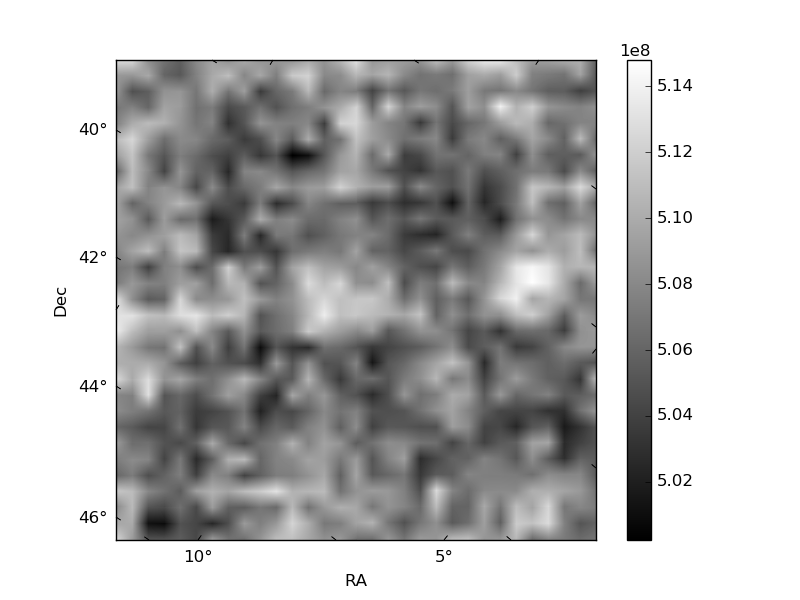
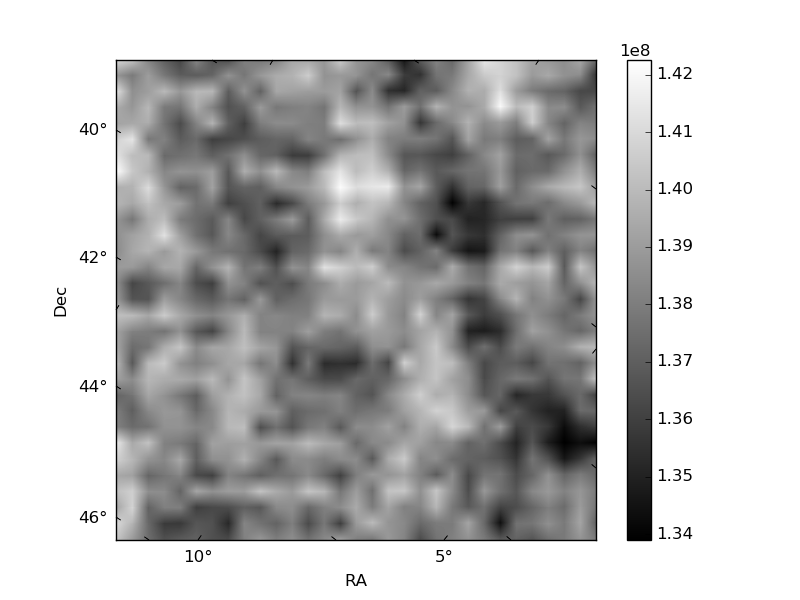
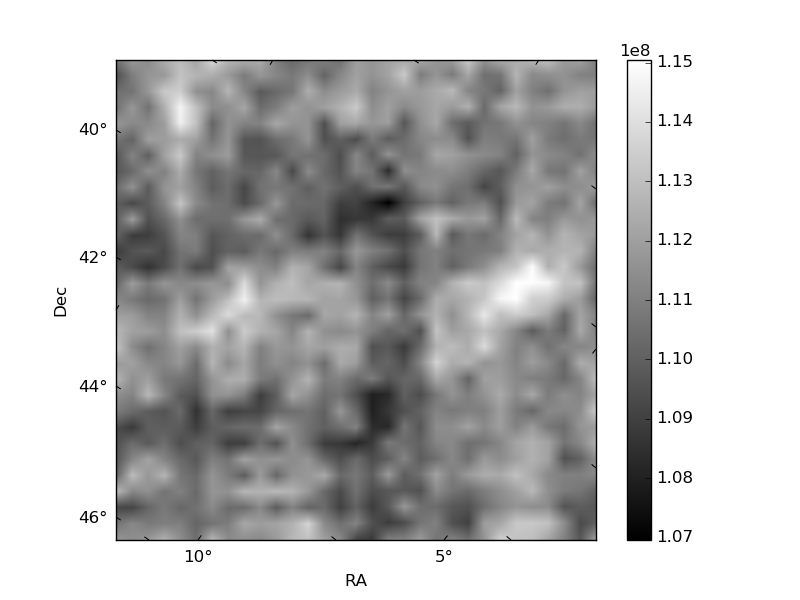
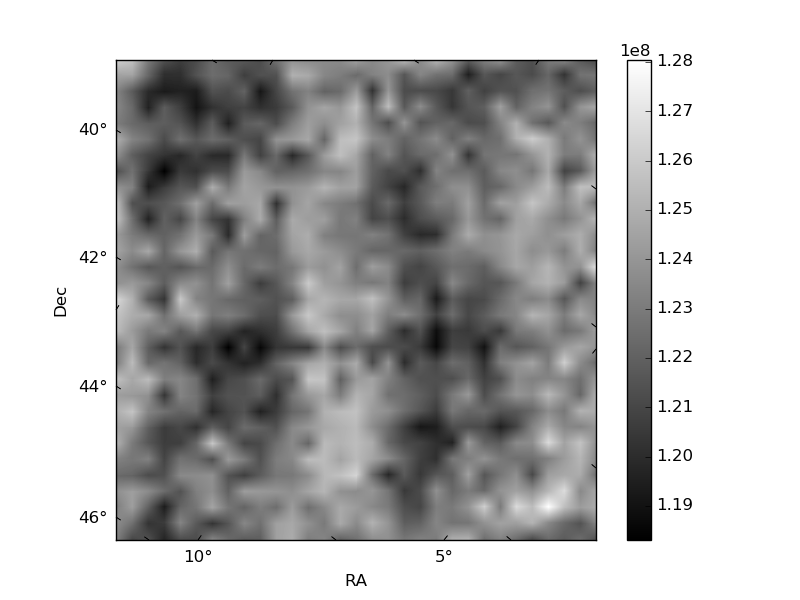
Histogram calculated using DETX and DETY for each event in the final _common_clean file
| Quadrant A | 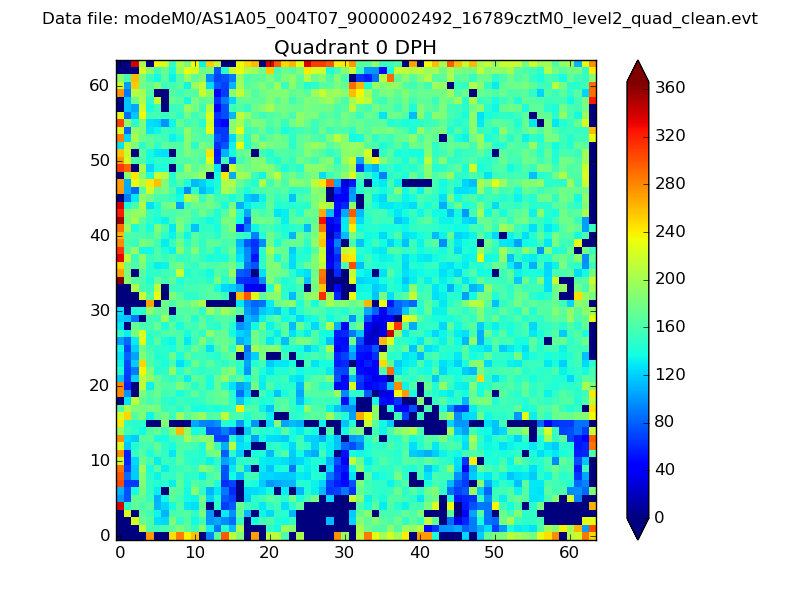 |
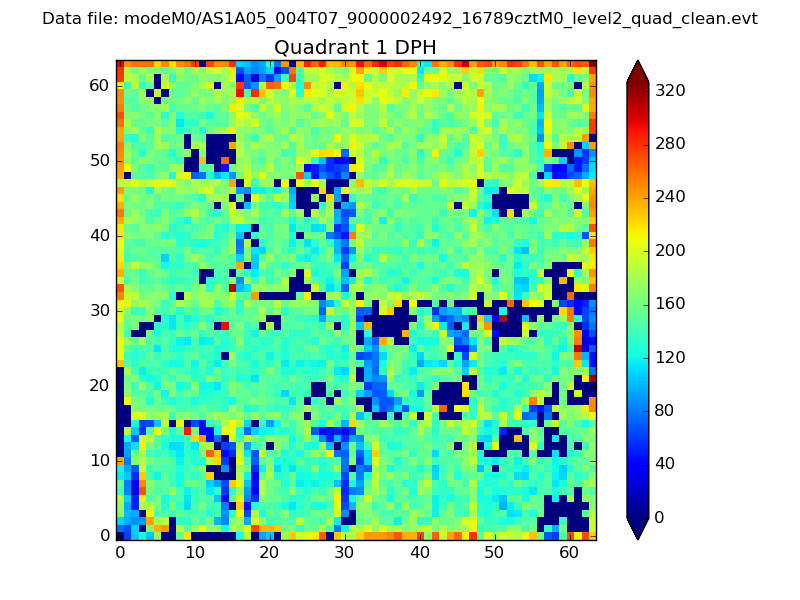 |
Quadrant B |
|---|---|---|---|
| Quadrant D | 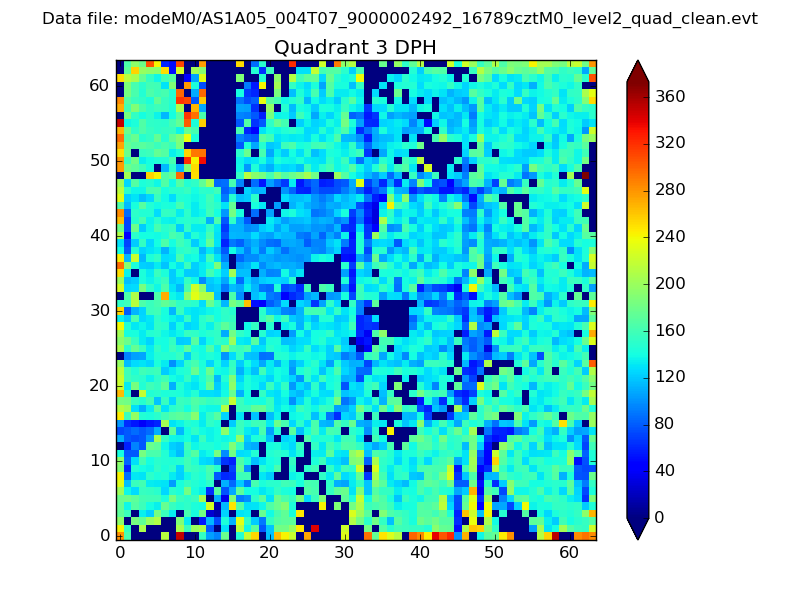 |
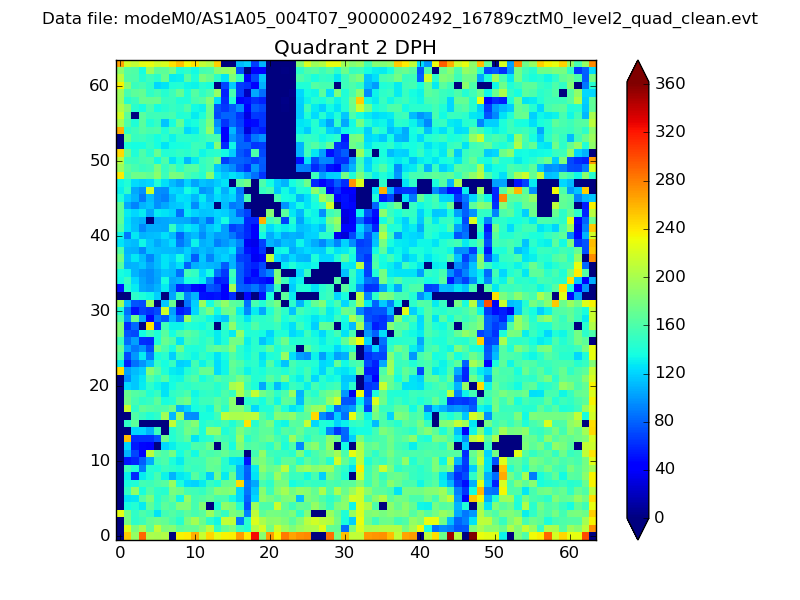 |
Quadrant C |
| Plot type | Count rate plots | Images |
|---|---|---|
| Comparison with Poisson distribution Blue bars denote a histogram of data divided into 1 sec bins. Red curve is a Poisson curve with rate = median count rate of data. |
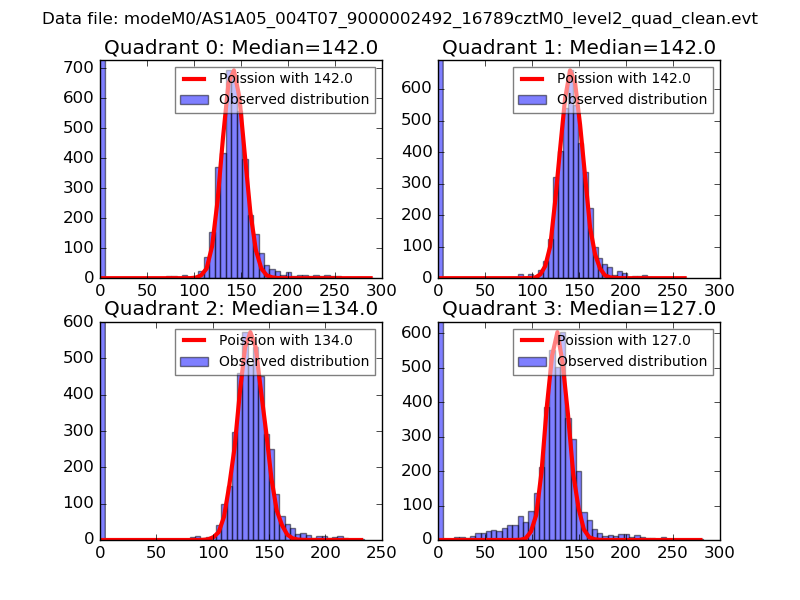 |
 |
| Quadrant-wise count rates Data is divided into 100 sec bins |
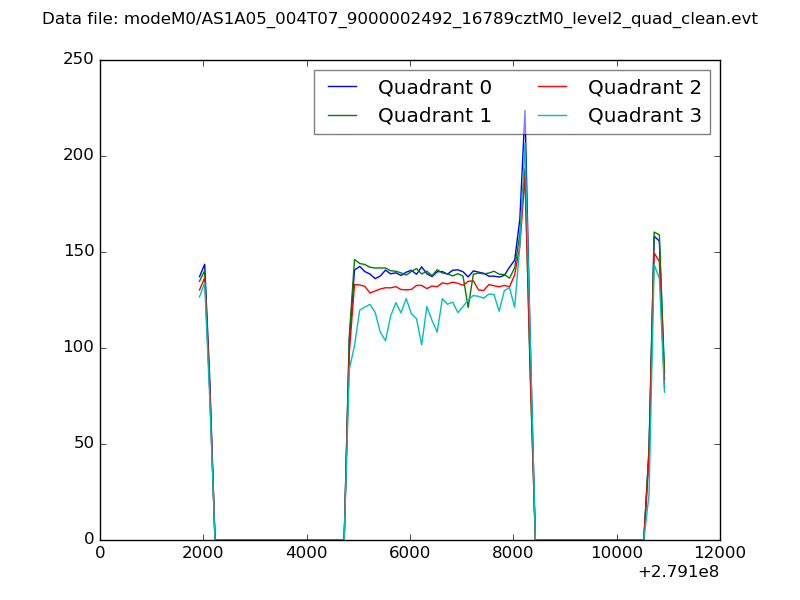 |
|
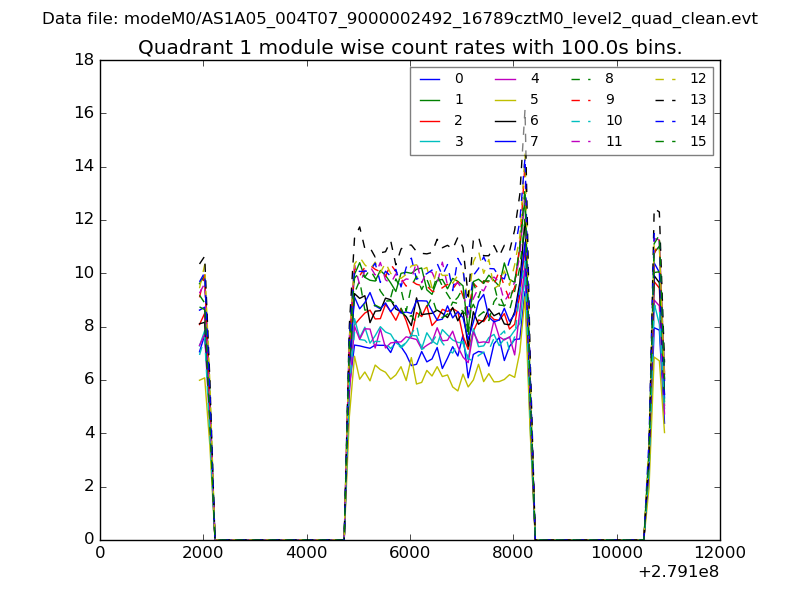
| Module-wise count rates for Quadrant A Data is divided into 100 sec bins |
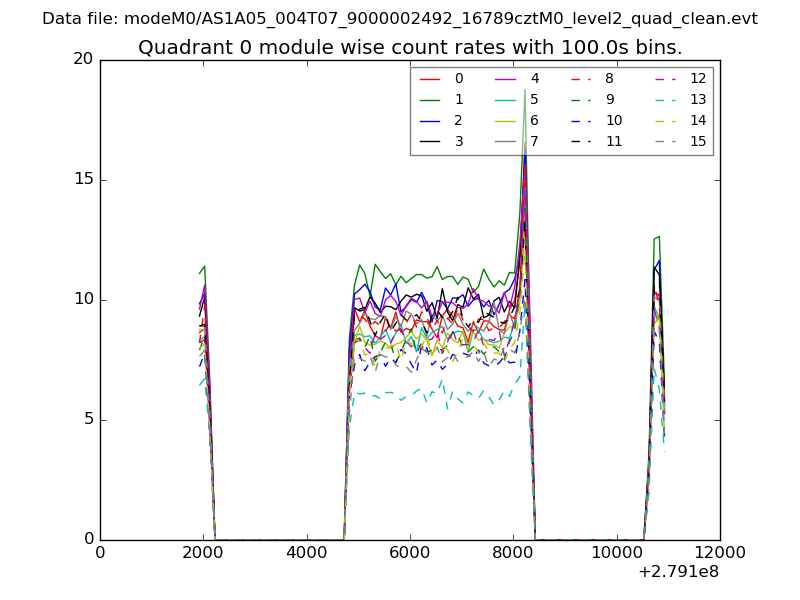 |
 |
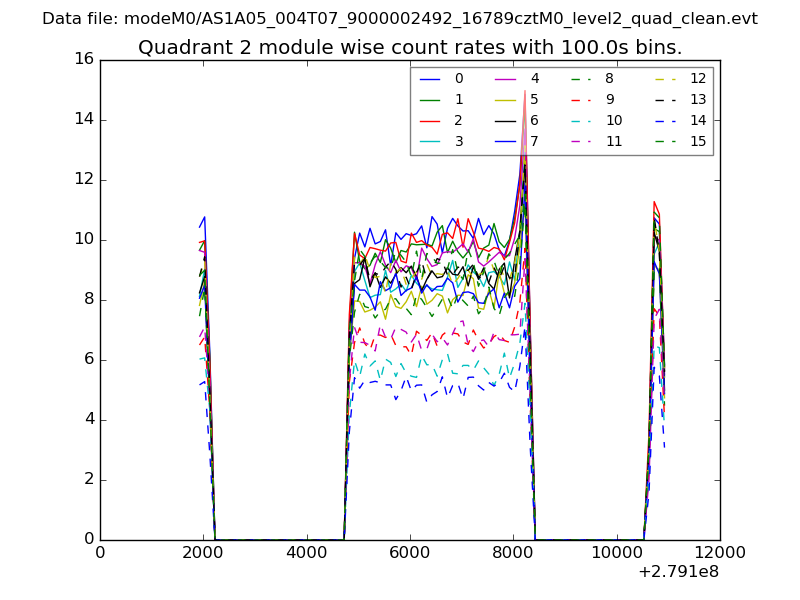
| Module-wise count rates for Quadrant B Data is divided into 100 sec bins |
 |
 |
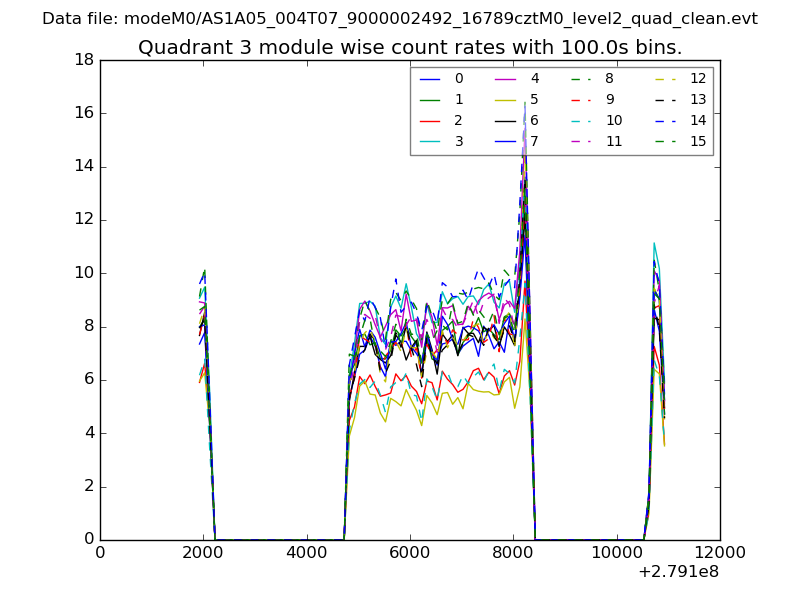
| Module-wise count rates for Quadrant C Data is divided into 100 sec bins |
 |
 |
| Module-wise count rates for Quadrant D Data is divided into 100 sec bins |
 |
 |
| Parameter | Plot |
|---|---|
| CZT HV Monitor | 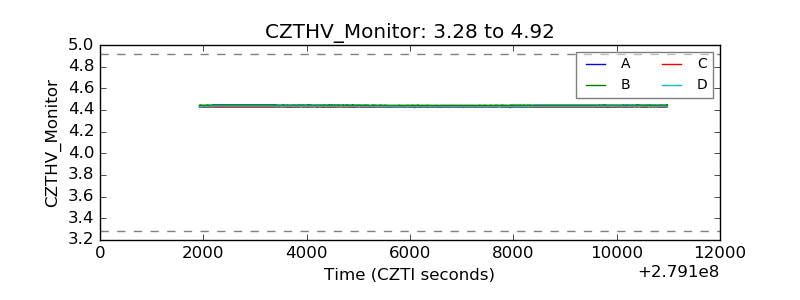 |
| D_VDD | 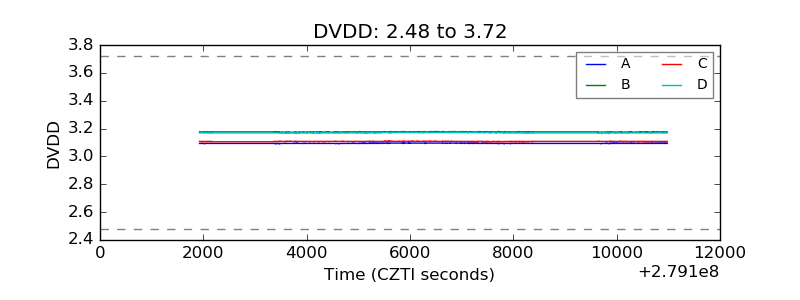 |
| Temperature 1 | 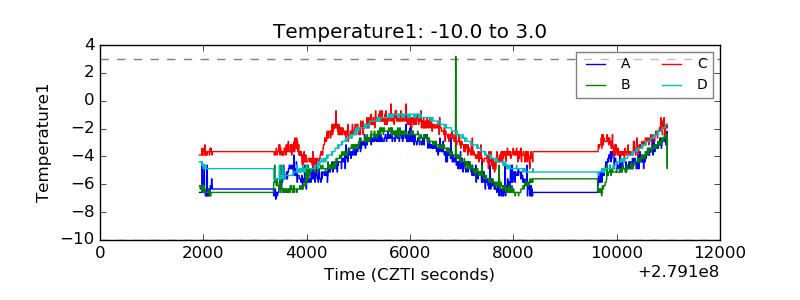 |
| Veto HV Monitor | 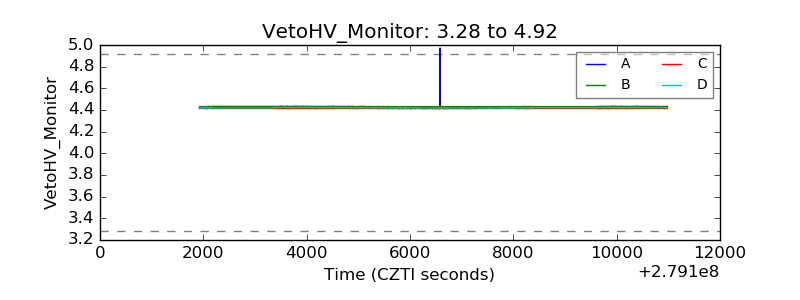 |
| Veto LLD | 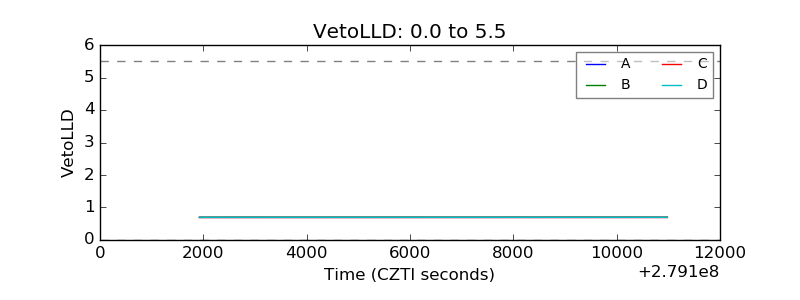 |
| Alpha Counter | 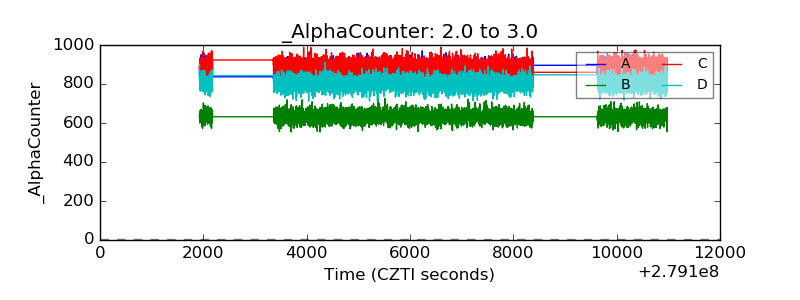 |
| _CPM_Rate | 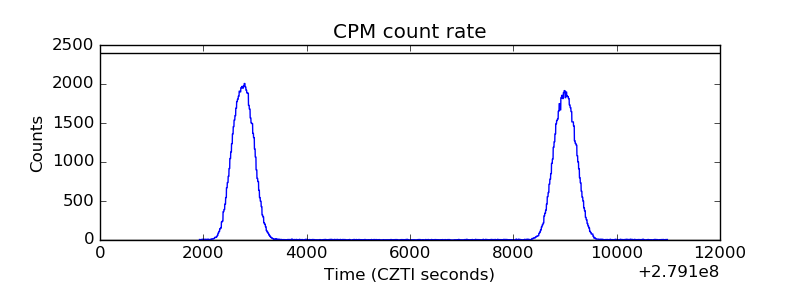 |
| CZT Counter | 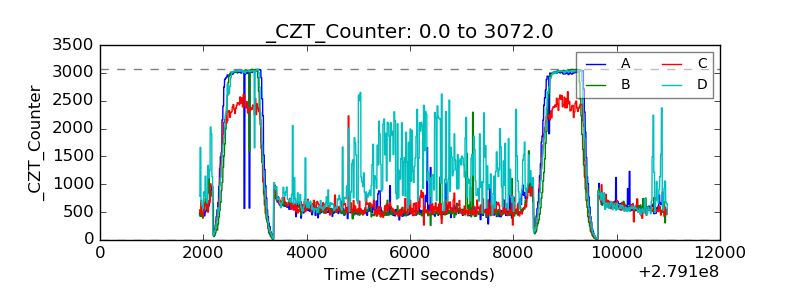 |
| +2.5 Volts monitor |  |
| +5 Volts monitor |  |
| _ROLL_ROT | 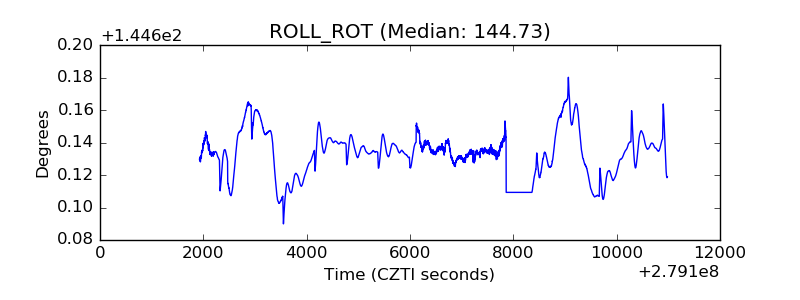 |
| _Roll_DEC | 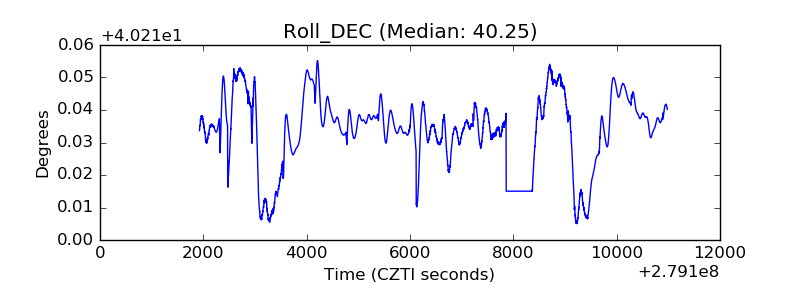 |
| _Roll_RA | 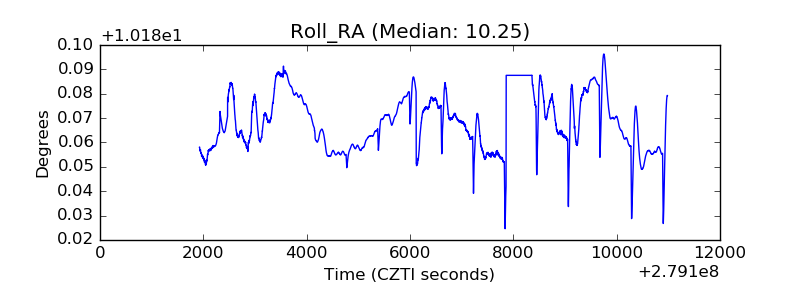 |
| Veto Counter | 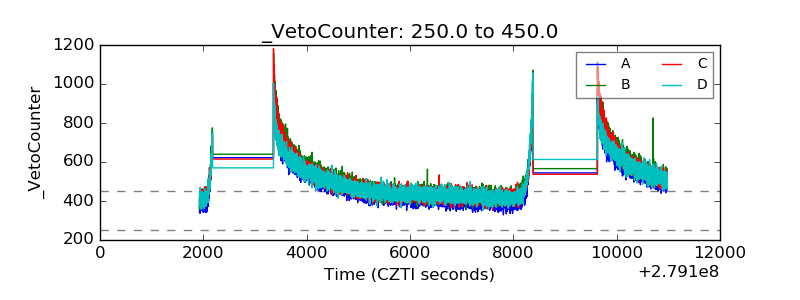 |