| Param | Original file | Final file |
|---|---|---|
| Filename | modeM0/AS1A05_004T07_9000002492_16791cztM0_level2.evt | modeM0/AS1A05_004T07_9000002492_16791cztM0_level2_quad_clean.evt |
| Size (bytes) | 692,173,440 | 106,102,080 |
| Size | 660.1 MB | 101.2 MB |
| Events in quadrant A | 6,534,035 | 687,844 |
| Events in quadrant B | 3,847,198 | 733,179 |
| Events in quadrant C | 4,268,966 | 692,392 |
| Events in quadrant D | 5,873,868 | 646,610 |
| Mode M9 | |||
|---|---|---|---|
| Quadrant | BADHDUFLAG | Total packets | Discarded packets |
| A | 0 | 13 | 0 |
| B | 0 | 13 | 0 |
| C | 0 | 13 | 0 |
| D | 0 | 13 | 0 |
| Mode SS | |||
|---|---|---|---|
| Quadrant | BADHDUFLAG | Total packets | Discarded packets |
| A | 0 | 130 | 0 |
| B | 0 | 130 | 0 |
| C | 0 | 130 | 0 |
| D | 0 | 130 | 0 |
| Mode M0 | |||
|---|---|---|---|
| Quadrant | BADHDUFLAG | Total packets | Discarded packets |
| A | 0 | 23913 | 2 |
| B | 0 | 15495 | 1 |
| C | 0 | 16930 | 1 |
| D | 0 | 21719 | 1 |
| Quadrant | Total seconds | Saturated seconds | Saturation percentage |
|---|---|---|---|
| A | 6495 | 925 | 14.241724% |
| B | 6495 | 155 | 2.386451% |
| C | 6495 | 219 | 3.371824% |
| D | 6495 | 884 | 13.610470% |
Noise dominated data is calculated using 1-second bins in cleaned event files. If a bin has >2000 counts, and if more than 50% of those come from <1% of pixels, then it is considered to be noise-dominated and hence unusable.
| Quadrant | # 1 sec bins | Bins with >0 counts | Bins with >2000 counts | High rate bins dominated by noise | Noise dominated (total time) | Noise dominated (detector-on time) | Marked lightcurve |
|---|---|---|---|---|---|---|---|
| A | 7766 | 6497 | 723 | 723 | 9.31% | 11.13% | 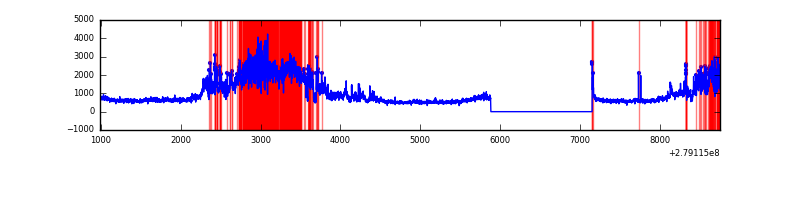 |
| B | 7766 | 6497 | 14 | 14 | 0.18% | 0.22% | 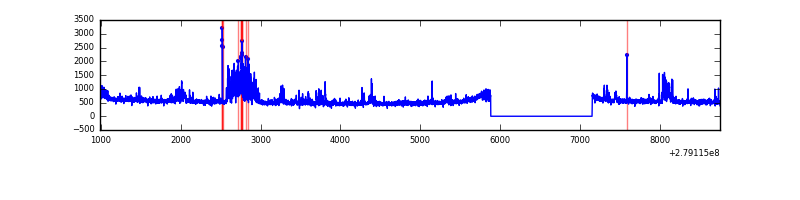 |
| C | 7766 | 6497 | 11 | 11 | 0.14% | 0.17% | 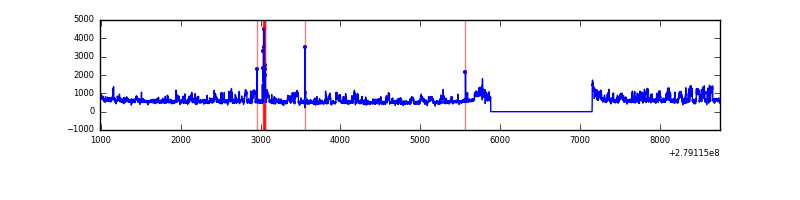 |
| D | 7765 | 6496 | 627 | 627 | 8.07% | 9.65% | 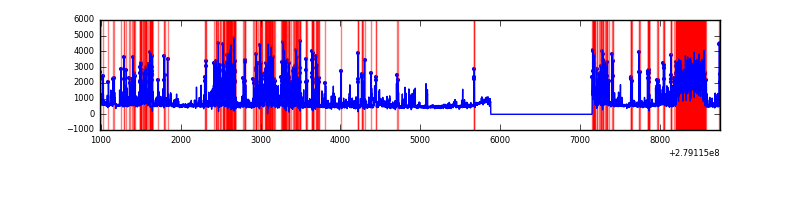 |
Top three noisy pixels from each quadrant. If the there are fewer than three noisy pixels in the level2.evt file, extra rows are filled as -1
| Pixel properties | Quadrant properties | ||||||
|---|---|---|---|---|---|---|---|
| Quadrant | DetID | PixID | Counts | Sigma | Mean | Median | Sigma |
| A | 10 | 234 | 2920479 | 17366.04 | 844 | 829 | 168.1 |
| A | 15 | 174 | 335739 | 1992.04 | 844 | 829 | 168.1 |
| A | 9 | 143 | 37276 | 216.79 | 844 | 829 | 168.1 |
| B | 15 | 35 | 349926 | 2185.59 | 853 | 835 | 159.7 |
| B | 0 | 229 | 71454 | 442.13 | 853 | 835 | 159.7 |
| B | 3 | 209 | 26786 | 162.47 | 853 | 835 | 159.7 |
| C | 3 | 233 | 838443 | 4487.05 | 813 | 817 | 186.7 |
| C | 14 | 238 | 127236 | 677.21 | 813 | 817 | 186.7 |
| C | 0 | 207 | 101730 | 540.57 | 813 | 817 | 186.7 |
| D | 1 | 52 | 2373799 | 12198.08 | 804 | 781 | 194.5 |
| D | 10 | 70 | 188445 | 964.65 | 804 | 781 | 194.5 |
| D | 12 | 218 | 184025 | 941.93 | 804 | 781 | 194.5 |
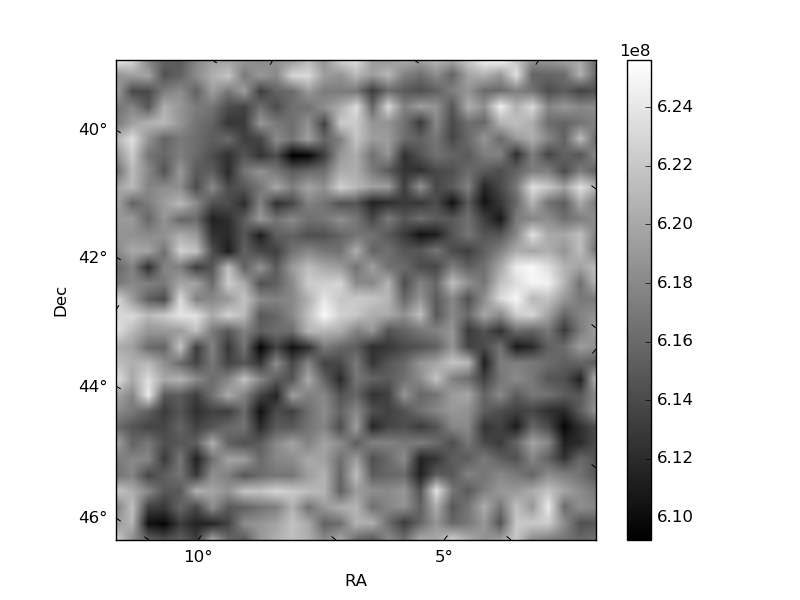
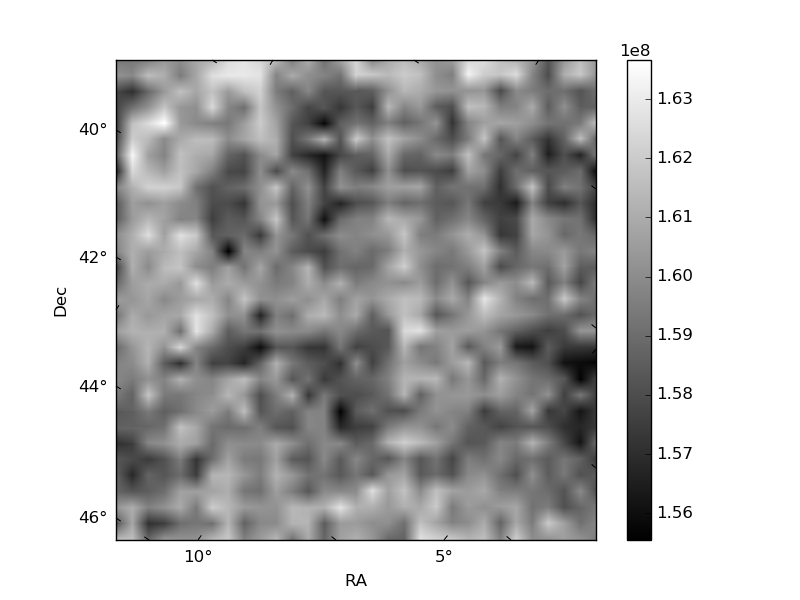
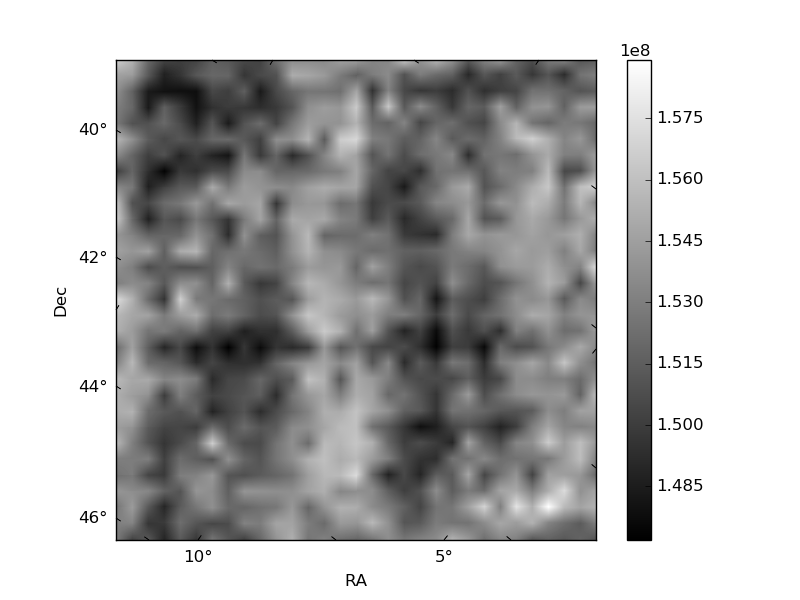
Histogram calculated using DETX and DETY for each event in the final _common_clean file
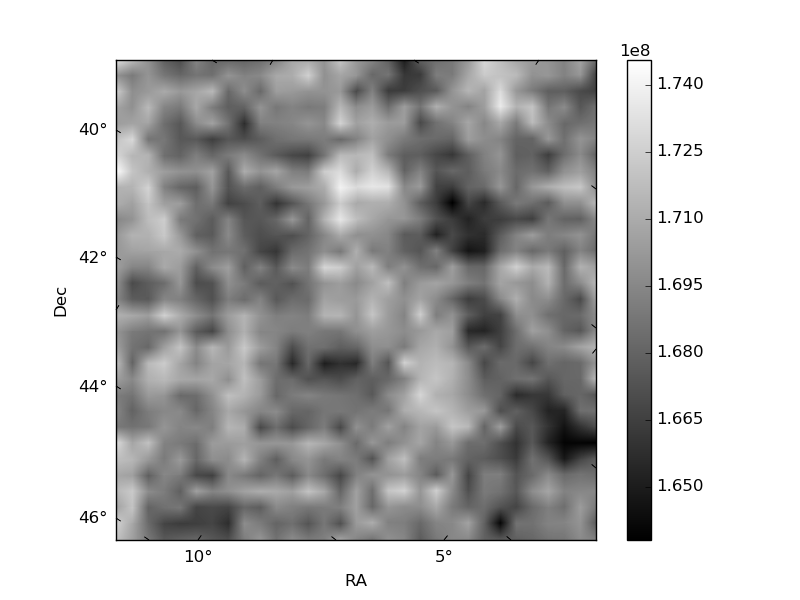
| Quadrant A | 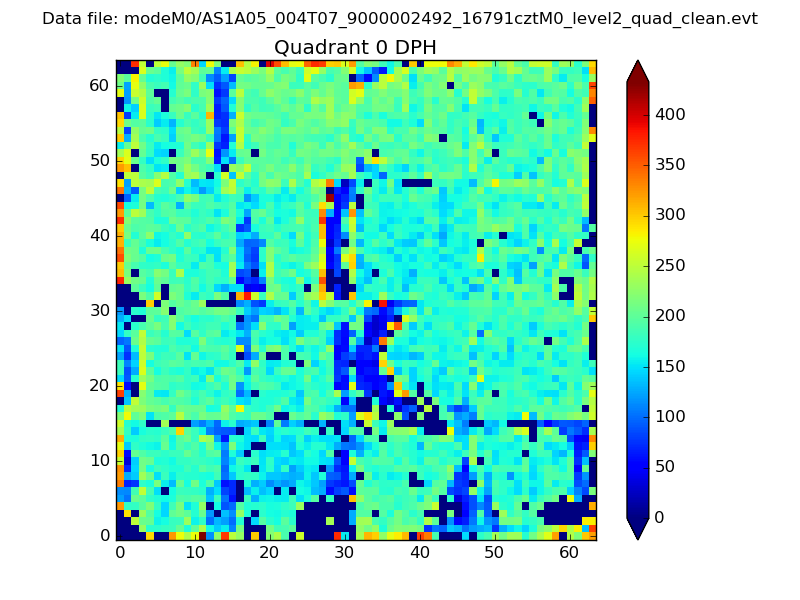 |
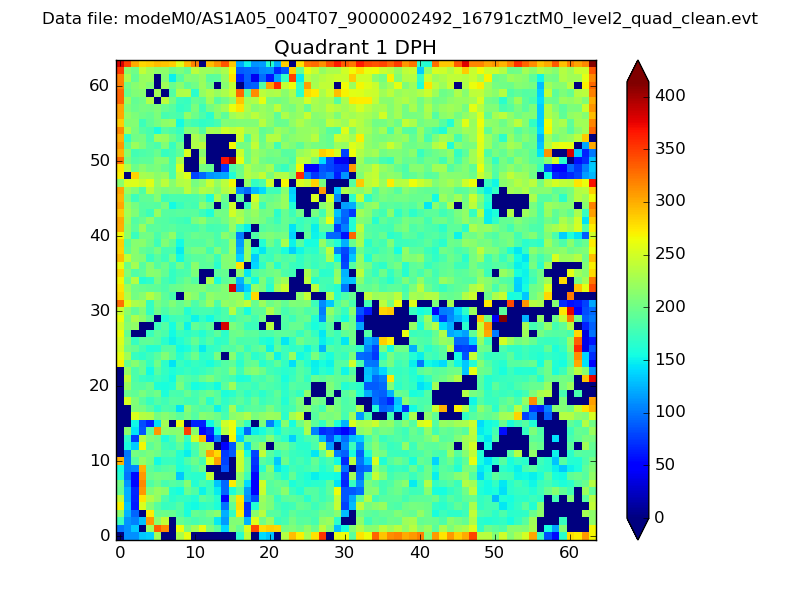 |
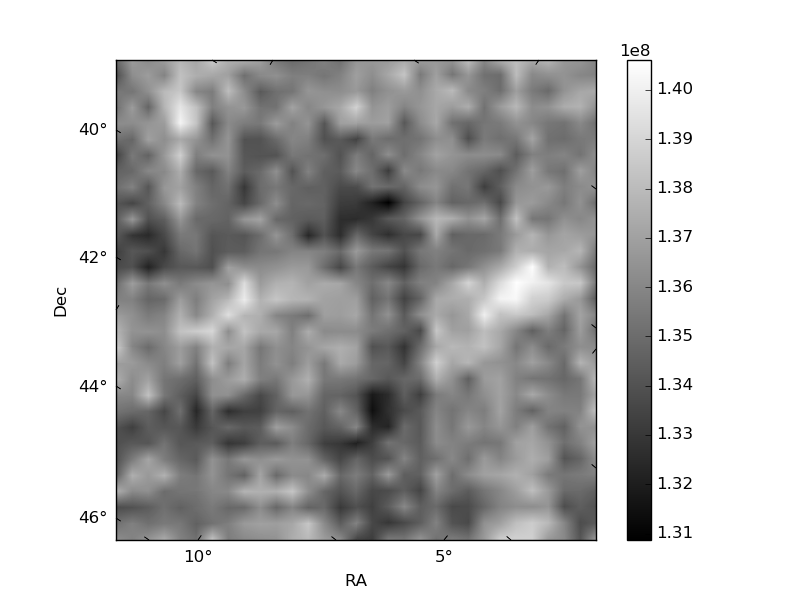
Quadrant B |
|---|---|---|---|
| Quadrant D | 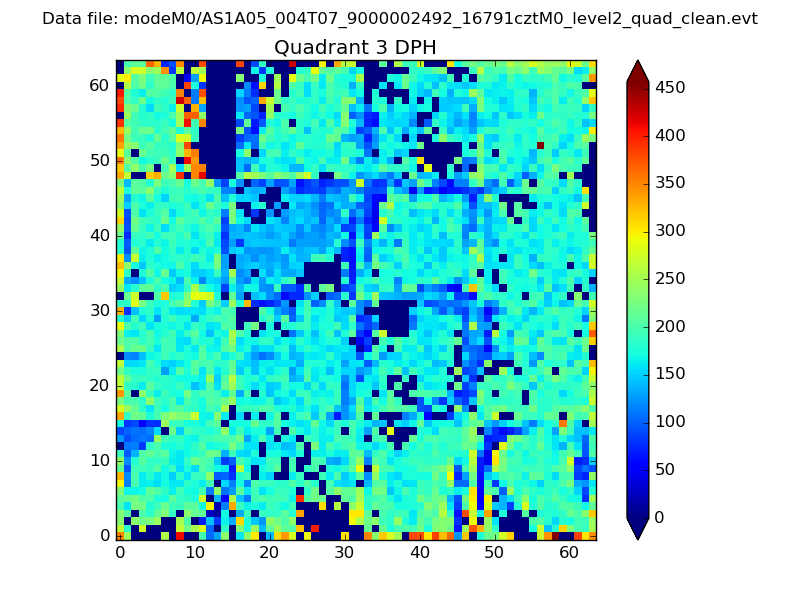 |
 |
Quadrant C |
| Plot type | Count rate plots | Images |
|---|---|---|
| Comparison with Poisson distribution Blue bars denote a histogram of data divided into 1 sec bins. Red curve is a Poisson curve with rate = median count rate of data. |
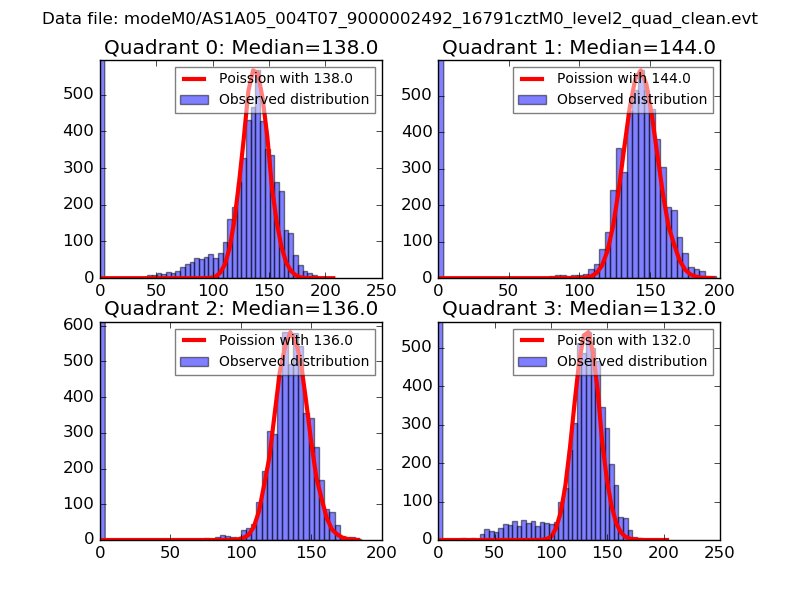 |
 |
| Quadrant-wise count rates Data is divided into 100 sec bins |
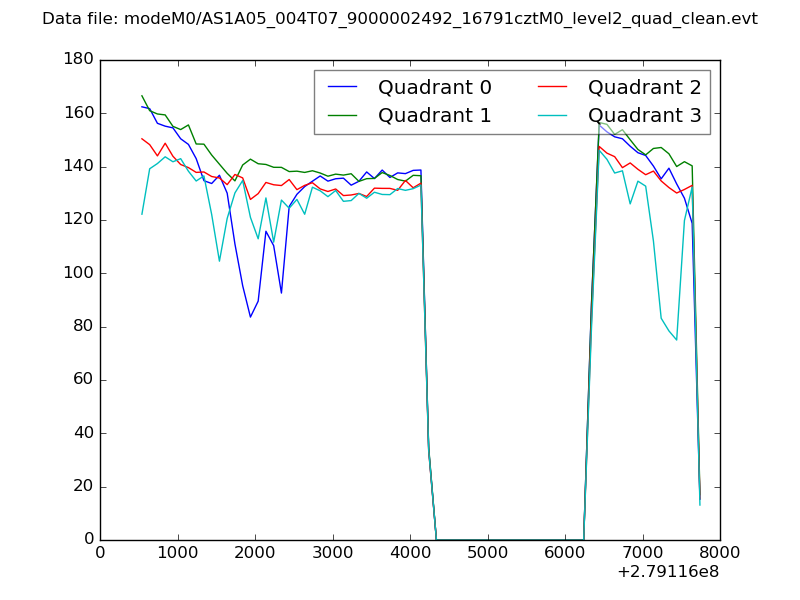 |
|
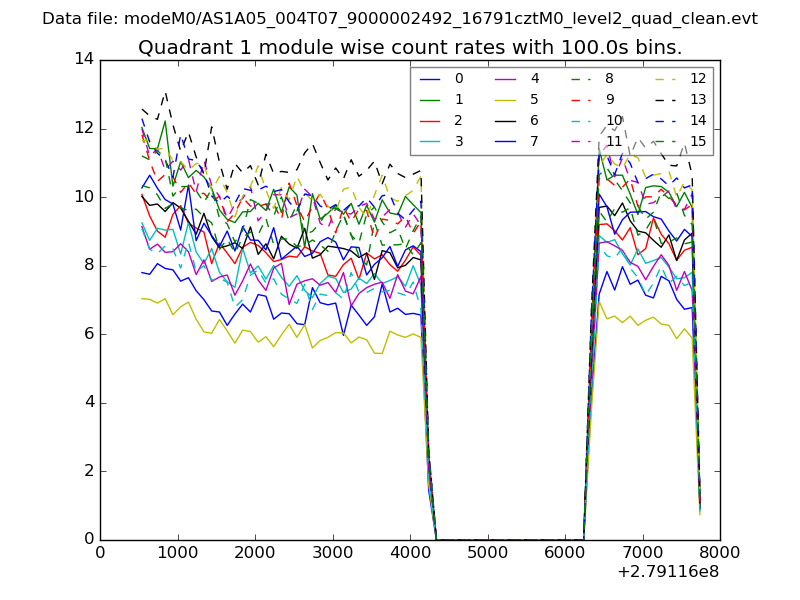
| Module-wise count rates for Quadrant A Data is divided into 100 sec bins |
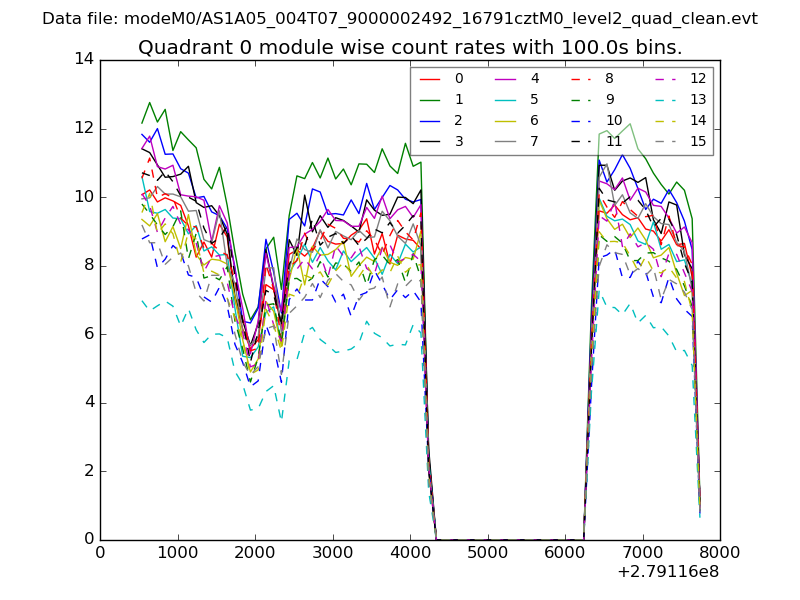 |
 |
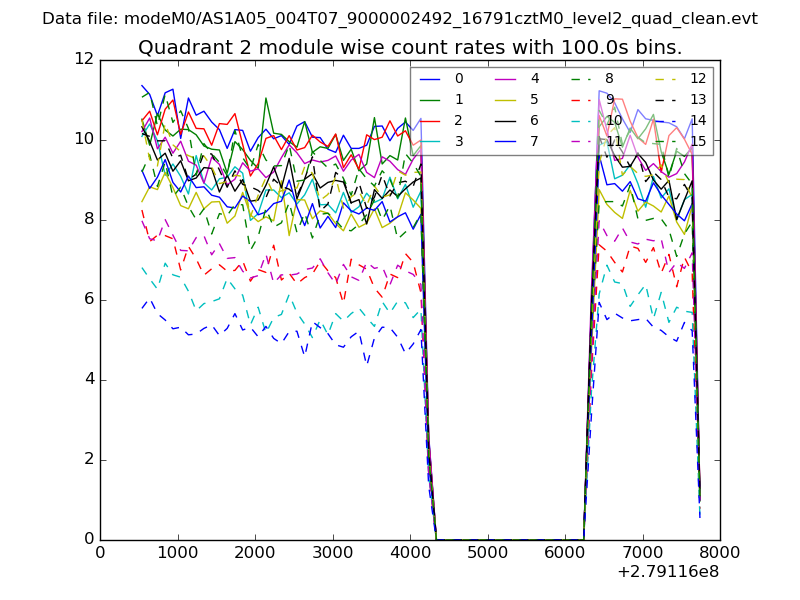
| Module-wise count rates for Quadrant B Data is divided into 100 sec bins |
 |
 |
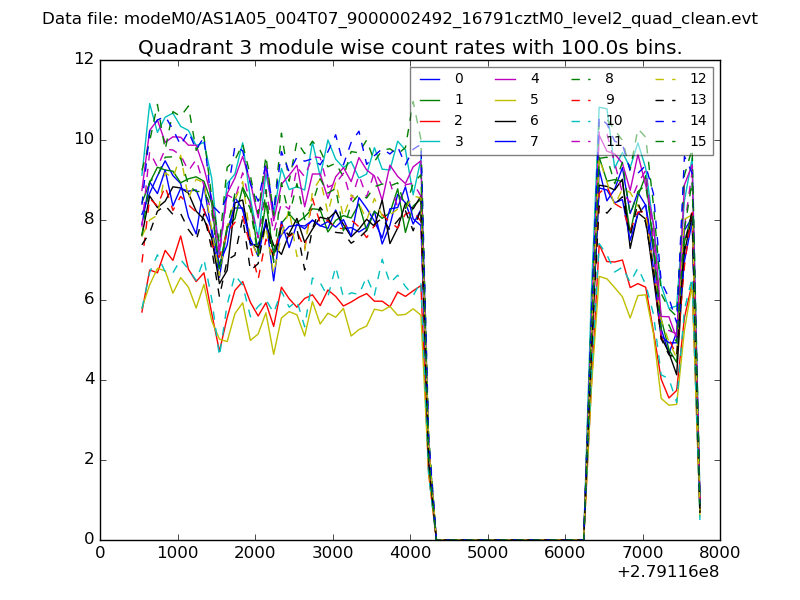
| Module-wise count rates for Quadrant C Data is divided into 100 sec bins |
 |
 |
| Module-wise count rates for Quadrant D Data is divided into 100 sec bins |
 |
 |
| Parameter | Plot |
|---|---|
| CZT HV Monitor | 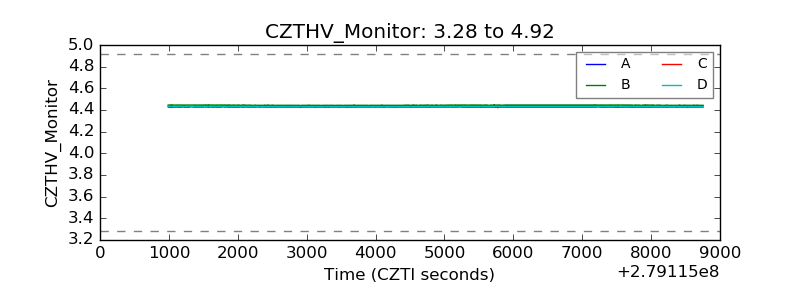 |
| D_VDD | 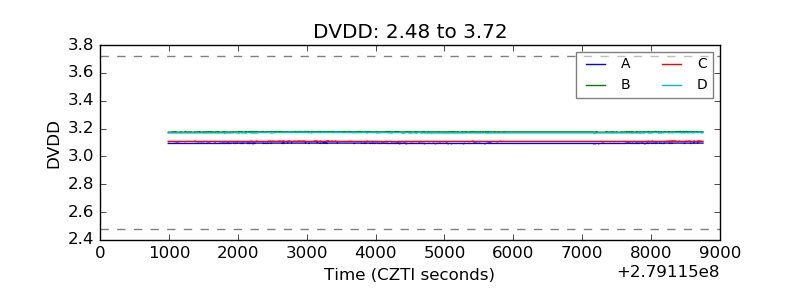 |
| Temperature 1 | 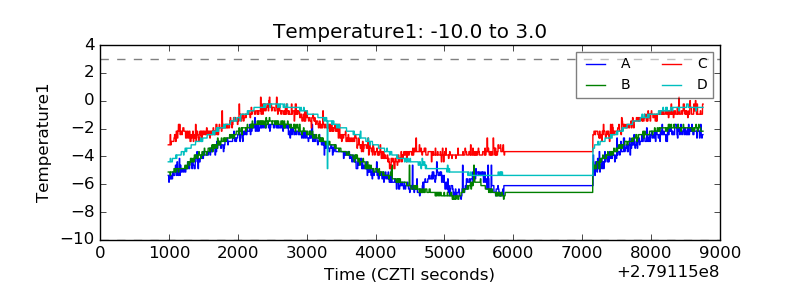 |
| Veto HV Monitor | 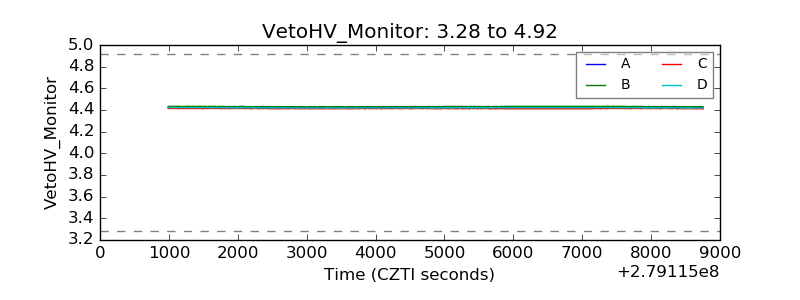 |
| Veto LLD | 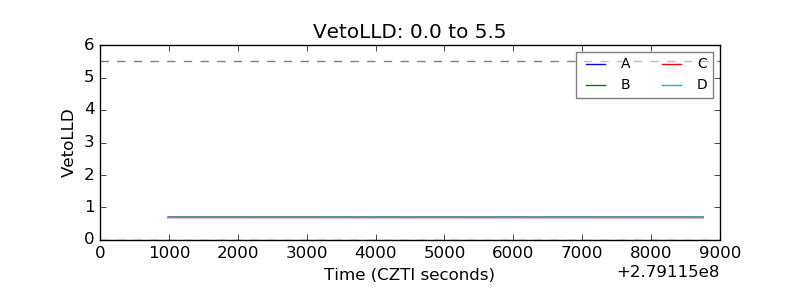 |
| Alpha Counter | 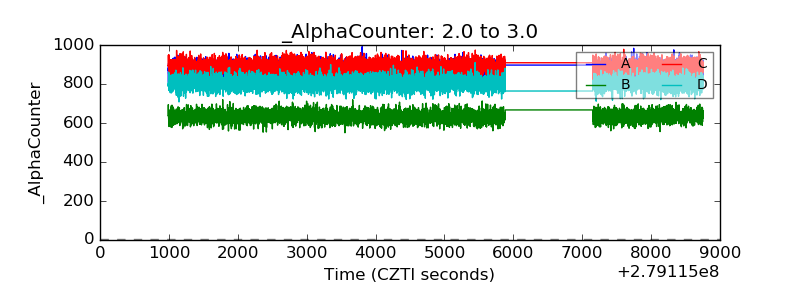 |
| _CPM_Rate | 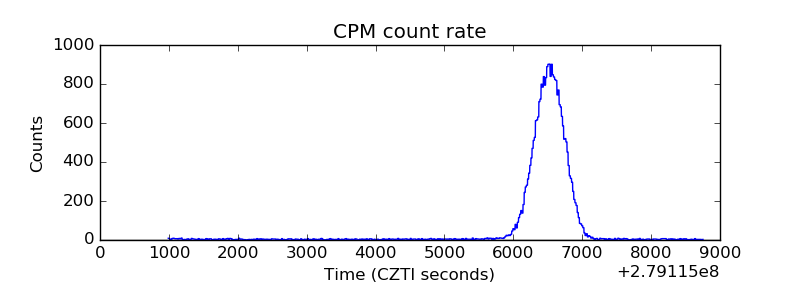 |
| CZT Counter |  |
| +2.5 Volts monitor |  |
| +5 Volts monitor |  |
| _ROLL_ROT | 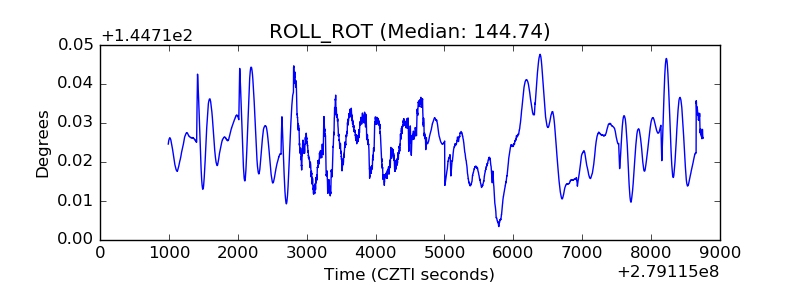 |
| _Roll_DEC | 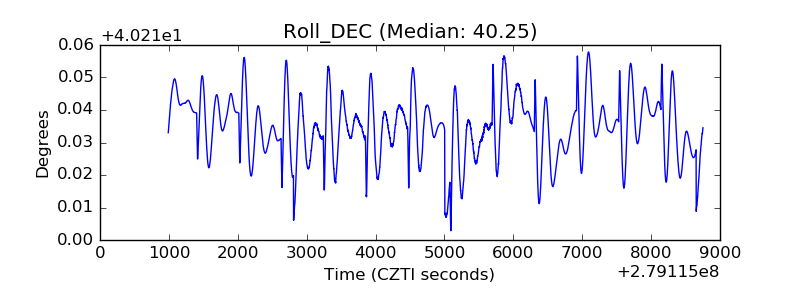 |
| _Roll_RA | 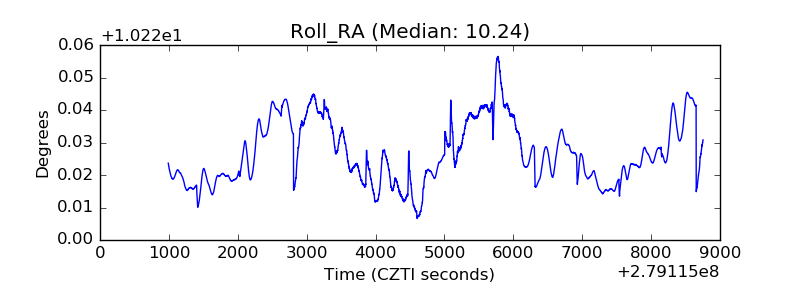 |
| Veto Counter | 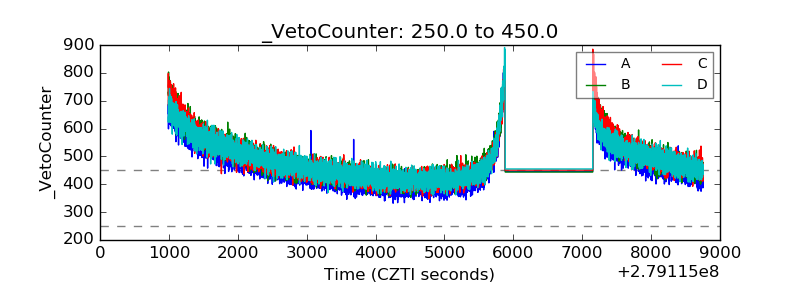 |