| Param | Original file | Final file |
|---|---|---|
| Filename | modeM0/AS1A05_004T07_9000002492_16793cztM0_level2.evt | modeM0/AS1A05_004T07_9000002492_16793cztM0_level2_quad_clean.evt |
| Size (bytes) | 553,026,240 | 96,171,840 |
| Size | 527.4 MB | 91.7 MB |
| Events in quadrant A | 3,982,358 | 617,752 |
| Events in quadrant B | 3,513,756 | 629,676 |
| Events in quadrant C | 4,336,546 | 607,305 |
| Events in quadrant D | 4,461,422 | 590,347 |
| Mode M9 | |||
|---|---|---|---|
| Quadrant | BADHDUFLAG | Total packets | Discarded packets |
| A | 0 | 8 | 0 |
| B | 0 | 8 | 0 |
| C | 0 | 8 | 0 |
| D | 0 | 8 | 0 |
| Mode SS | |||
|---|---|---|---|
| Quadrant | BADHDUFLAG | Total packets | Discarded packets |
| A | 0 | 136 | 0 |
| B | 0 | 136 | 0 |
| C | 0 | 136 | 0 |
| D | 0 | 136 | 0 |
| Mode M0 | |||
|---|---|---|---|
| Quadrant | BADHDUFLAG | Total packets | Discarded packets |
| A | 0 | 16176 | 2 |
| B | 0 | 14677 | 1 |
| C | 0 | 17187 | 1 |
| D | 0 | 17705 | 1 |
| Quadrant | Total seconds | Saturated seconds | Saturation percentage |
|---|---|---|---|
| A | 6710 | 285 | 4.247392% |
| B | 6710 | 120 | 1.788376% |
| C | 6710 | 135 | 2.011923% |
| D | 6710 | 269 | 4.008942% |
Noise dominated data is calculated using 1-second bins in cleaned event files. If a bin has >2000 counts, and if more than 50% of those come from <1% of pixels, then it is considered to be noise-dominated and hence unusable.
| Quadrant | # 1 sec bins | Bins with >0 counts | Bins with >2000 counts | High rate bins dominated by noise | Noise dominated (total time) | Noise dominated (detector-on time) | Marked lightcurve |
|---|---|---|---|---|---|---|---|
| A | 7471 | 6713 | 169 | 169 | 2.26% | 2.52% |  |
| B | 7471 | 6713 | 31 | 31 | 0.41% | 0.46% |  |
| C | 7471 | 6713 | 2 | 2 | 0.03% | 0.03% | 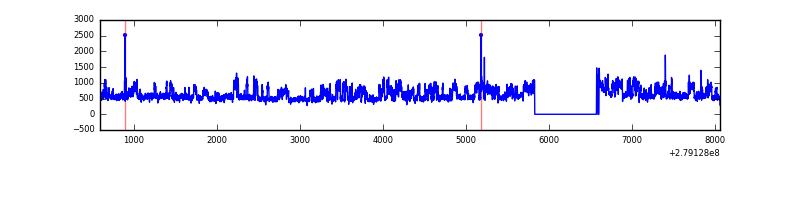 |
| D | 7471 | 6713 | 174 | 174 | 2.33% | 2.59% | 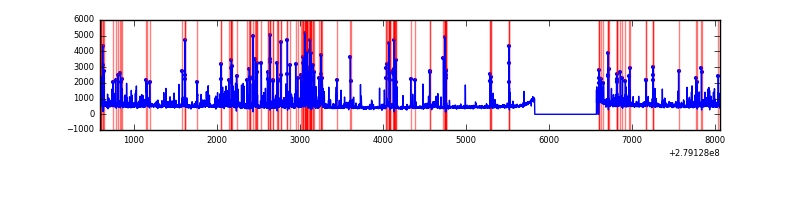 |
Top three noisy pixels from each quadrant. If the there are fewer than three noisy pixels in the level2.evt file, extra rows are filled as -1
| Pixel properties | Quadrant properties | ||||||
|---|---|---|---|---|---|---|---|
| Quadrant | DetID | PixID | Counts | Sigma | Mean | Median | Sigma |
| A | 15 | 174 | 706694 | 4300.75 | 813 | 794 | 164.1 |
| A | 15 | 190 | 81942 | 494.4 | 813 | 794 | 164.1 |
| A | 15 | 158 | 38529 | 229.9 | 813 | 794 | 164.1 |
| B | 0 | 229 | 205089 | 1301.86 | 816 | 794 | 156.9 |
| B | 0 | 189 | 50134 | 314.41 | 816 | 794 | 156.9 |
| B | 15 | 35 | 44515 | 278.61 | 816 | 794 | 156.9 |
| C | 3 | 233 | 1077048 | 5858.25 | 789 | 793 | 183.7 |
| C | 14 | 238 | 120331 | 650.67 | 789 | 793 | 183.7 |
| C | 0 | 207 | 31873 | 169.17 | 789 | 793 | 183.7 |
| D | 1 | 52 | 1134891 | 5837.08 | 796 | 773 | 194.3 |
| D | 12 | 218 | 150999 | 773.18 | 796 | 773 | 194.3 |
| D | 13 | 248 | 73985 | 376.81 | 796 | 773 | 194.3 |
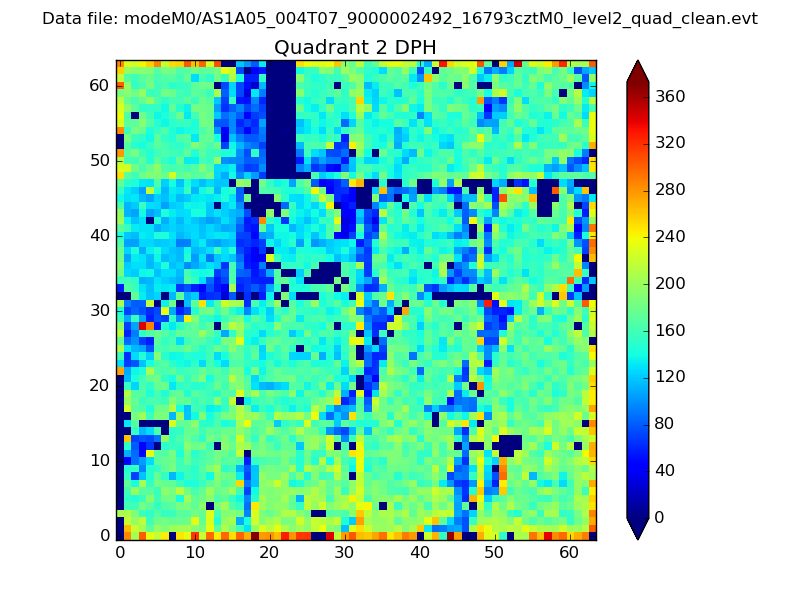
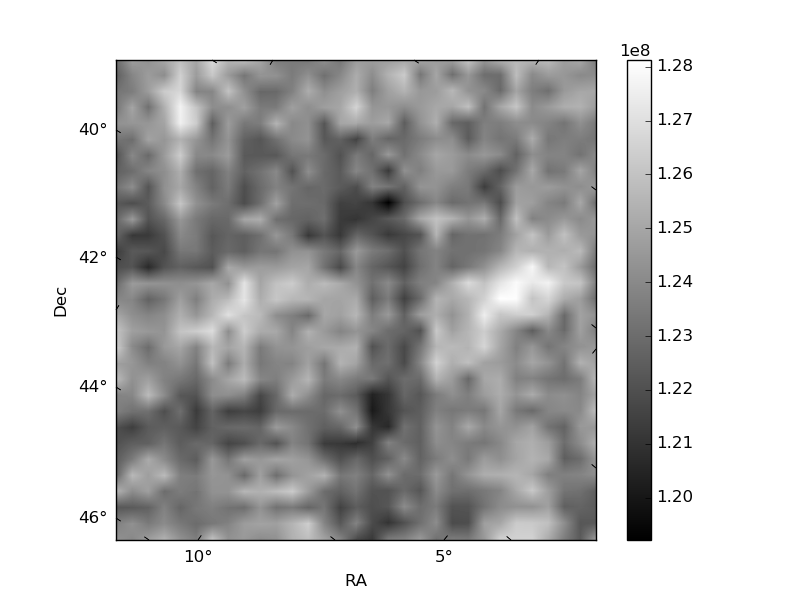
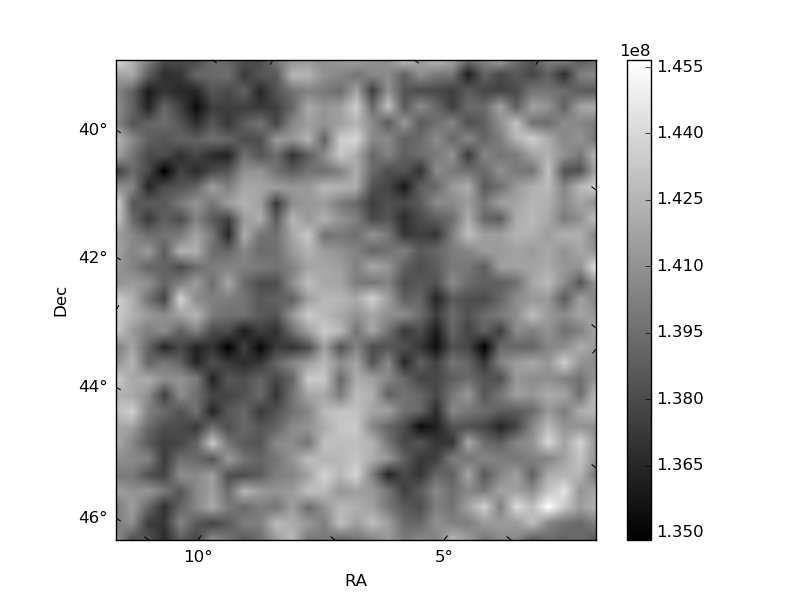
Histogram calculated using DETX and DETY for each event in the final _common_clean file
| Quadrant A | 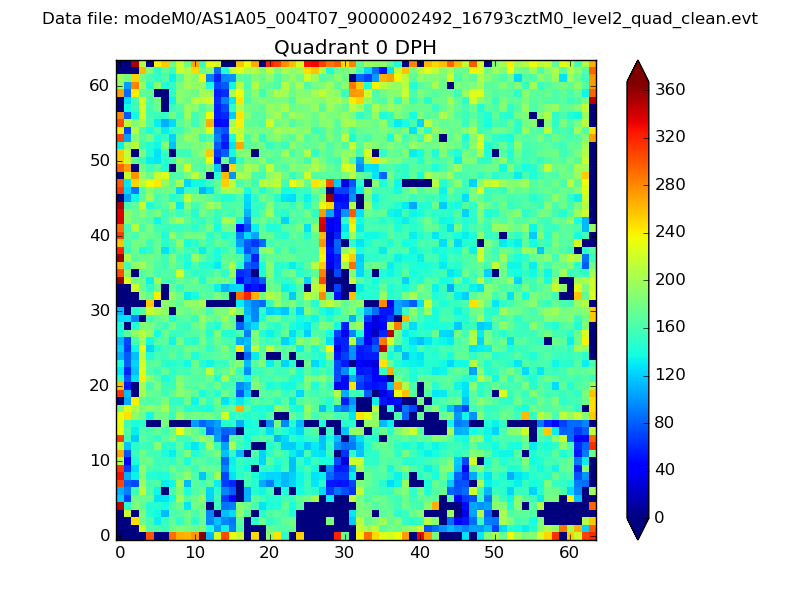 |
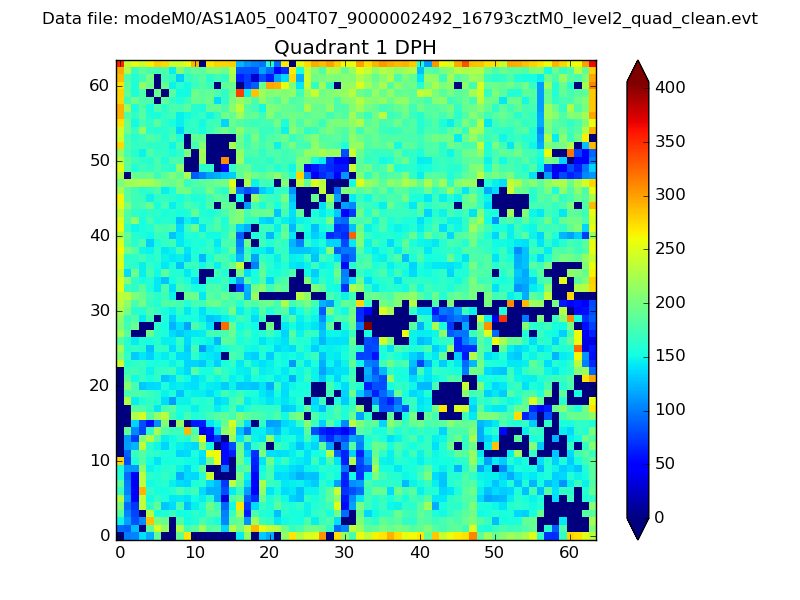 |
Quadrant B |
|---|---|---|---|
| Quadrant D | 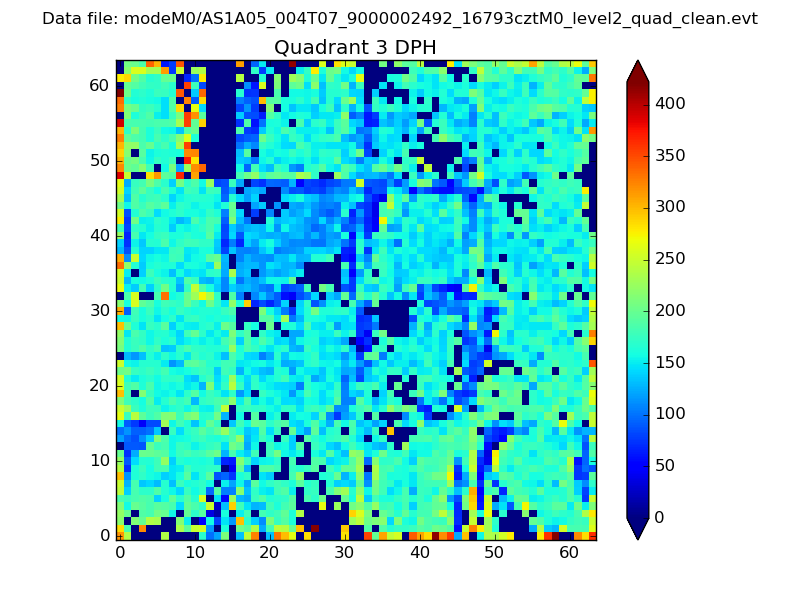 |
 |
Quadrant C |
| Plot type | Count rate plots | Images |
|---|---|---|
| Comparison with Poisson distribution Blue bars denote a histogram of data divided into 1 sec bins. Red curve is a Poisson curve with rate = median count rate of data. |
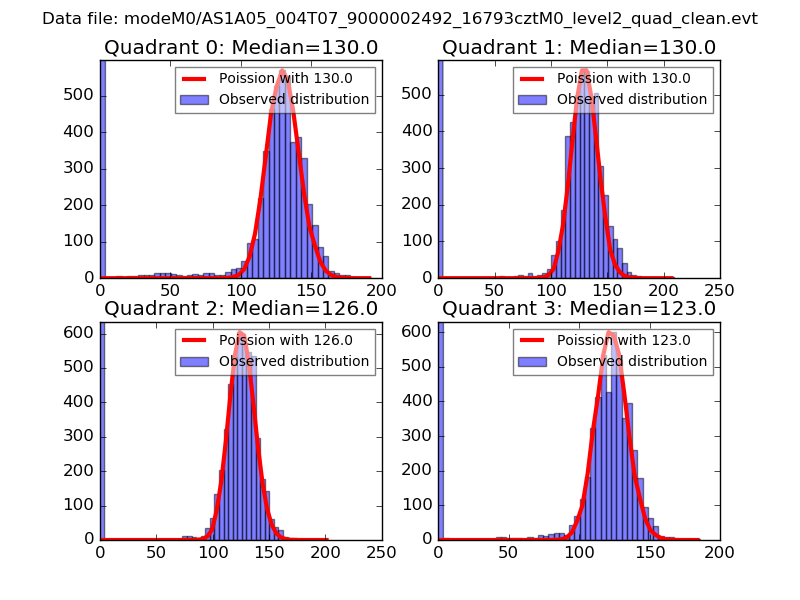 |
 |
| Quadrant-wise count rates Data is divided into 100 sec bins |
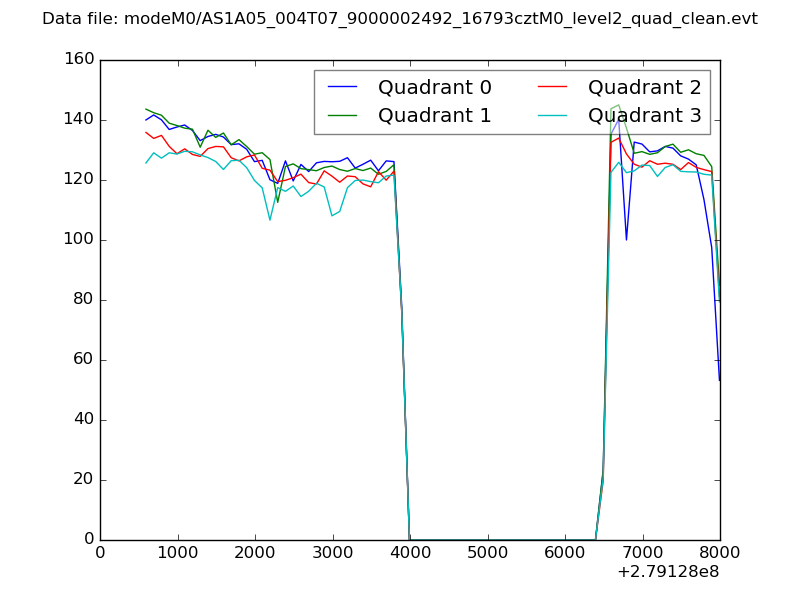 |
|
| Module-wise count rates for Quadrant A Data is divided into 100 sec bins |
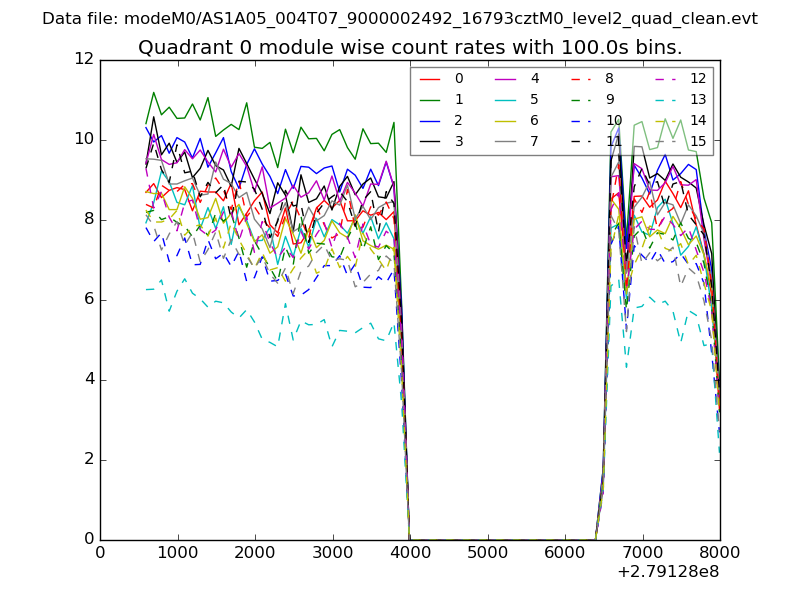 |
 |
| Module-wise count rates for Quadrant B Data is divided into 100 sec bins |
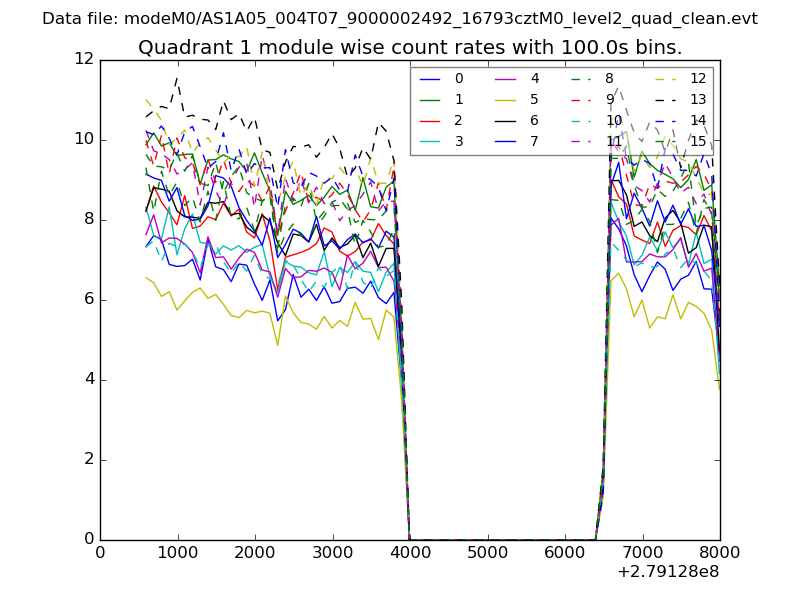 |
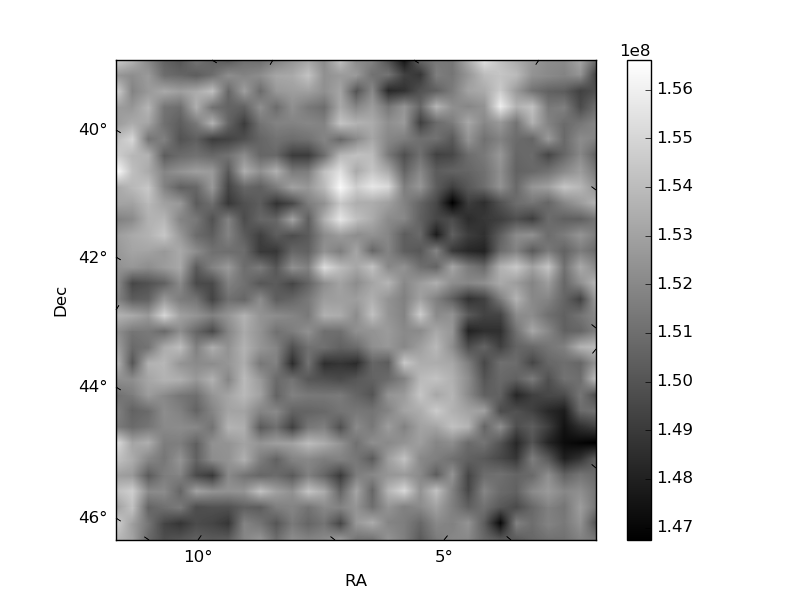 |
| Module-wise count rates for Quadrant C Data is divided into 100 sec bins |
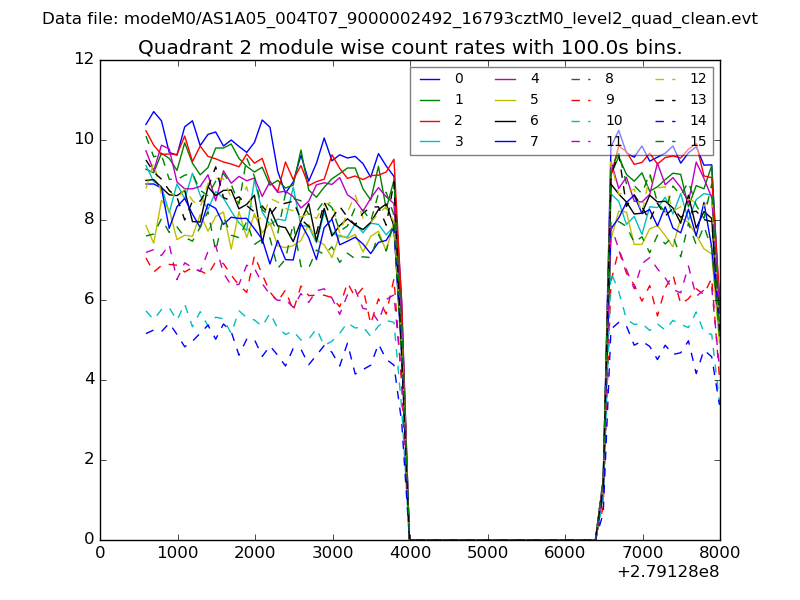 |
 |
| Module-wise count rates for Quadrant D Data is divided into 100 sec bins |
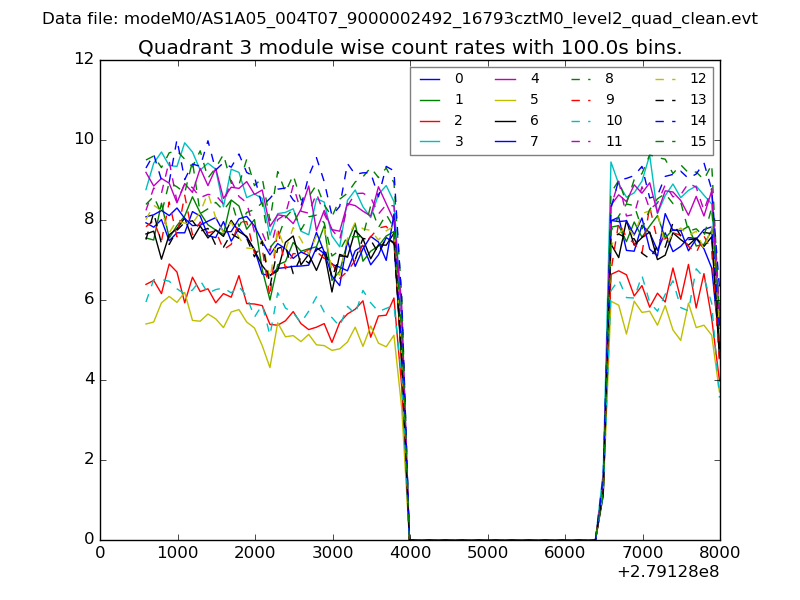 |
 |
| Parameter | Plot |
|---|---|
| CZT HV Monitor | 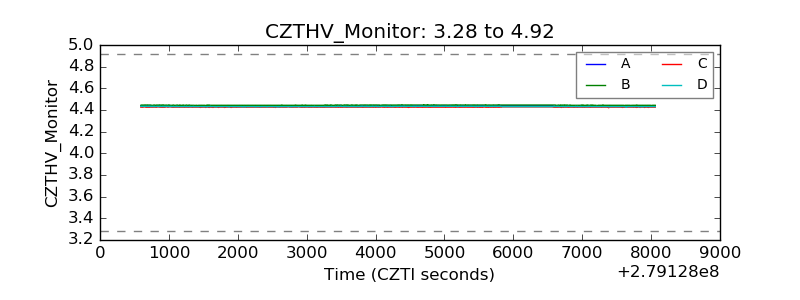 |
| D_VDD | 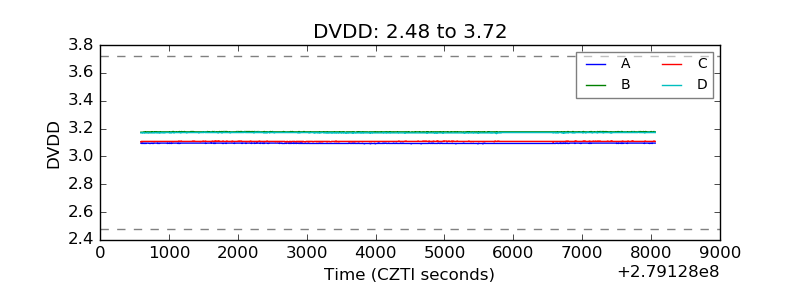 |
| Temperature 1 | 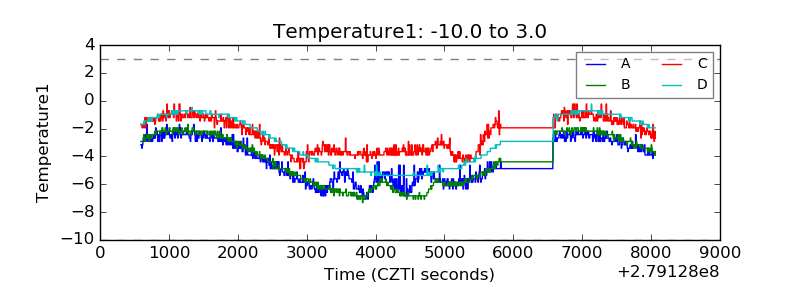 |
| Veto HV Monitor | 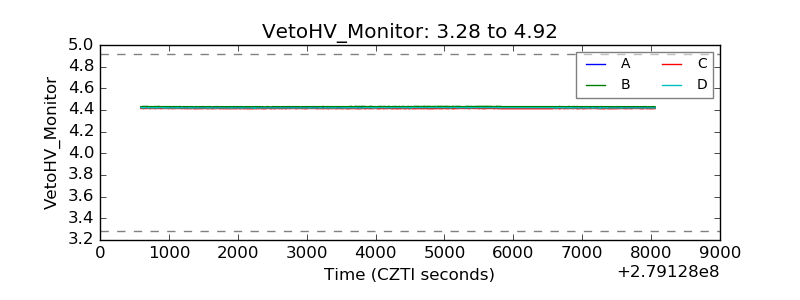 |
| Veto LLD | 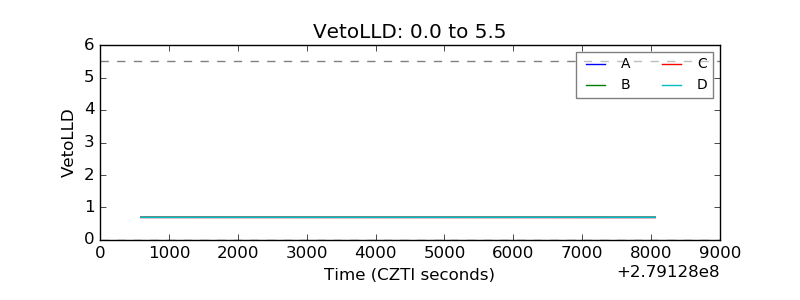 |
| Alpha Counter | 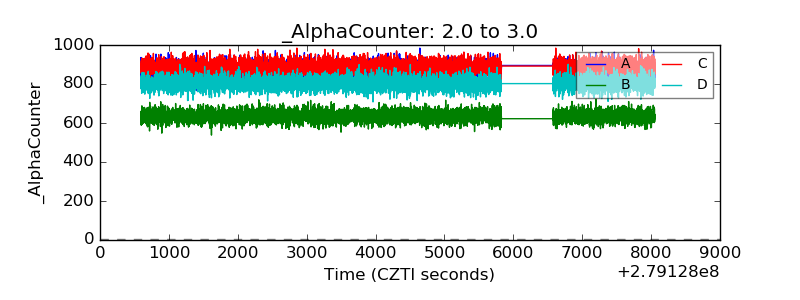 |
| _CPM_Rate | 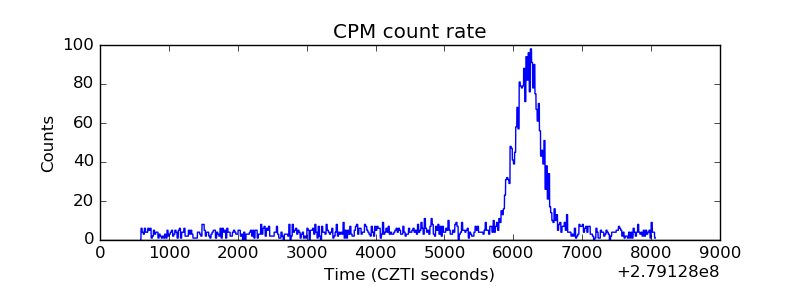 |
| CZT Counter | 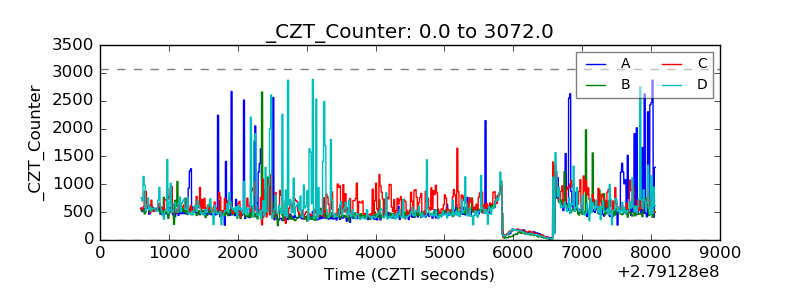 |
| +2.5 Volts monitor |  |
| +5 Volts monitor |  |
| _ROLL_ROT | 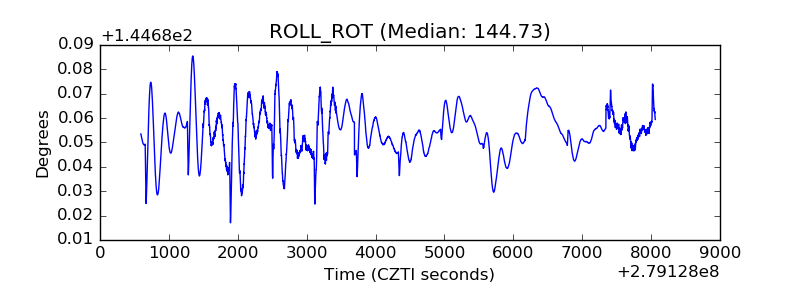 |
| _Roll_DEC | 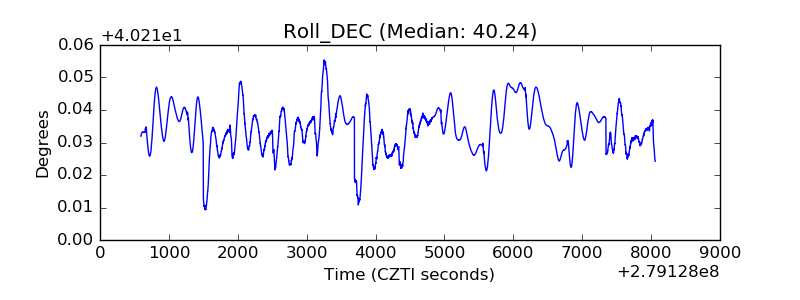 |
| _Roll_RA | 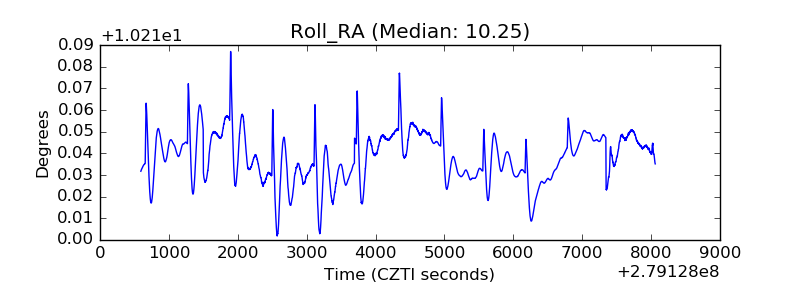 |
| Veto Counter | 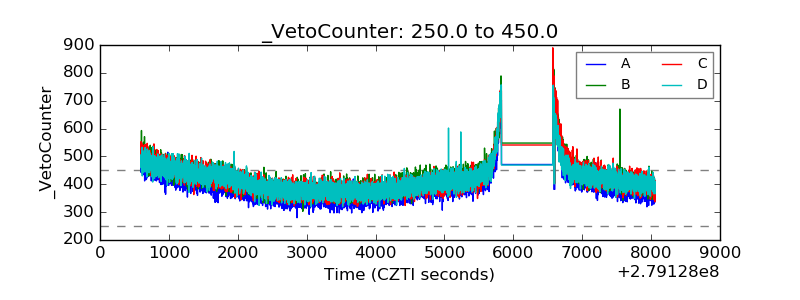 |