| Param | Original file | Final file |
|---|---|---|
| Filename | modeM0/AS1A05_004T07_9000002492_16794cztM0_level2.evt | modeM0/AS1A05_004T07_9000002492_16794cztM0_level2_quad_clean.evt |
| Size (bytes) | 594,385,920 | 100,506,240 |
| Size | 566.9 MB | 95.9 MB |
| Events in quadrant A | 4,510,728 | 636,288 |
| Events in quadrant B | 3,811,507 | 658,434 |
| Events in quadrant C | 4,371,211 | 635,574 |
| Events in quadrant D | 4,816,651 | 608,793 |
| Mode M9 | |||
|---|---|---|---|
| Quadrant | BADHDUFLAG | Total packets | Discarded packets |
| A | 0 | 8 | 0 |
| B | 0 | 8 | 0 |
| C | 0 | 8 | 0 |
| D | 0 | 9 | 0 |
| Mode SS | |||
|---|---|---|---|
| Quadrant | BADHDUFLAG | Total packets | Discarded packets |
| A | 0 | 148 | 0 |
| B | 0 | 148 | 0 |
| C | 0 | 148 | 0 |
| D | 0 | 148 | 0 |
| Mode M0 | |||
|---|---|---|---|
| Quadrant | BADHDUFLAG | Total packets | Discarded packets |
| A | 0 | 18229 | 3 |
| B | 0 | 15996 | 2 |
| C | 0 | 17711 | 2 |
| D | 0 | 19142 | 2 |
| Quadrant | Total seconds | Saturated seconds | Saturation percentage |
|---|---|---|---|
| A | 7246 | 365 | 5.037262% |
| B | 7246 | 150 | 2.070108% |
| C | 7246 | 180 | 2.484129% |
| D | 7246 | 394 | 5.437483% |
Noise dominated data is calculated using 1-second bins in cleaned event files. If a bin has >2000 counts, and if more than 50% of those come from <1% of pixels, then it is considered to be noise-dominated and hence unusable.
| Quadrant | # 1 sec bins | Bins with >0 counts | Bins with >2000 counts | High rate bins dominated by noise | Noise dominated (total time) | Noise dominated (detector-on time) | Marked lightcurve |
|---|---|---|---|---|---|---|---|
| A | 7652 | 7249 | 208 | 208 | 2.72% | 2.87% | 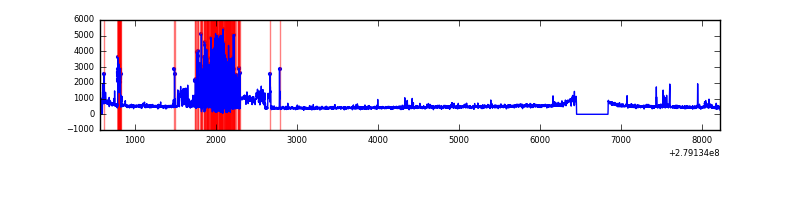 |
| B | 7652 | 7249 | 24 | 24 | 0.31% | 0.33% | 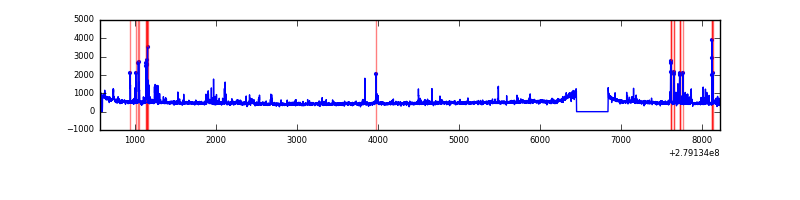 |
| C | 7652 | 7249 | 0 | 0 | 0.00% | 0.00% |  |
| D | 7652 | 7249 | 233 | 233 | 3.04% | 3.21% | 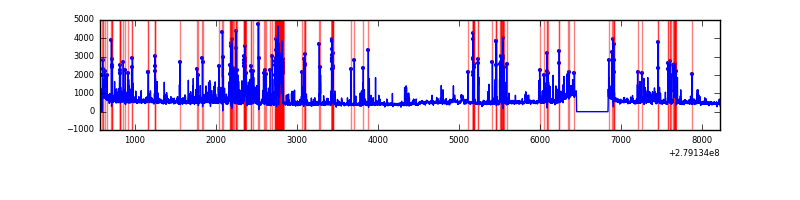 |
Top three noisy pixels from each quadrant. If the there are fewer than three noisy pixels in the level2.evt file, extra rows are filled as -1
| Pixel properties | Quadrant properties | ||||||
|---|---|---|---|---|---|---|---|
| Quadrant | DetID | PixID | Counts | Sigma | Mean | Median | Sigma |
| A | 15 | 174 | 923961 | 5153.29 | 879 | 860 | 179.1 |
| A | 15 | 190 | 100119 | 554.12 | 879 | 860 | 179.1 |
| A | 15 | 158 | 43937 | 240.48 | 879 | 860 | 179.1 |
| B | 0 | 229 | 193427 | 1125.85 | 887 | 862 | 171.0 |
| B | 15 | 35 | 47529 | 272.84 | 887 | 862 | 171.0 |
| B | 0 | 189 | 45846 | 263.0 | 887 | 862 | 171.0 |
| C | 3 | 233 | 615113 | 3031.59 | 856 | 863 | 202.6 |
| C | 7 | 247 | 199179 | 978.77 | 856 | 863 | 202.6 |
| C | 14 | 238 | 132130 | 647.86 | 856 | 863 | 202.6 |
| D | 1 | 52 | 1191507 | 5655.74 | 855 | 828 | 210.5 |
| D | 12 | 218 | 98934 | 466.0 | 855 | 828 | 210.5 |
| D | 13 | 248 | 69942 | 328.29 | 855 | 828 | 210.5 |
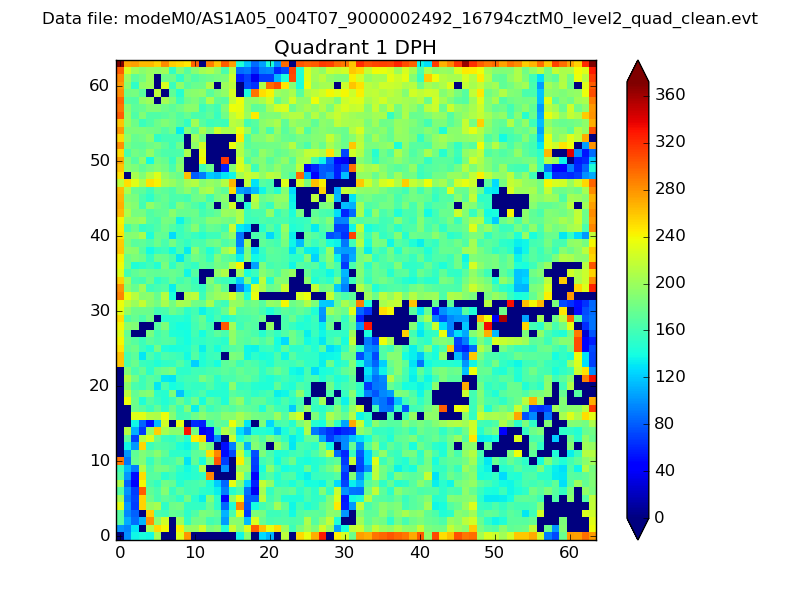
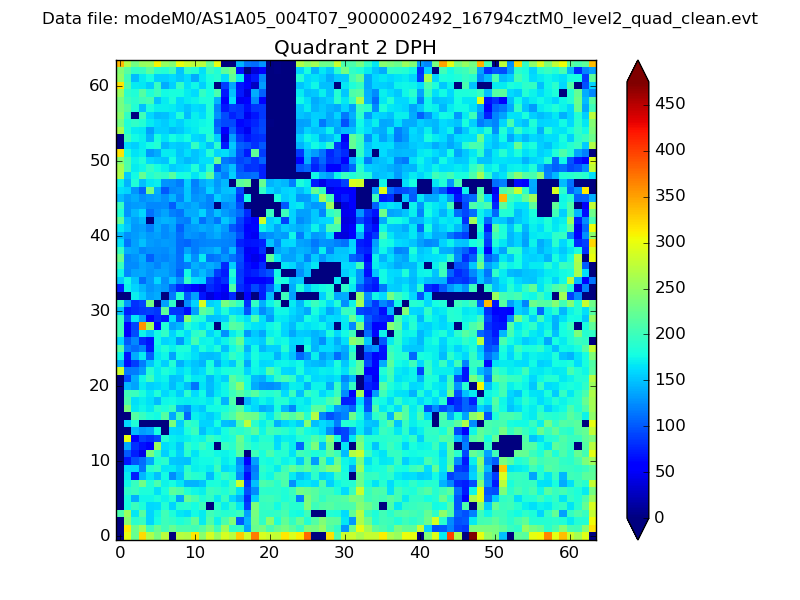
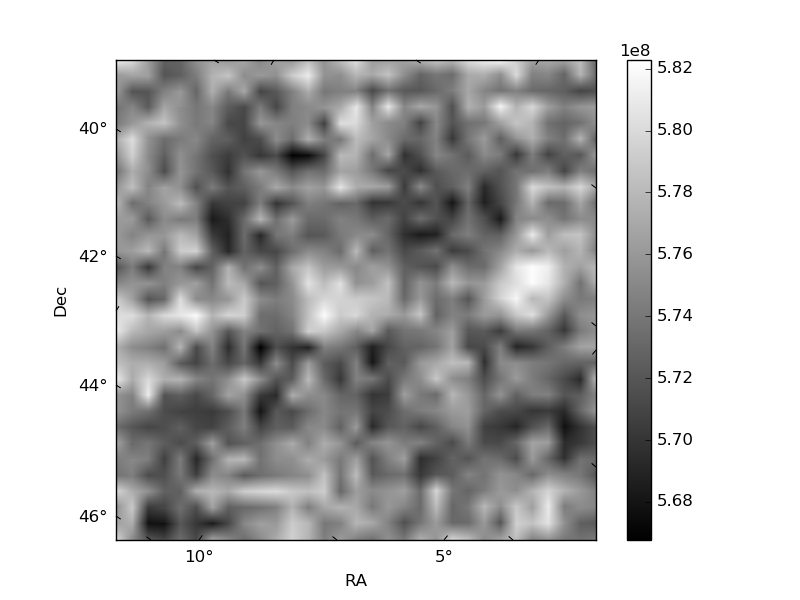
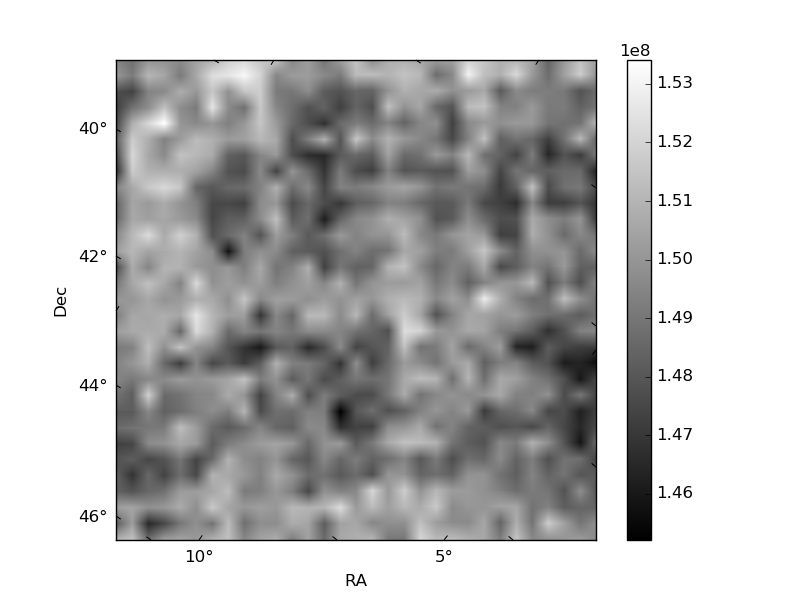
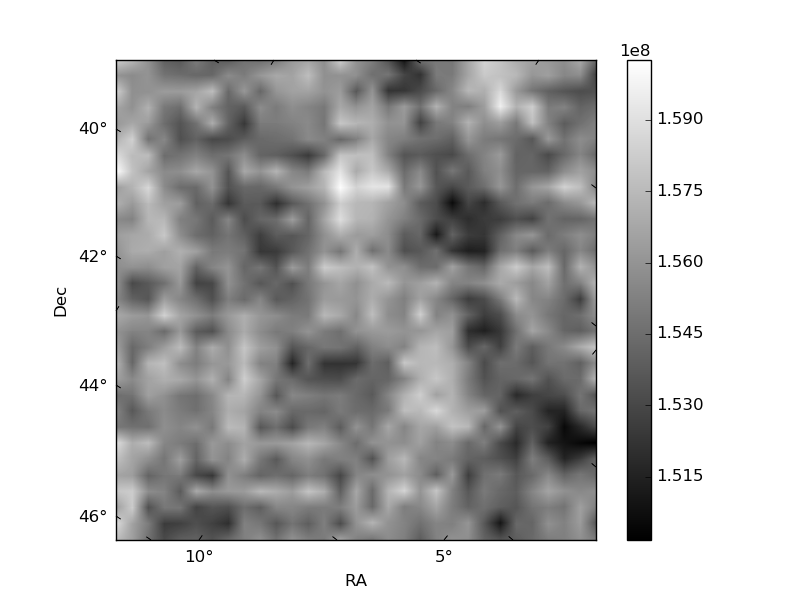
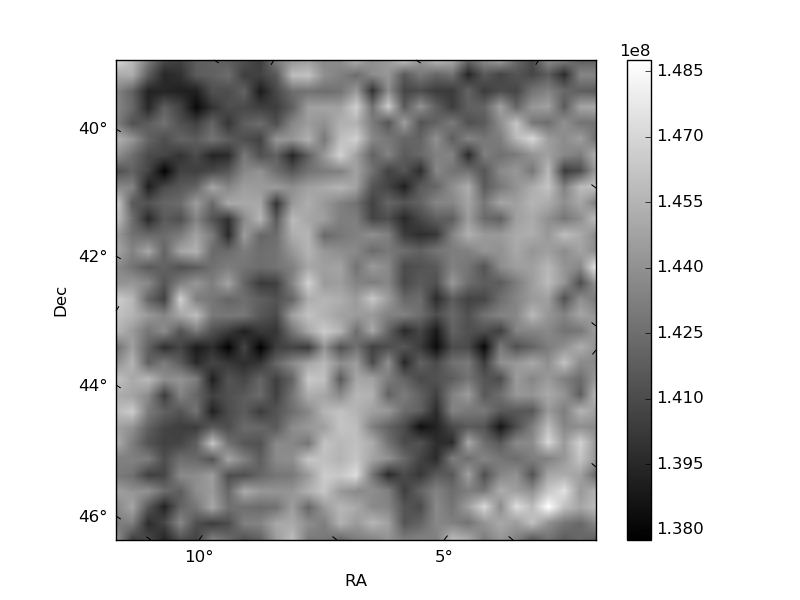
Histogram calculated using DETX and DETY for each event in the final _common_clean file
| Quadrant A | 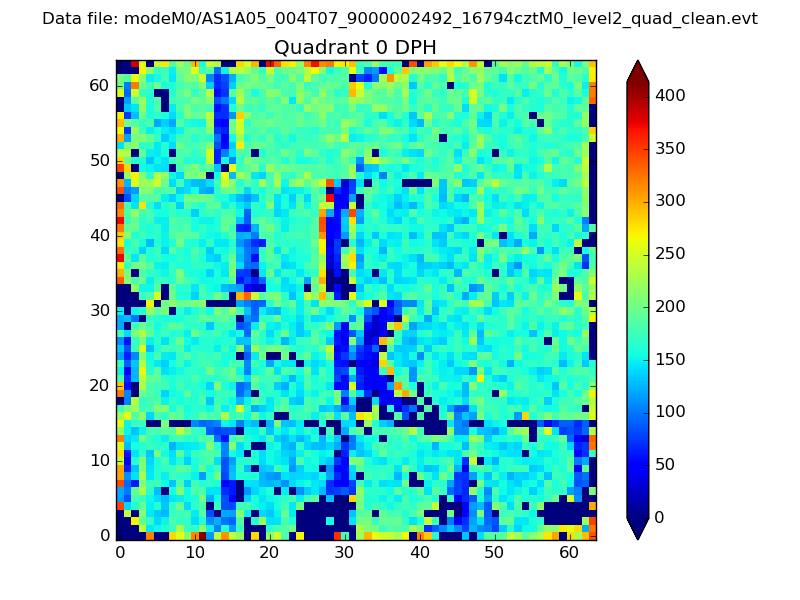 |
 |
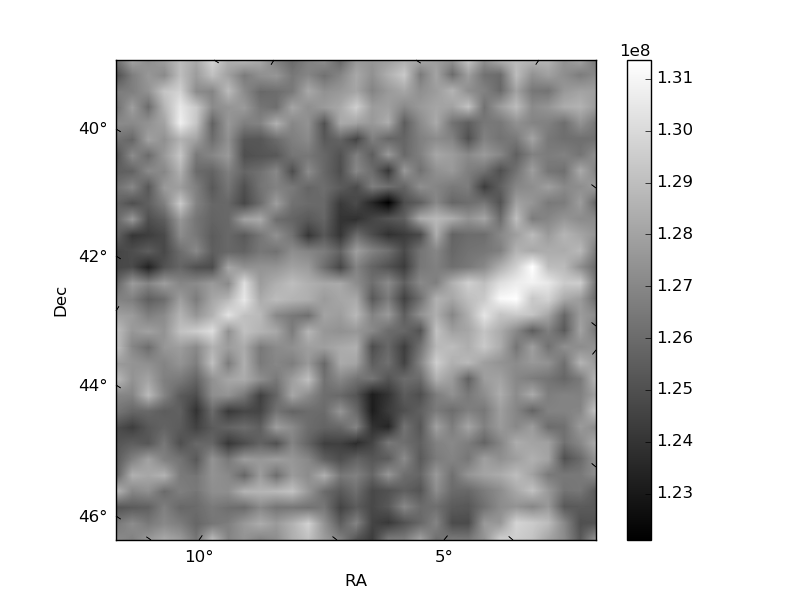
Quadrant B |
|---|---|---|---|
| Quadrant D | 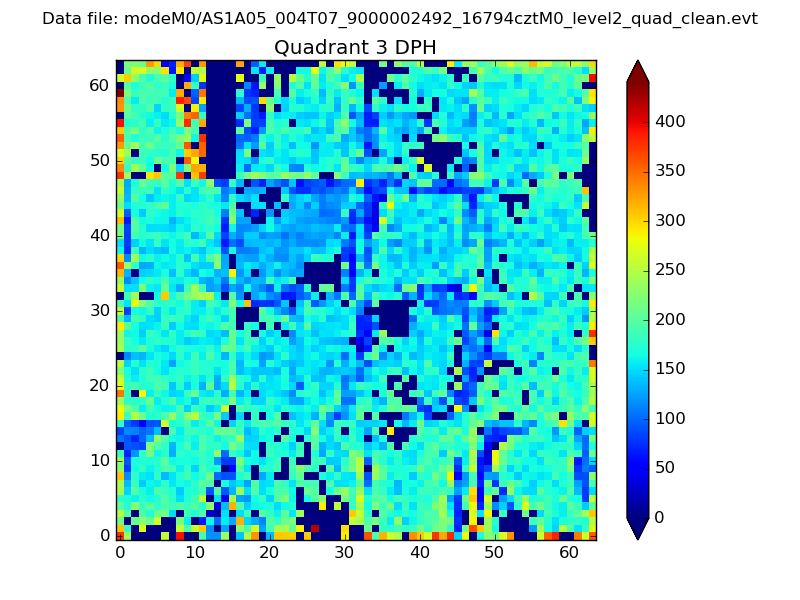 |
 |
Quadrant C |
| Plot type | Count rate plots | Images |
|---|---|---|
| Comparison with Poisson distribution Blue bars denote a histogram of data divided into 1 sec bins. Red curve is a Poisson curve with rate = median count rate of data. |
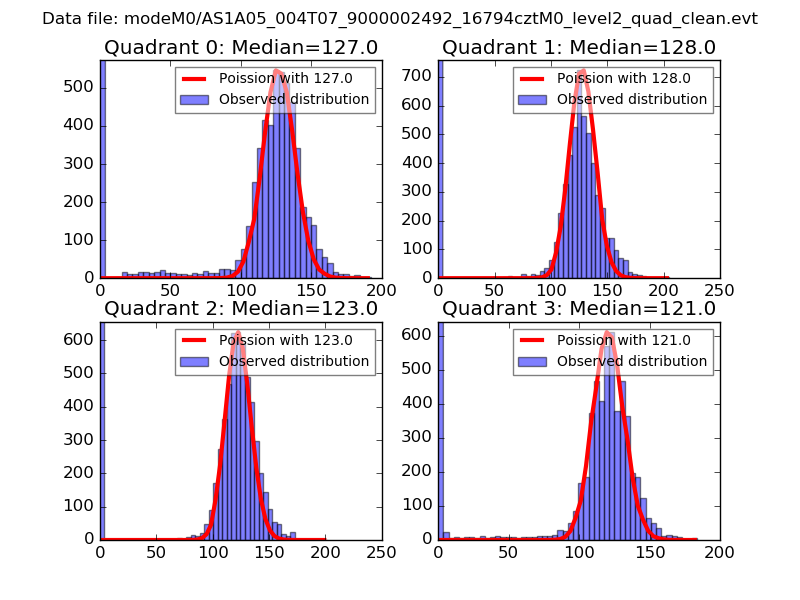 |
 |
| Quadrant-wise count rates Data is divided into 100 sec bins |
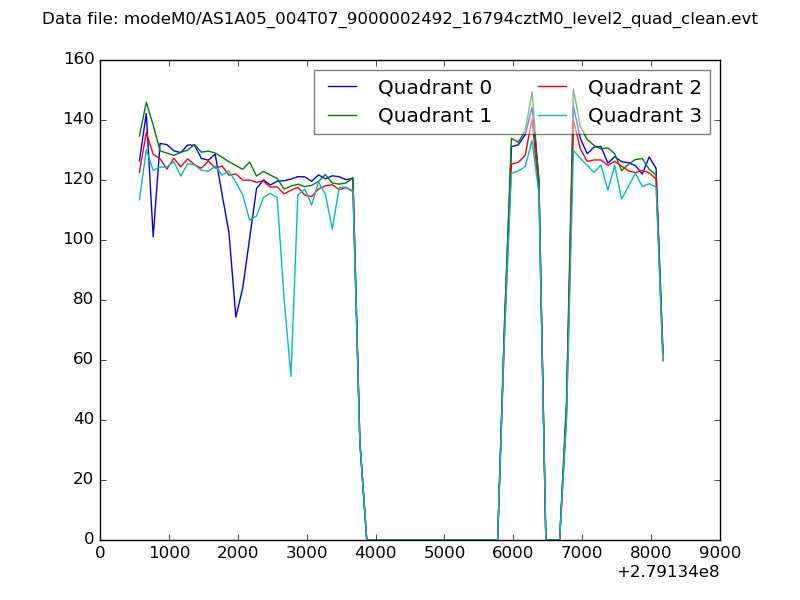 |
|
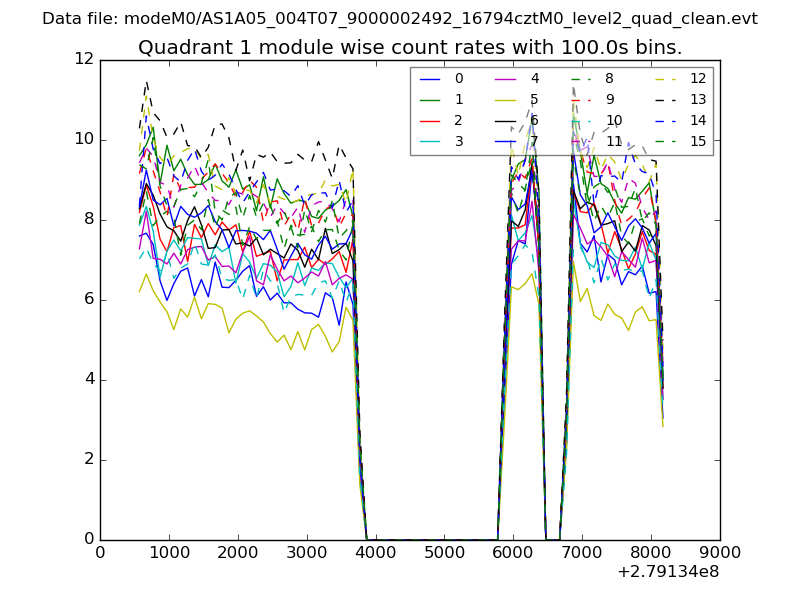
| Module-wise count rates for Quadrant A Data is divided into 100 sec bins |
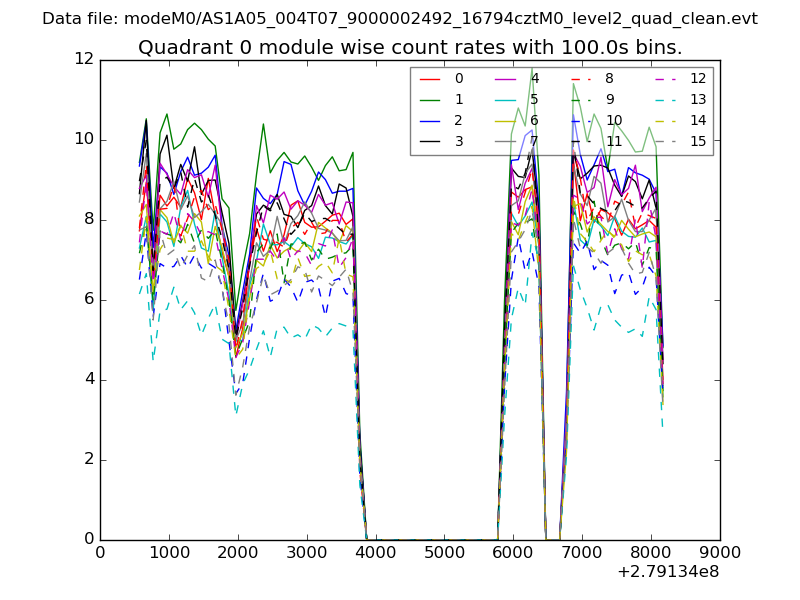 |
 |
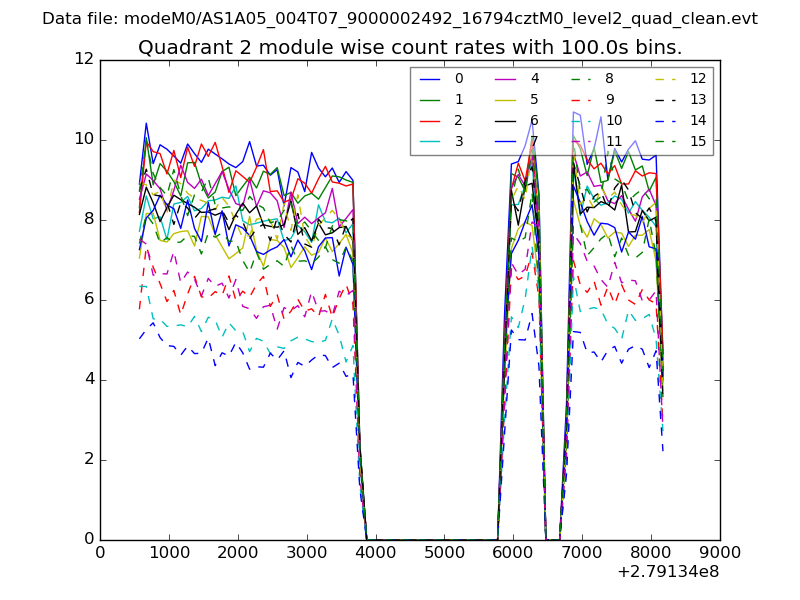
| Module-wise count rates for Quadrant B Data is divided into 100 sec bins |
 |
 |
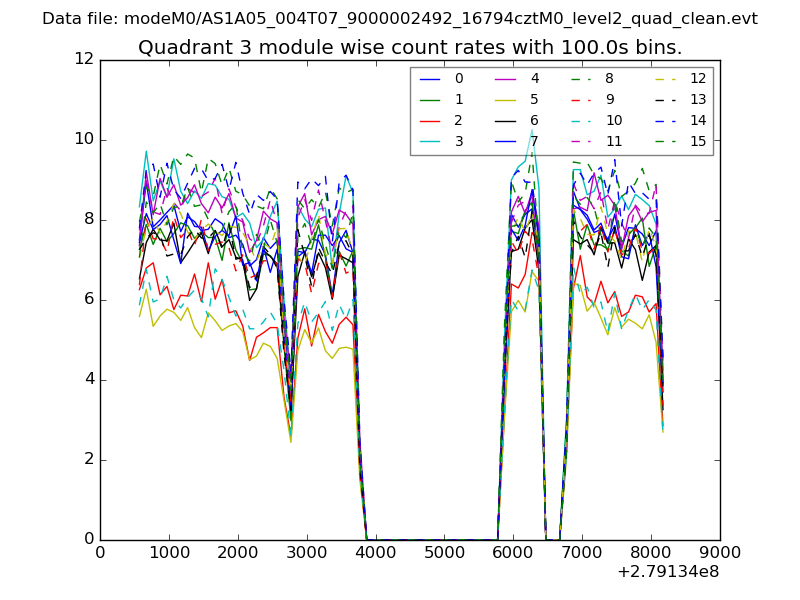
| Module-wise count rates for Quadrant C Data is divided into 100 sec bins |
 |
 |
| Module-wise count rates for Quadrant D Data is divided into 100 sec bins |
 |
 |
| Parameter | Plot |
|---|---|
| CZT HV Monitor | 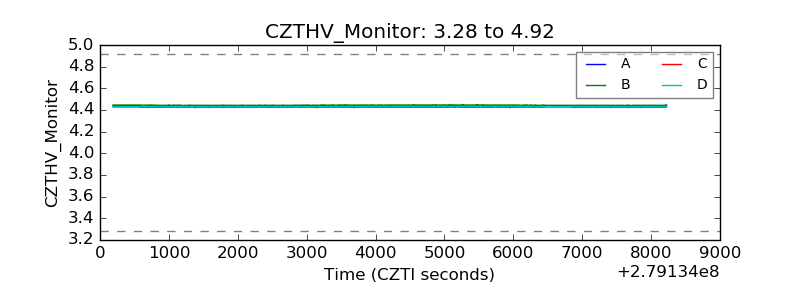 |
| D_VDD | 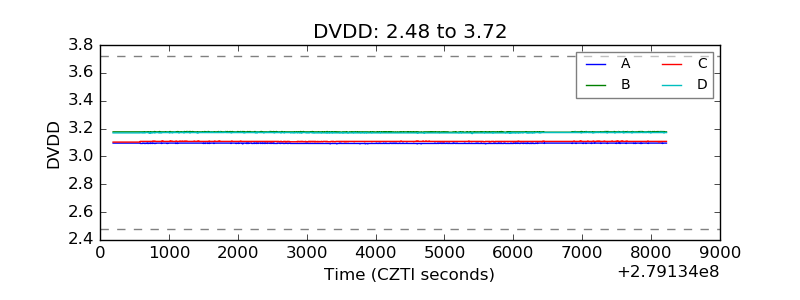 |
| Temperature 1 | 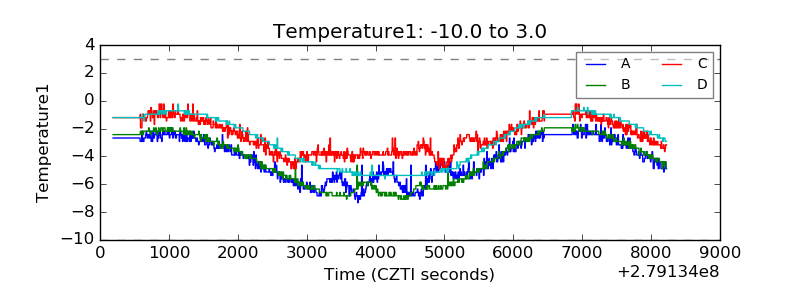 |
| Veto HV Monitor | 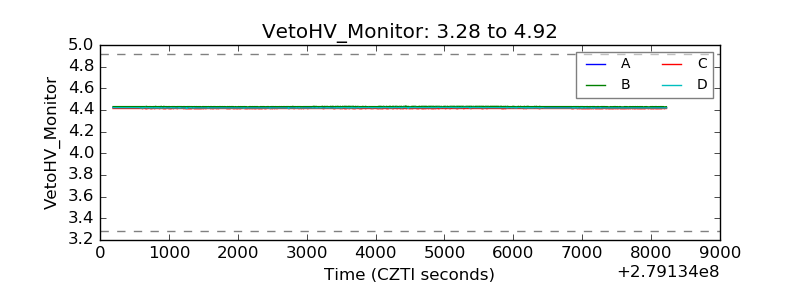 |
| Veto LLD | 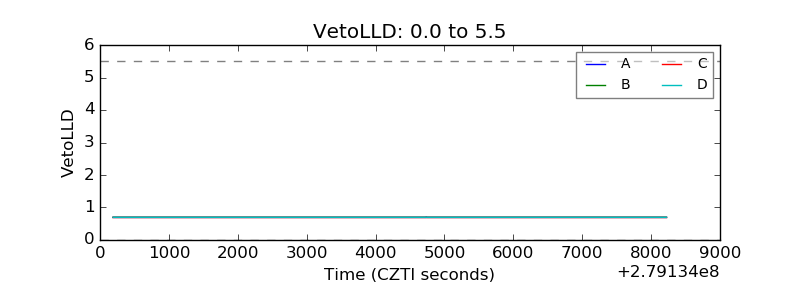 |
| Alpha Counter | 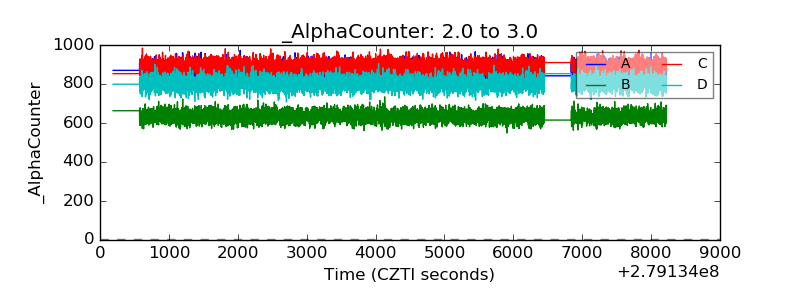 |
| _CPM_Rate | 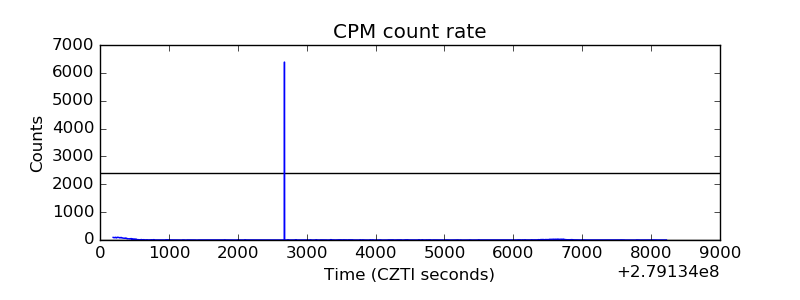 |
| CZT Counter | 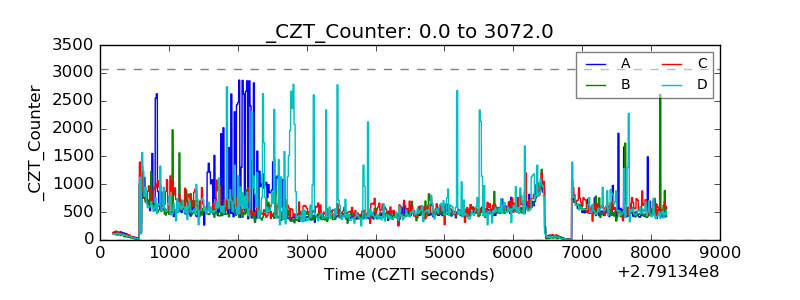 |
| +2.5 Volts monitor |  |
| +5 Volts monitor | 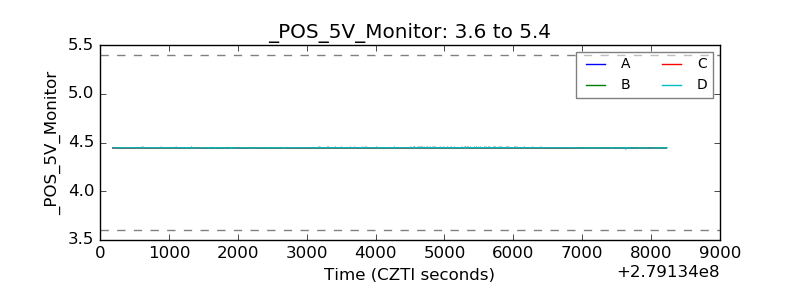 |
| _ROLL_ROT |  |
| _Roll_DEC | 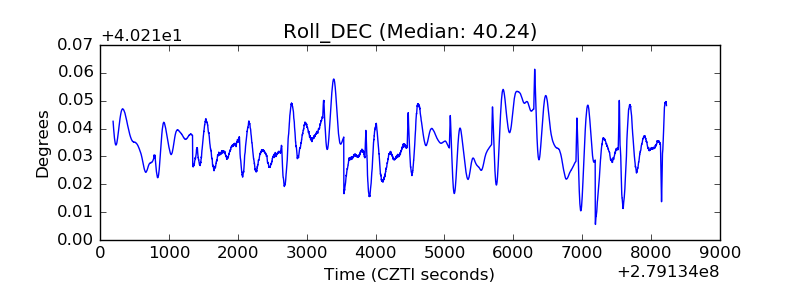 |
| _Roll_RA | 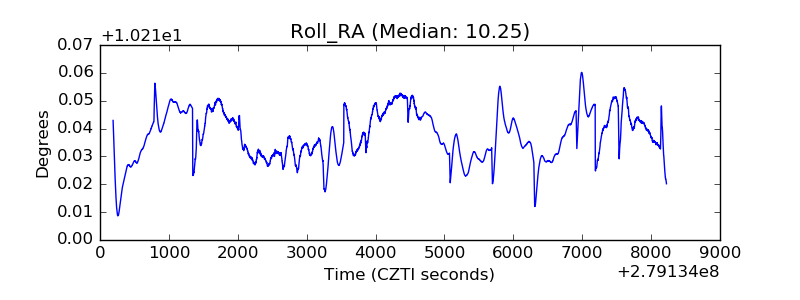 |
| Veto Counter | 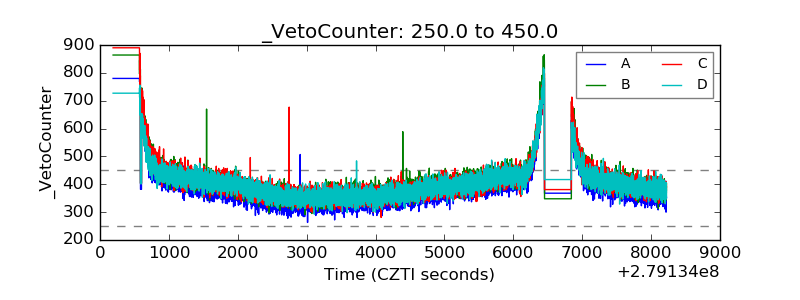 |