| Param | Original file | Final file |
|---|---|---|
| Filename | modeM0/AS1A05_004T07_9000002492_16795cztM0_level2.evt | modeM0/AS1A05_004T07_9000002492_16795cztM0_level2_quad_clean.evt |
| Size (bytes) | 143,208,000 | 34,427,520 |
| Size | 136.6 MB | 32.8 MB |
| Events in quadrant A | 948,093 | 231,572 |
| Events in quadrant B | 1,017,220 | 233,295 |
| Events in quadrant C | 1,111,480 | 225,673 |
| Events in quadrant D | 1,134,978 | 219,338 |
| Mode M9 | |||
|---|---|---|---|
| Quadrant | BADHDUFLAG | Total packets | Discarded packets |
| A | 0 | 4 | 0 |
| B | 0 | 4 | 0 |
| C | 0 | 4 | 0 |
| D | 0 | 4 | 0 |
| Mode SS | |||
|---|---|---|---|
| Quadrant | BADHDUFLAG | Total packets | Discarded packets |
| A | 0 | 38 | 0 |
| B | 0 | 38 | 0 |
| C | 0 | 38 | 0 |
| D | 0 | 38 | 0 |
| Mode M0 | |||
|---|---|---|---|
| Quadrant | BADHDUFLAG | Total packets | Discarded packets |
| A | 0 | 4009 | 1 |
| B | 0 | 4192 | 1 |
| C | 0 | 4521 | 1 |
| D | 0 | 4542 | 1 |
| Quadrant | Total seconds | Saturated seconds | Saturation percentage |
|---|---|---|---|
| A | 1808 | 60 | 3.318584% |
| B | 1808 | 81 | 4.480088% |
| C | 1808 | 82 | 4.535398% |
| D | 1808 | 90 | 4.977876% |
Noise dominated data is calculated using 1-second bins in cleaned event files. If a bin has >2000 counts, and if more than 50% of those come from <1% of pixels, then it is considered to be noise-dominated and hence unusable.
| Quadrant | # 1 sec bins | Bins with >0 counts | Bins with >2000 counts | High rate bins dominated by noise | Noise dominated (total time) | Noise dominated (detector-on time) | Marked lightcurve |
|---|---|---|---|---|---|---|---|
| A | 2199 | 1810 | 0 | 0 | 0.00% | 0.00% | 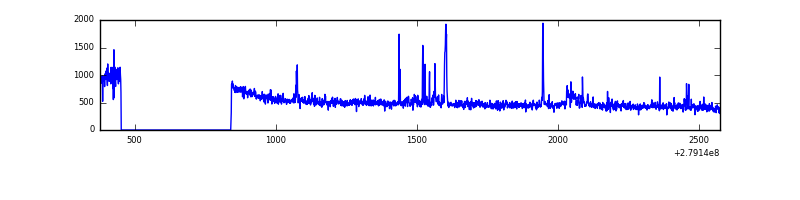 |
| B | 2199 | 1810 | 14 | 14 | 0.64% | 0.77% | 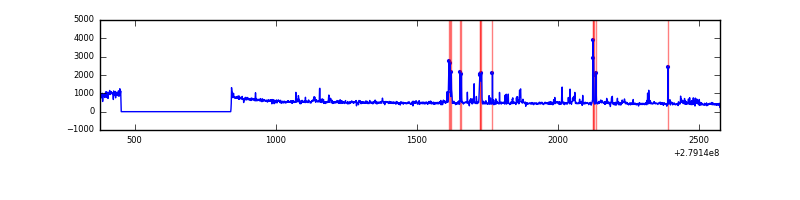 |
| C | 2199 | 1810 | 0 | 0 | 0.00% | 0.00% | 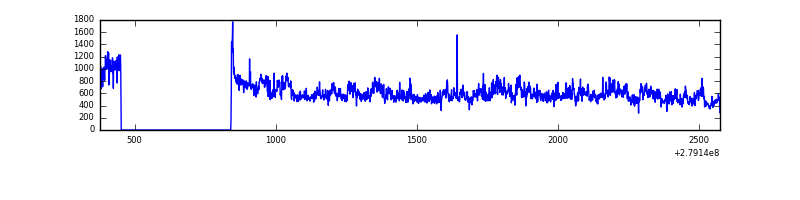 |
| D | 2199 | 1810 | 30 | 30 | 1.36% | 1.66% | 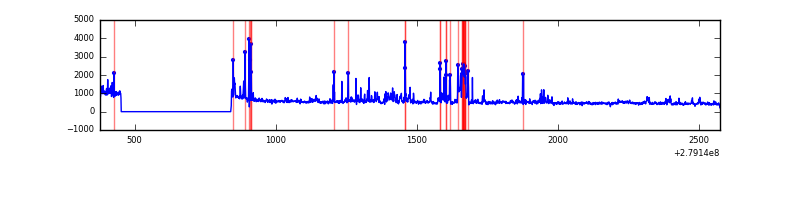 |
Top three noisy pixels from each quadrant. If the there are fewer than three noisy pixels in the level2.evt file, extra rows are filled as -1
| Pixel properties | Quadrant properties | ||||||
|---|---|---|---|---|---|---|---|
| Quadrant | DetID | PixID | Counts | Sigma | Mean | Median | Sigma |
| A | 15 | 174 | 52260 | 1052.42 | 231 | 225 | 49.4 |
| A | 10 | 234 | 3957 | 75.48 | 231 | 225 | 49.4 |
| A | 9 | 143 | 3129 | 58.73 | 231 | 225 | 49.4 |
| B | 0 | 229 | 37913 | 824.24 | 227 | 220 | 45.7 |
| B | 15 | 35 | 28121 | 610.12 | 227 | 220 | 45.7 |
| B | 0 | 189 | 26666 | 578.3 | 227 | 220 | 45.7 |
| C | 3 | 233 | 149867 | 2747.97 | 223 | 223 | 54.5 |
| C | 0 | 207 | 39513 | 721.5 | 223 | 223 | 54.5 |
| C | 14 | 238 | 34352 | 626.72 | 223 | 223 | 54.5 |
| D | 1 | 52 | 159363 | 2756.46 | 228 | 221 | 57.7 |
| D | 12 | 110 | 50865 | 877.19 | 228 | 221 | 57.7 |
| D | 2 | 33 | 45871 | 790.69 | 228 | 221 | 57.7 |
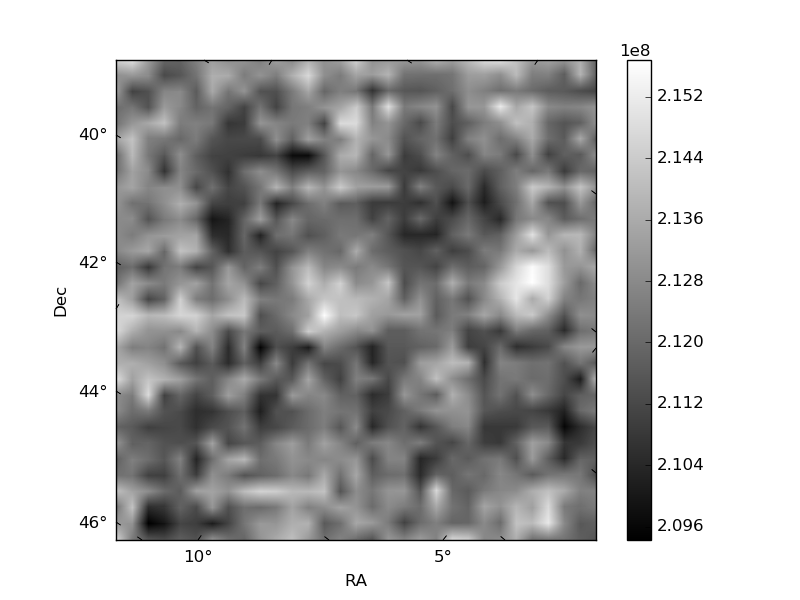
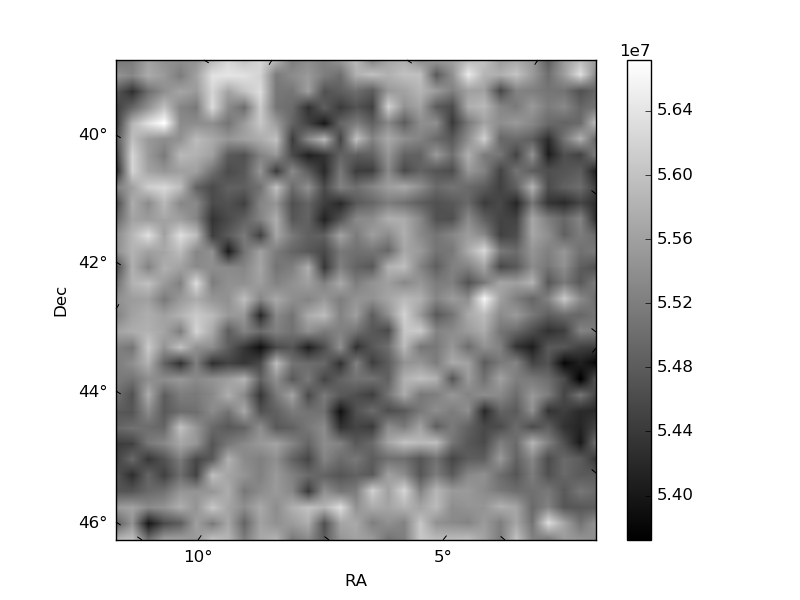
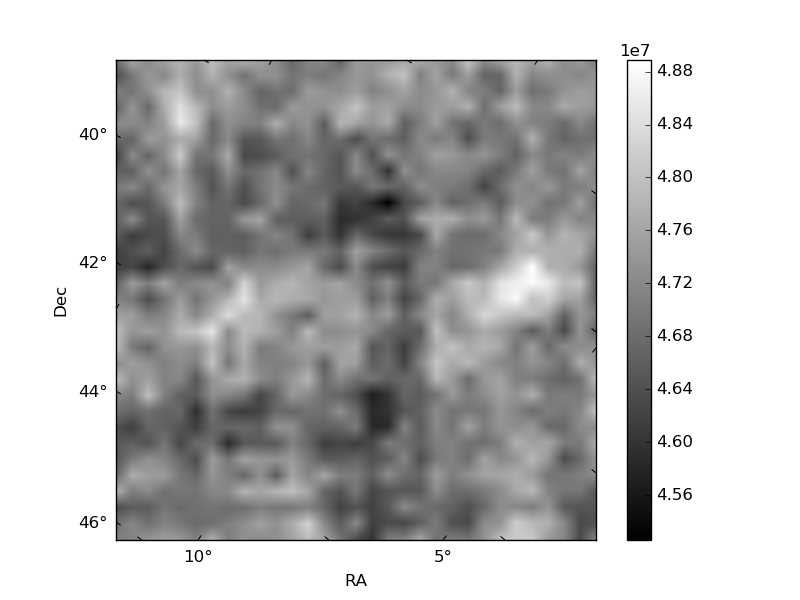
Histogram calculated using DETX and DETY for each event in the final _common_clean file
| Quadrant A | 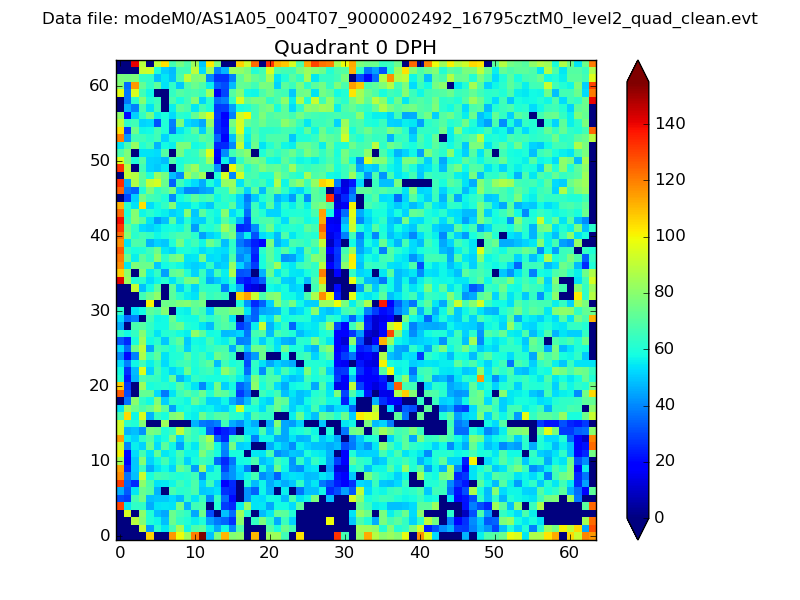 |
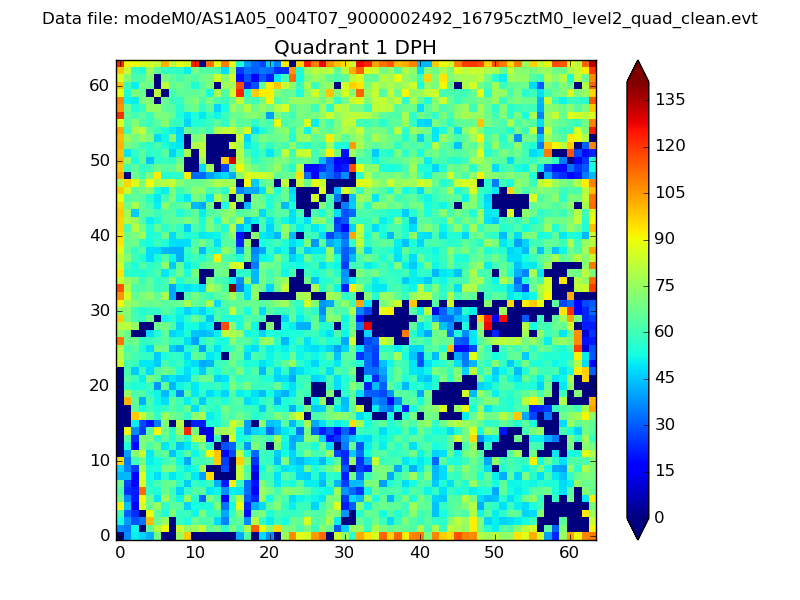 |
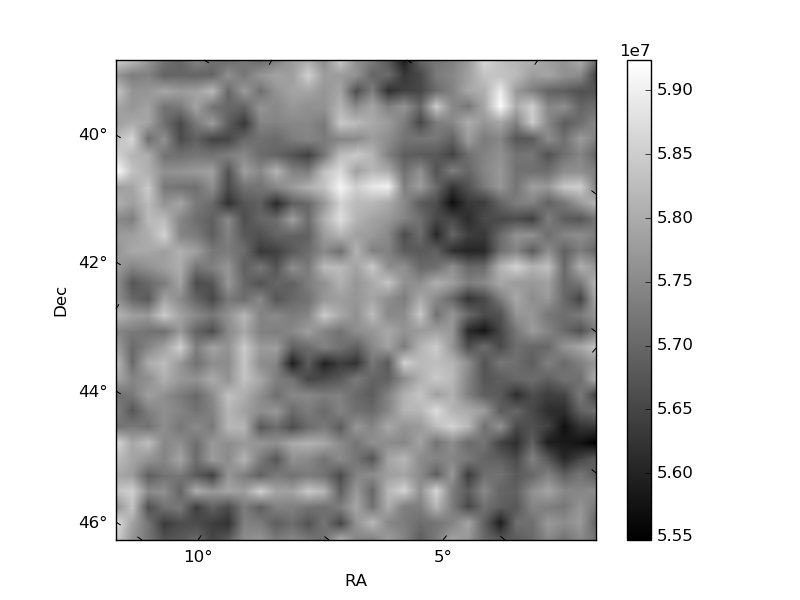
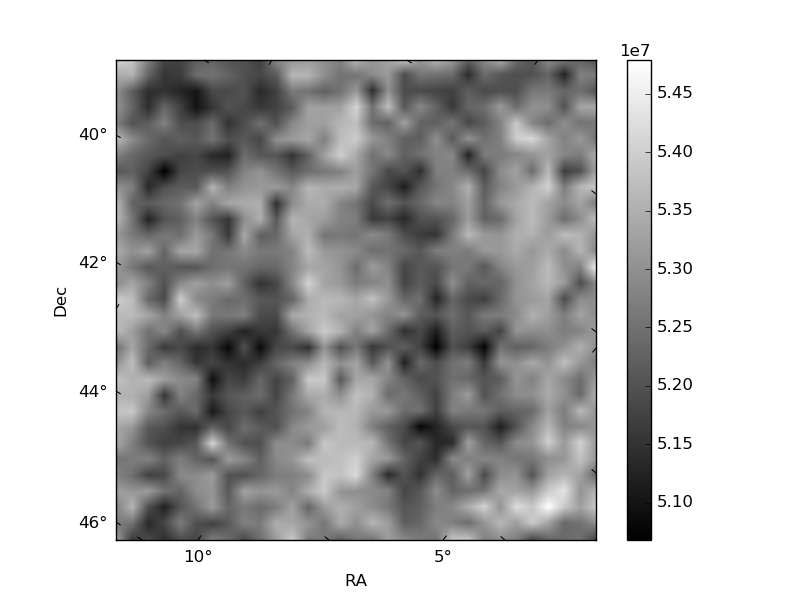
Quadrant B |
|---|---|---|---|
| Quadrant D | 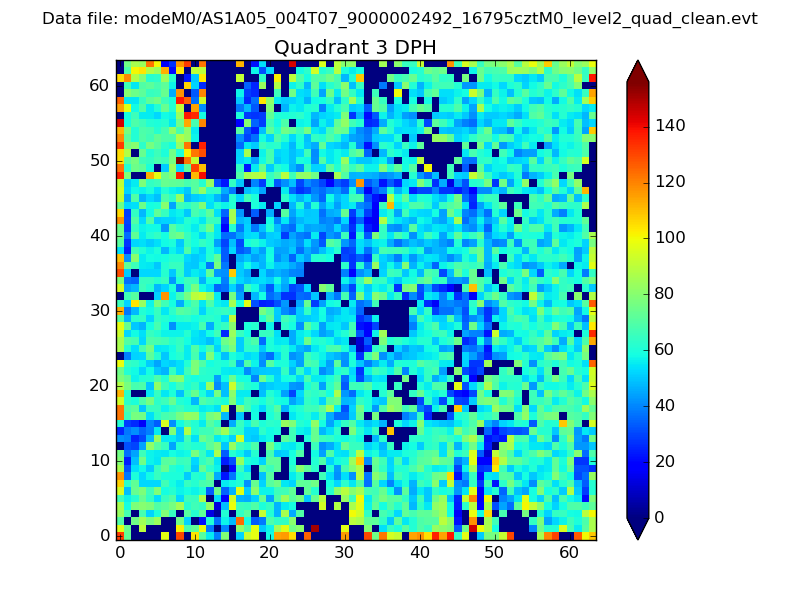 |
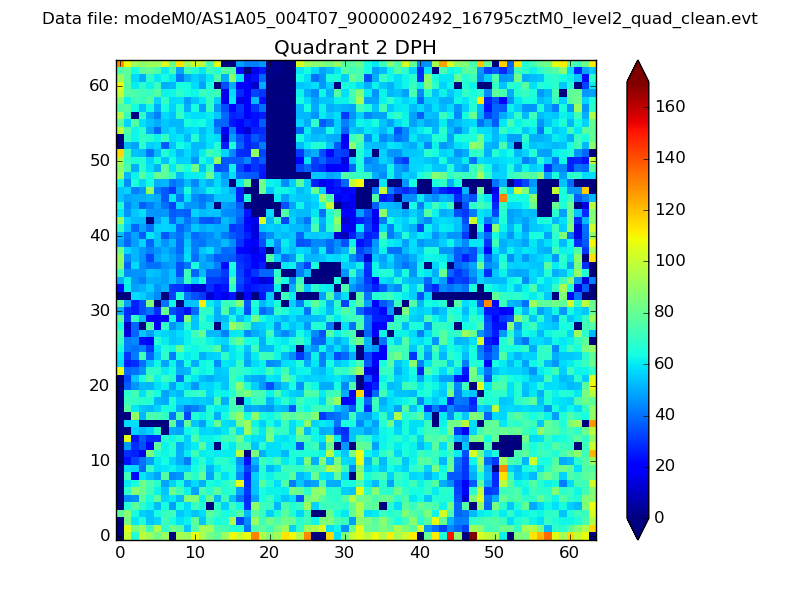 |
Quadrant C |
| Plot type | Count rate plots | Images |
|---|---|---|
| Comparison with Poisson distribution Blue bars denote a histogram of data divided into 1 sec bins. Red curve is a Poisson curve with rate = median count rate of data. |
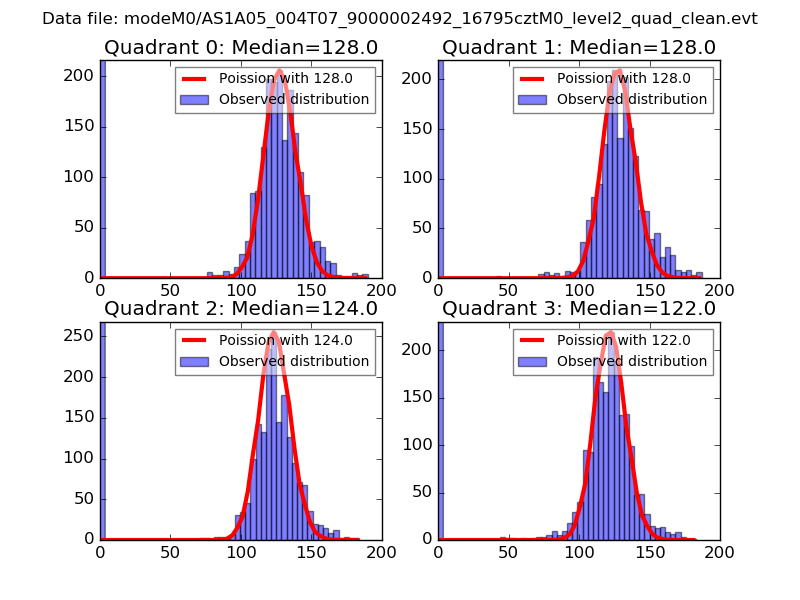 |
 |
| Quadrant-wise count rates Data is divided into 100 sec bins |
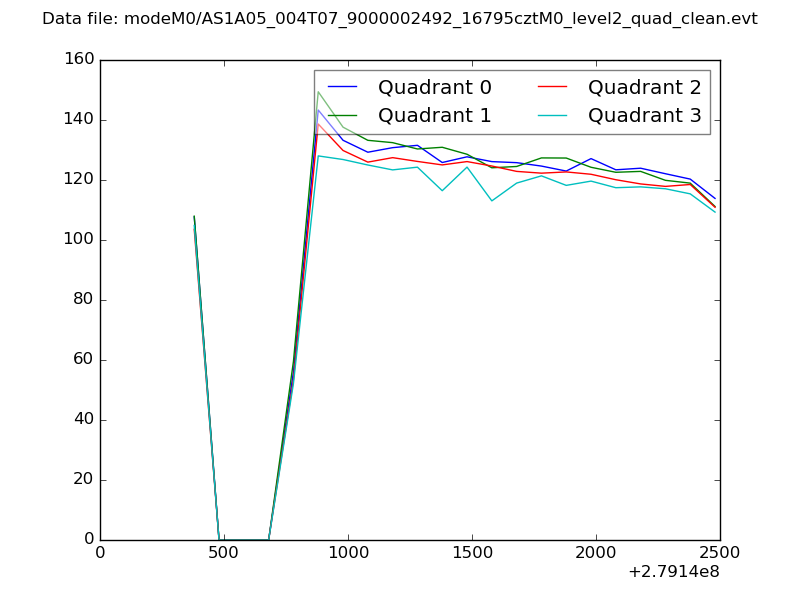 |
|
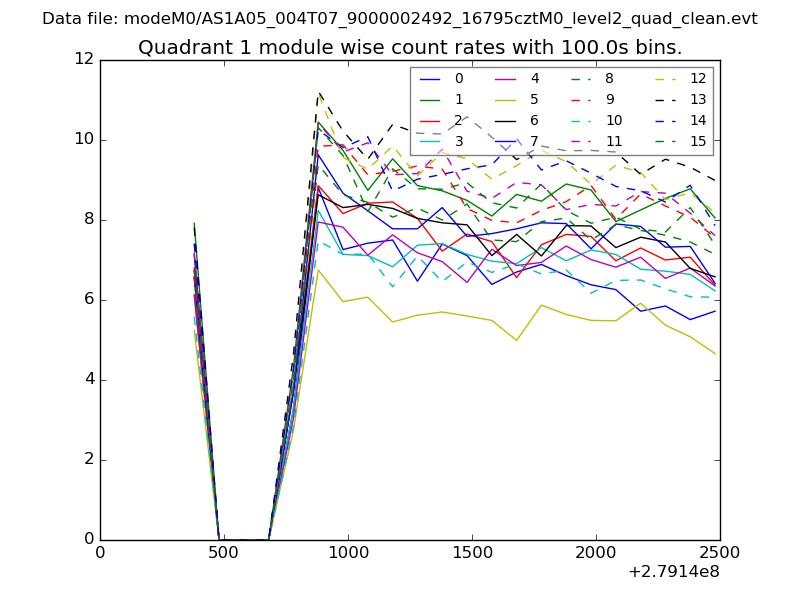
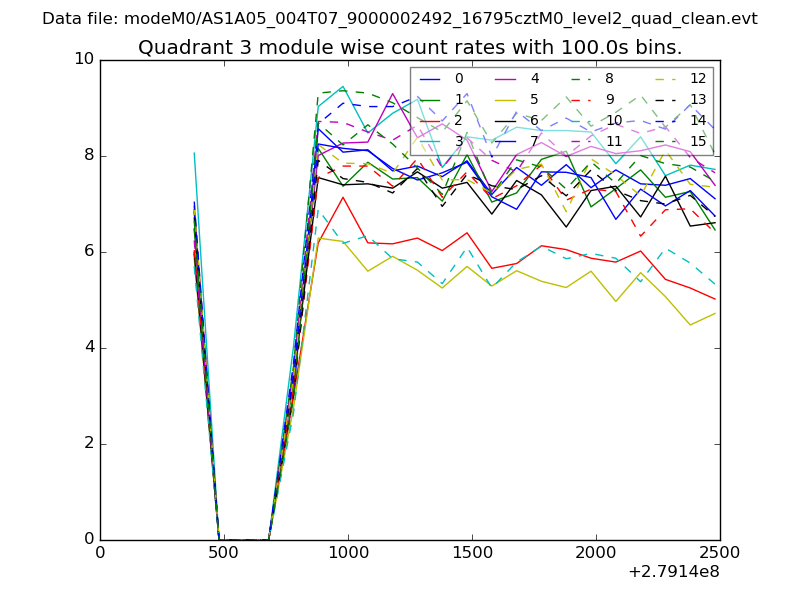
| Module-wise count rates for Quadrant A Data is divided into 100 sec bins |
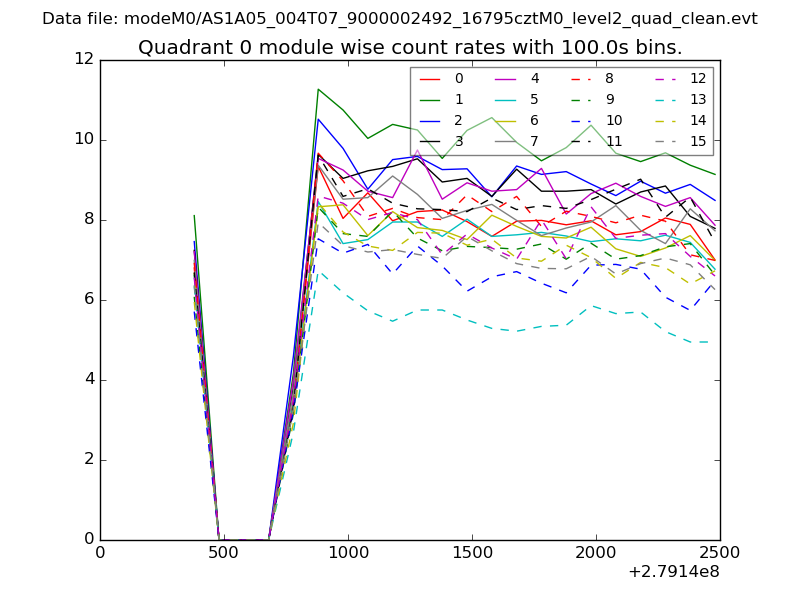 |
 |
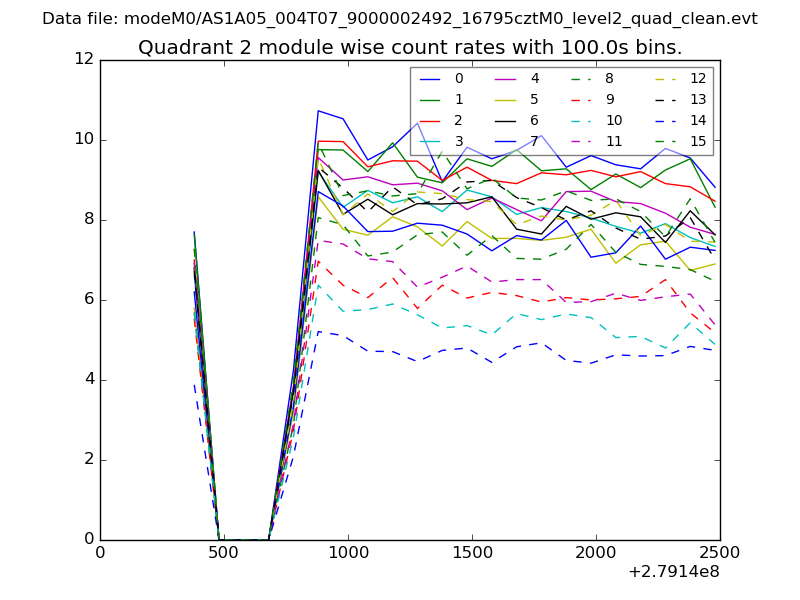
| Module-wise count rates for Quadrant B Data is divided into 100 sec bins |
 |
 |
| Module-wise count rates for Quadrant C Data is divided into 100 sec bins |
 |
 |
| Module-wise count rates for Quadrant D Data is divided into 100 sec bins |
 |
 |
| Parameter | Plot |
|---|---|
| CZT HV Monitor | 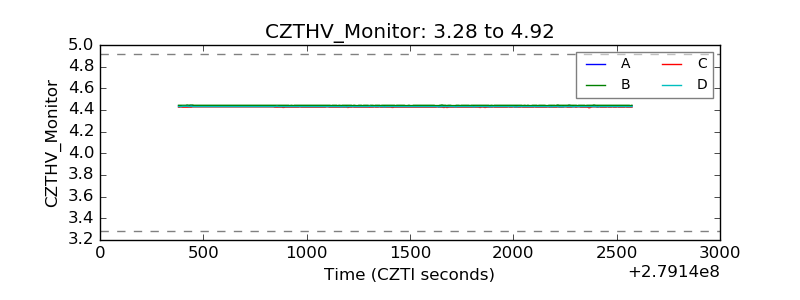 |
| D_VDD | 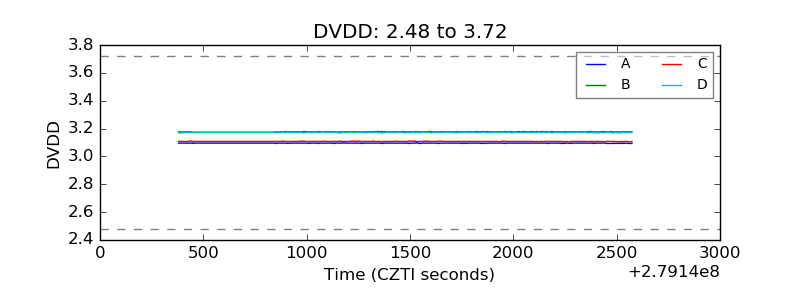 |
| Temperature 1 | 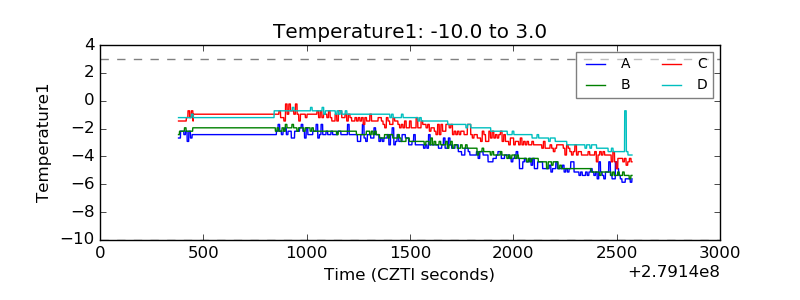 |
| Veto HV Monitor | 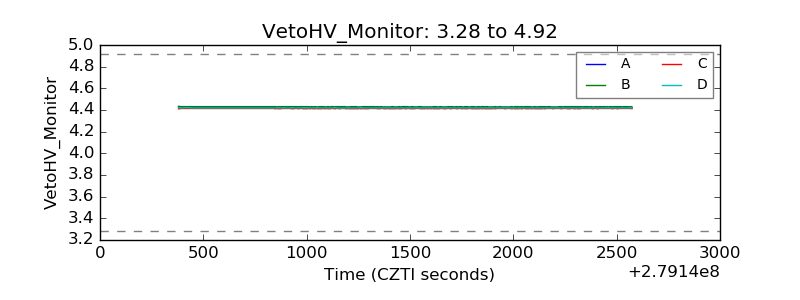 |
| Veto LLD | 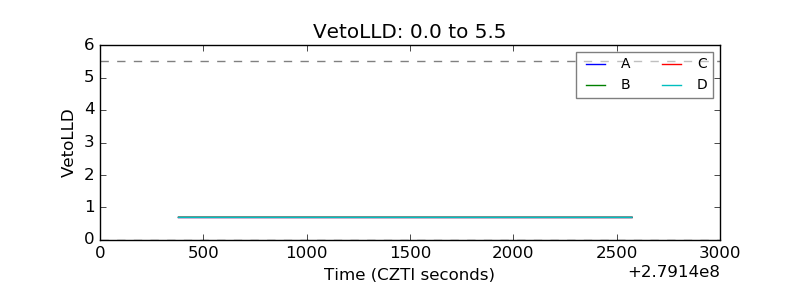 |
| Alpha Counter | 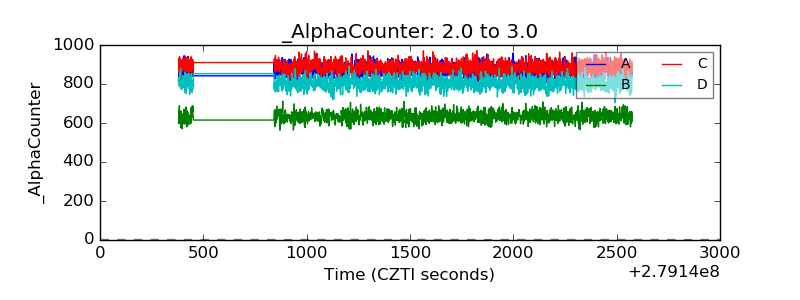 |
| _CPM_Rate | 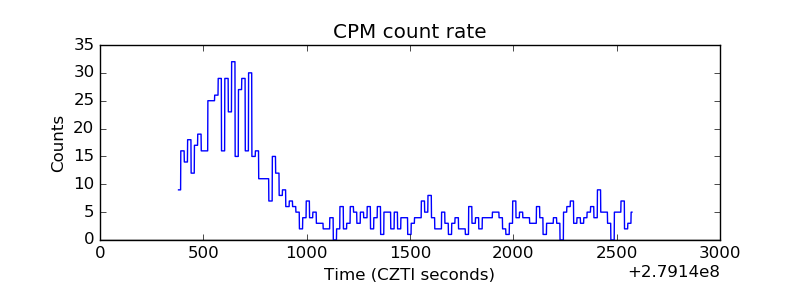 |
| CZT Counter | 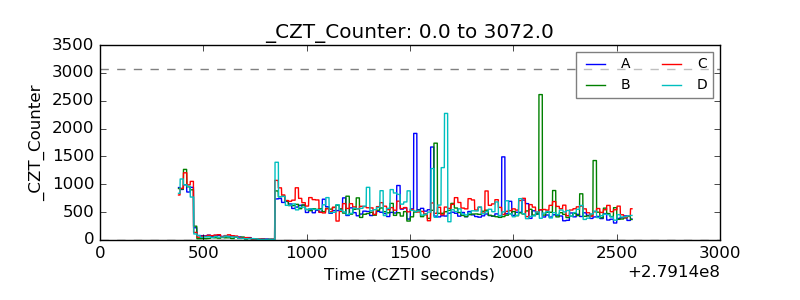 |
| +2.5 Volts monitor |  |
| +5 Volts monitor |  |
| _ROLL_ROT | 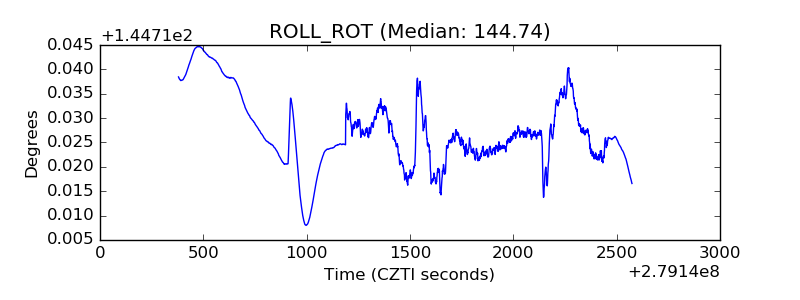 |
| _Roll_DEC | 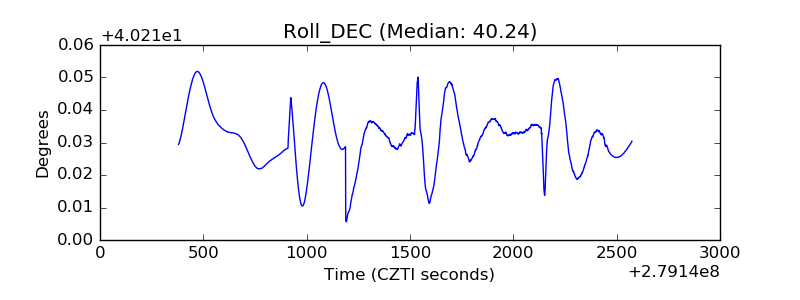 |
| _Roll_RA | 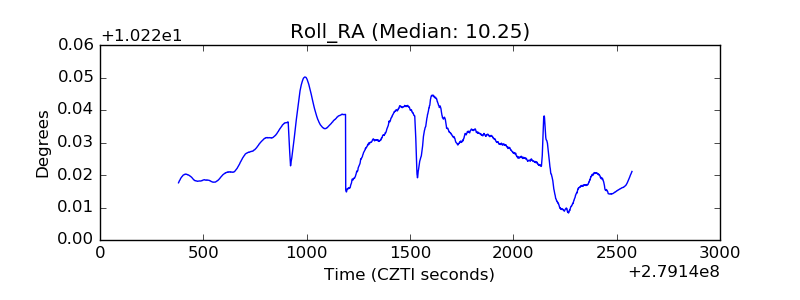 |
| Veto Counter | 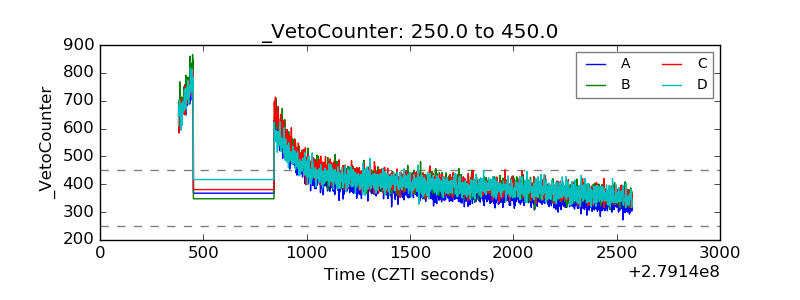 |