| Param | Original file | Final file |
|---|---|---|
| Filename | modeM0/AS1A05_140T01_9000002496cztM0_level2.fits | modeM0/AS1A05_140T01_9000002496cztM0_level2_quad_clean.evt |
| Size (bytes) | 776,554,560 | 696,905,280 |
| Size | 740.6 MB | 664.6 MB |
| Events in quadrant A | 4,769,958 | 4,048,865 |
| Events in quadrant B | 4,587,984 | 4,171,012 |
| Events in quadrant C | 4,681,276 | 3,954,564 |
| Events in quadrant D | 3,957,460 | 3,414,052 |
| Mode SS | |||
|---|---|---|---|
| Quadrant | BADHDUFLAG | Total packets | Discarded packets |
| A | 0 | 1636 | 0 |
| B | 0 | 1636 | 0 |
| C | 0 | 1636 | 0 |
| D | 0 | 1636 | 0 |
| Mode M0 | |||
|---|---|---|---|
| Quadrant | BADHDUFLAG | Total packets | Discarded packets |
| A | 0 | 200504 | 0 |
| B | 0 | 186208 | 0 |
| C | 0 | 184858 | 0 |
| D | 0 | 253221 | 0 |
| Mode M9 | |||
|---|---|---|---|
| Quadrant | BADHDUFLAG | Total packets | Discarded packets |
| A | 0 | 125 | 0 |
| B | 0 | 125 | 0 |
| C | 0 | 125 | 0 |
| D | 0 | 125 | 0 |
| Quadrant | Total seconds | Saturated seconds | Saturation percentage |
|---|---|---|---|
| A | 80467 | 3892 | 4.836765% |
| B | 80467 | 1700 | 2.112667% |
| C | 80467 | 1934 | 2.403470% |
| D | 80467 | 7389 | 9.182646% |
Noise dominated data is calculated using 1-second bins in cleaned event files. If a bin has >2000 counts, and if more than 50% of those come from <1% of pixels, then it is considered to be noise-dominated and hence unusable.
| Quadrant | # 1 sec bins | Bins with >0 counts | Bins with >2000 counts | High rate bins dominated by noise | Noise dominated (total time) | Noise dominated (detector-on time) | Marked lightcurve |
|---|---|---|---|---|---|---|---|
| A | 92858 | 80457 | 0 | 0 | 0.00% | 0.00% | 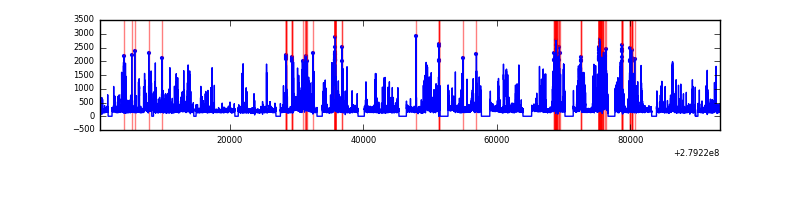 |
| B | 92858 | 80465 | 0 | 0 | 0.00% | 0.00% | 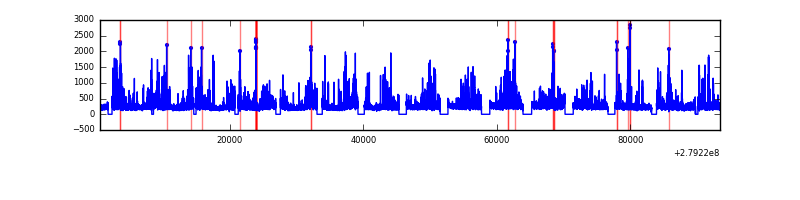 |
| C | 92858 | 80468 | 0 | 0 | 0.00% | 0.00% |  |
| D | 92858 | 80328 | 0 | 0 | 0.00% | 0.00% | 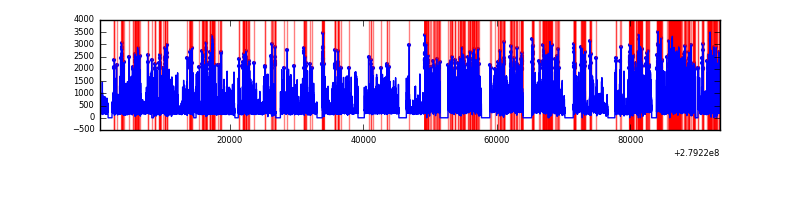 |
Top three noisy pixels from each quadrant. If the there are fewer than three noisy pixels in the level2.evt file, extra rows are filled as -1
| Pixel properties | Quadrant properties | ||||||
|---|---|---|---|---|---|---|---|
| Quadrant | DetID | PixID | Counts | Sigma | Mean | Median | Sigma |
| A | 0 | 29 | 4573 | 11.13 | 1241 | 1163 | 306.4 |
| A | 7 | 110 | 3749 | 8.44 | 1241 | 1163 | 306.4 |
| A | 9 | 19 | 3608 | 7.98 | 1241 | 1163 | 306.4 |
| B | 2 | 9 | 3754 | 10.86 | 1215 | 1160 | 238.8 |
| B | 2 | 8 | 3104 | 8.14 | 1215 | 1160 | 238.8 |
| B | 3 | 17 | 3090 | 8.08 | 1215 | 1160 | 238.8 |
| C | 1 | 81 | 3570 | 7.63 | 1236 | 1152 | 316.9 |
| C | 1 | 80 | 3559 | 7.59 | 1236 | 1152 | 316.9 |
| C | 2 | 191 | 3215 | 6.51 | 1236 | 1152 | 316.9 |
| D | 3 | 14 | 2819 | 5.95 | 1129 | 1027 | 301.1 |
| D | 6 | 231 | 2812 | 5.93 | 1129 | 1027 | 301.1 |
| D | 6 | 67 | 2761 | 5.76 | 1129 | 1027 | 301.1 |
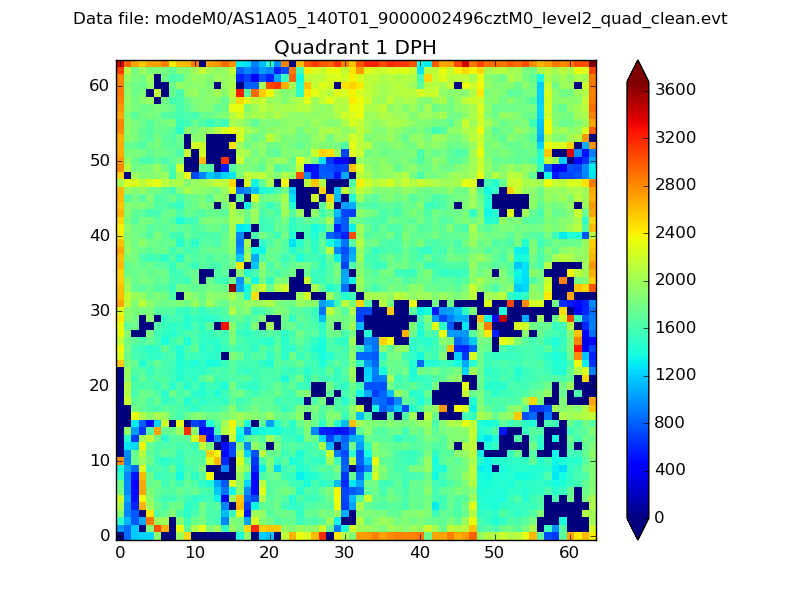
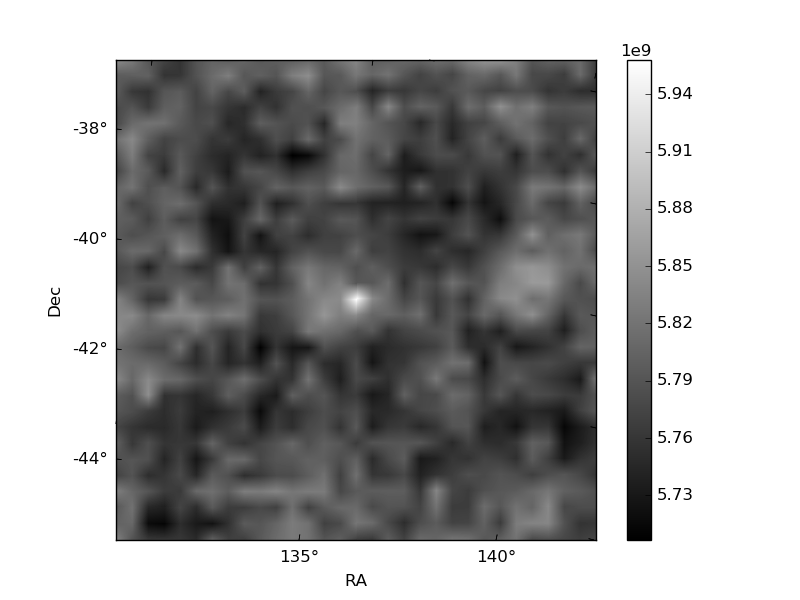
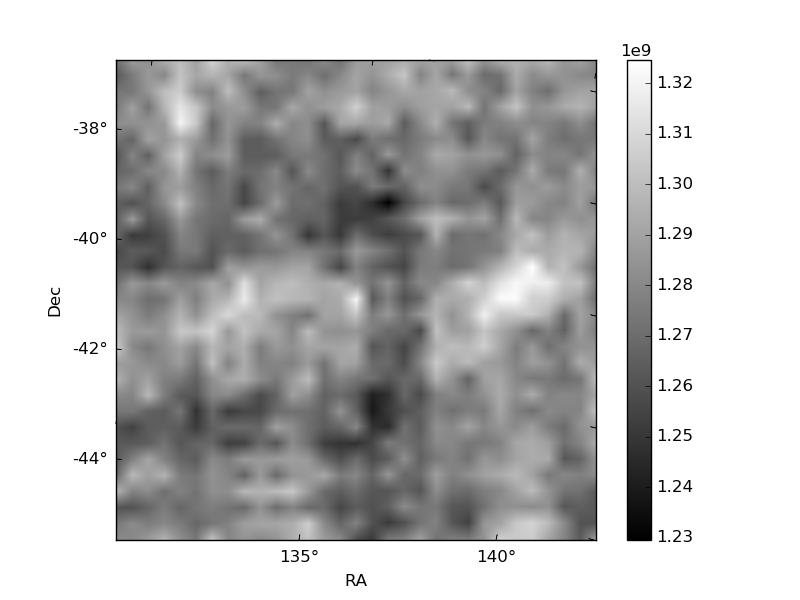
Histogram calculated using DETX and DETY for each event in the final _common_clean file
| Quadrant A |  |
 |
Quadrant B |
|---|---|---|---|
| Quadrant D |  |
 |
Quadrant C |
| Plot type | Count rate plots | Images |
|---|---|---|
| Comparison with Poisson distribution Blue bars denote a histogram of data divided into 1 sec bins. Red curve is a Poisson curve with rate = median count rate of data. |
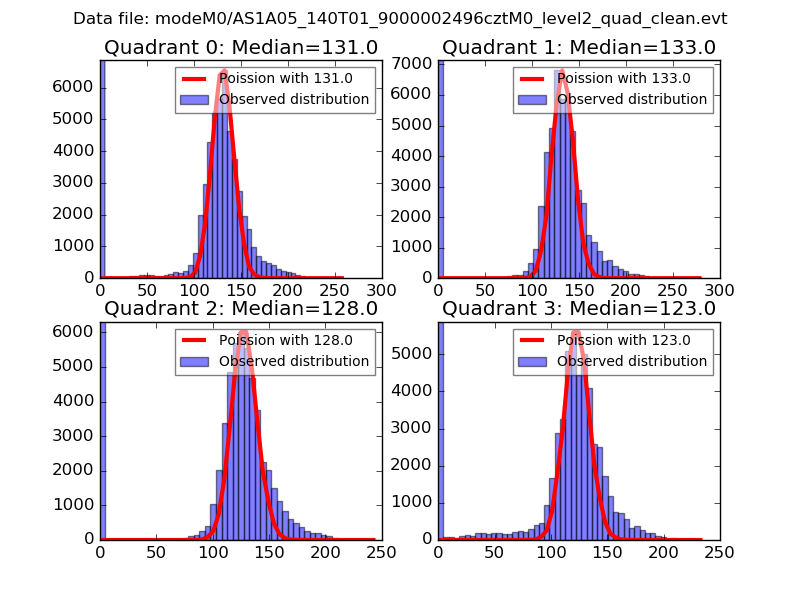 |
 |
| Quadrant-wise count rates Data is divided into 100 sec bins |
 |
|
| Module-wise count rates for Quadrant A Data is divided into 100 sec bins |
 |
 |
| Module-wise count rates for Quadrant B Data is divided into 100 sec bins |
 |
 |
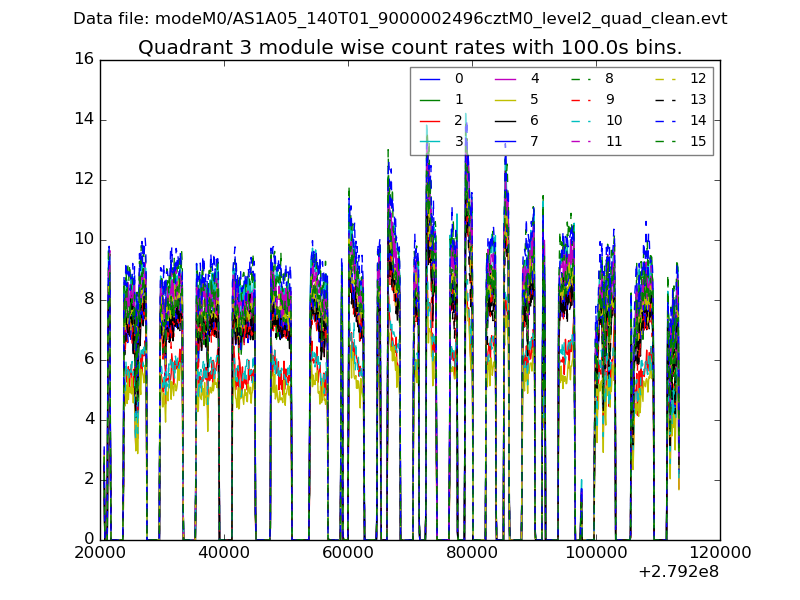
| Module-wise count rates for Quadrant C Data is divided into 100 sec bins |
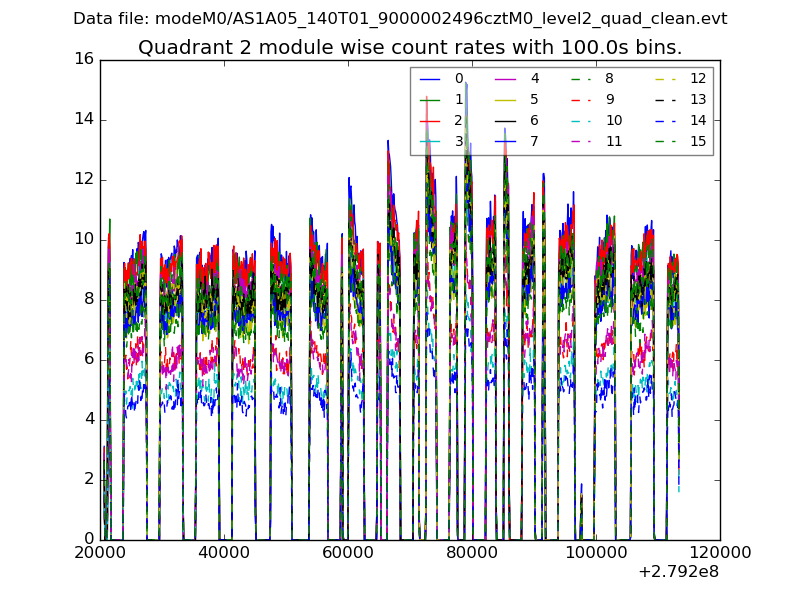 |
 |
| Module-wise count rates for Quadrant D Data is divided into 100 sec bins |
 |
 |
| Parameter | Plot |
|---|---|
| CZT HV Monitor |  |
| D_VDD |  |
| Temperature 1 |  |
| Veto HV Monitor |  |
| Veto LLD |  |
| Alpha Counter |  |
| _CPM_Rate |  |
| CZT Counter |  |
| +2.5 Volts monitor |  |
| +5 Volts monitor |  |
| _ROLL_ROT |  |
| _Roll_DEC | 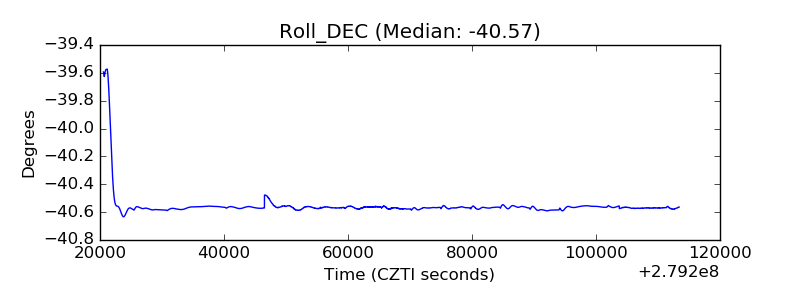 |
| _Roll_RA | 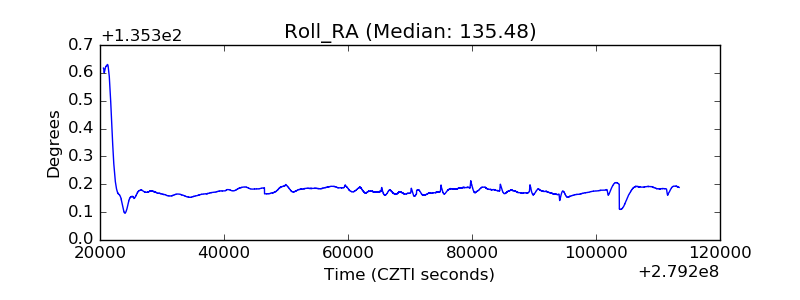 |
| Veto Counter | 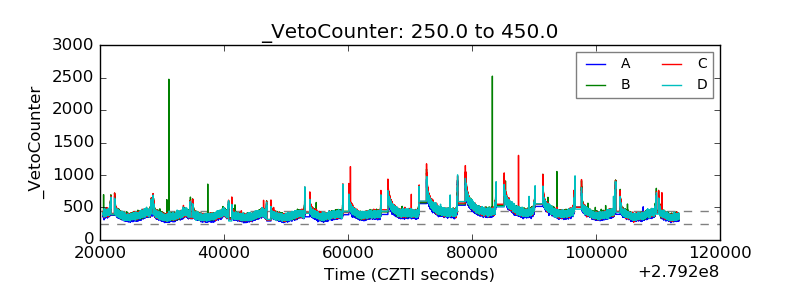 |