| Param | Original file | Final file |
|---|---|---|
| Filename | modeM0/AS1A05_140T01_9000002496_16808cztM0_level2.evt | modeM0/AS1A05_140T01_9000002496_16808cztM0_level2_quad_clean.evt |
| Size (bytes) | 210,790,080 | 25,162,560 |
| Size | 201.0 MB | 24.0 MB |
| Events in quadrant A | 1,424,235 | 144,867 |
| Events in quadrant B | 1,709,222 | 147,461 |
| Events in quadrant C | 1,454,384 | 140,930 |
| Events in quadrant D | 1,615,278 | 139,550 |
| Mode SS | |||
|---|---|---|---|
| Quadrant | BADHDUFLAG | Total packets | Discarded packets |
| A | 0 | 54 | 0 |
| B | 0 | 54 | 0 |
| C | 0 | 54 | 0 |
| D | 0 | 54 | 0 |
| Mode M0 | |||
|---|---|---|---|
| Quadrant | BADHDUFLAG | Total packets | Discarded packets |
| A | 0 | 5759 | 2 |
| B | 0 | 6709 | 1 |
| C | 0 | 5932 | 1 |
| D | 0 | 6445 | 1 |
| Mode M9 | |||
|---|---|---|---|
| Quadrant | BADHDUFLAG | Total packets | Discarded packets |
| A | 0 | 6 | 0 |
| B | 0 | 6 | 0 |
| C | 0 | 6 | 0 |
| D | 0 | 6 | 0 |
| Quadrant | Total seconds | Saturated seconds | Saturation percentage |
|---|---|---|---|
| A | 2633 | 71 | 2.696544% |
| B | 2633 | 173 | 6.570452% |
| C | 2633 | 74 | 2.810482% |
| D | 2633 | 54 | 2.050893% |
Noise dominated data is calculated using 1-second bins in cleaned event files. If a bin has >2000 counts, and if more than 50% of those come from <1% of pixels, then it is considered to be noise-dominated and hence unusable.
| Quadrant | # 1 sec bins | Bins with >0 counts | Bins with >2000 counts | High rate bins dominated by noise | Noise dominated (total time) | Noise dominated (detector-on time) | Marked lightcurve |
|---|---|---|---|---|---|---|---|
| A | 3224 | 2635 | 2 | 2 | 0.06% | 0.08% | 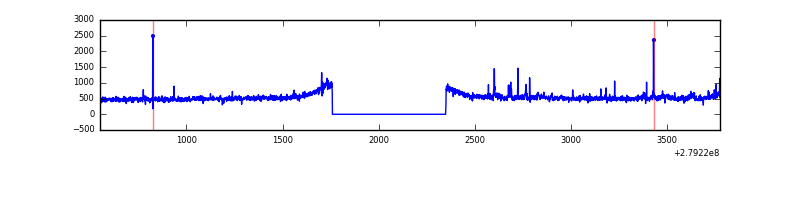 |
| B | 3224 | 2635 | 47 | 47 | 1.46% | 1.78% | 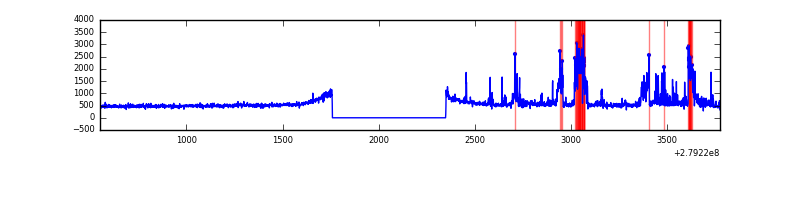 |
| C | 3224 | 2635 | 0 | 0 | 0.00% | 0.00% | 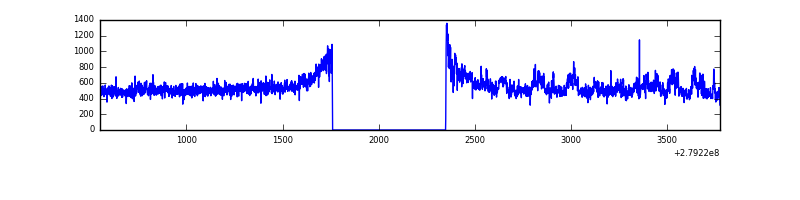 |
| D | 3224 | 2635 | 25 | 25 | 0.78% | 0.95% | 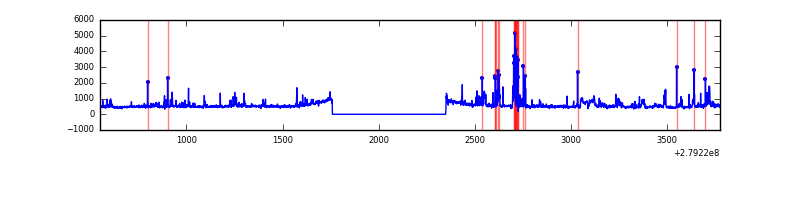 |
Top three noisy pixels from each quadrant. If the there are fewer than three noisy pixels in the level2.evt file, extra rows are filled as -1
| Pixel properties | Quadrant properties | ||||||
|---|---|---|---|---|---|---|---|
| Quadrant | DetID | PixID | Counts | Sigma | Mean | Median | Sigma |
| A | 15 | 174 | 61499 | 827.54 | 352 | 344 | 73.9 |
| A | 9 | 143 | 3800 | 46.77 | 352 | 344 | 73.9 |
| A | 0 | 226 | 3300 | 40.0 | 352 | 344 | 73.9 |
| B | 7 | 220 | 146350 | 2134.04 | 343 | 334 | 68.4 |
| B | 0 | 229 | 108366 | 1578.9 | 343 | 334 | 68.4 |
| B | 15 | 35 | 82184 | 1196.25 | 343 | 334 | 68.4 |
| C | 3 | 233 | 105293 | 1316.76 | 332 | 334 | 79.7 |
| C | 14 | 238 | 50699 | 631.85 | 332 | 334 | 79.7 |
| C | 13 | 61 | 2347 | 25.25 | 332 | 334 | 79.7 |
| D | 1 | 52 | 222258 | 2616.46 | 341 | 331 | 84.8 |
| D | 15 | 0 | 44273 | 518.06 | 341 | 331 | 84.8 |
| D | 12 | 218 | 39213 | 458.41 | 341 | 331 | 84.8 |
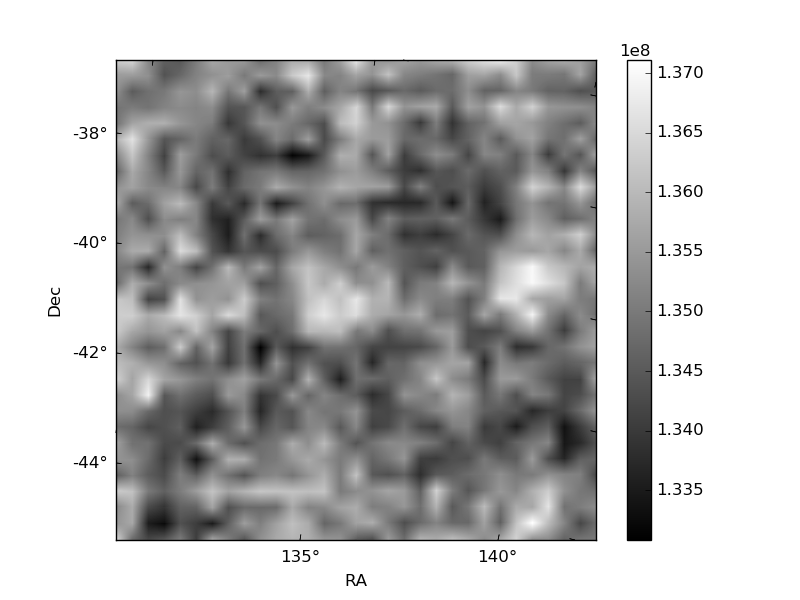
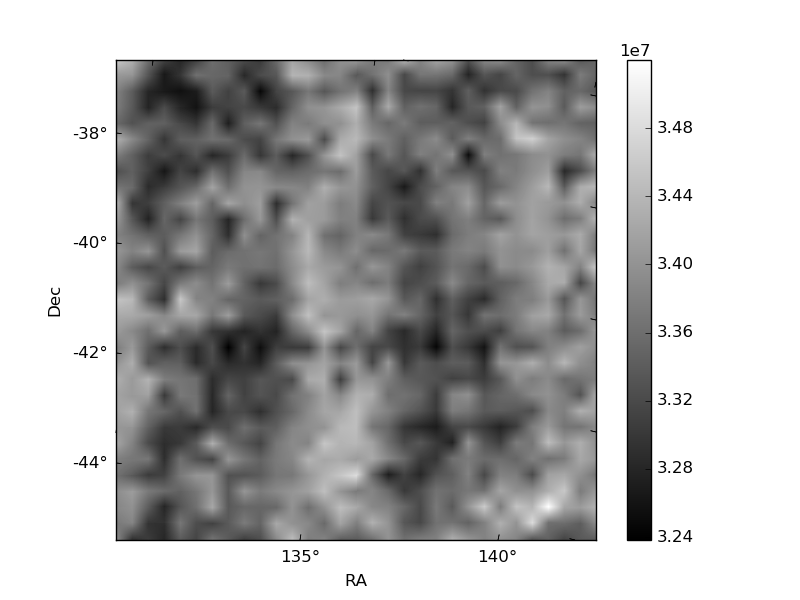
Histogram calculated using DETX and DETY for each event in the final _common_clean file
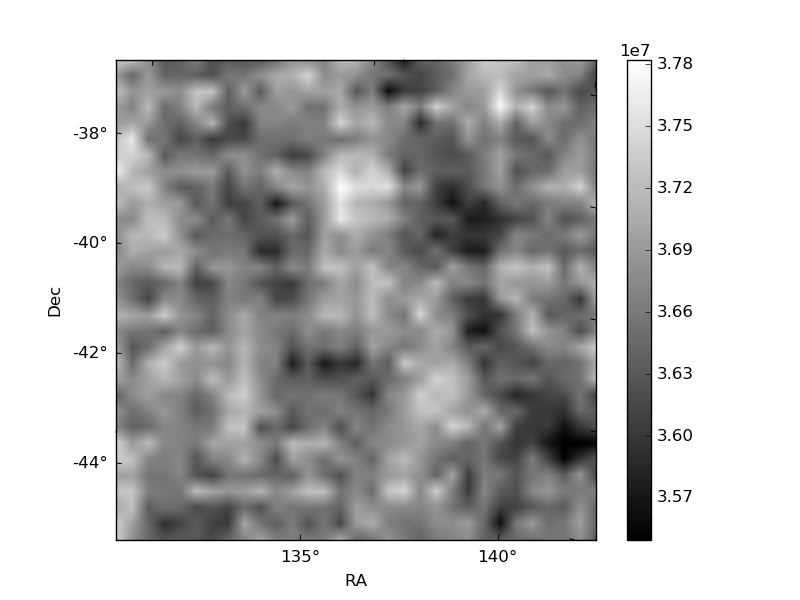
| Quadrant A | 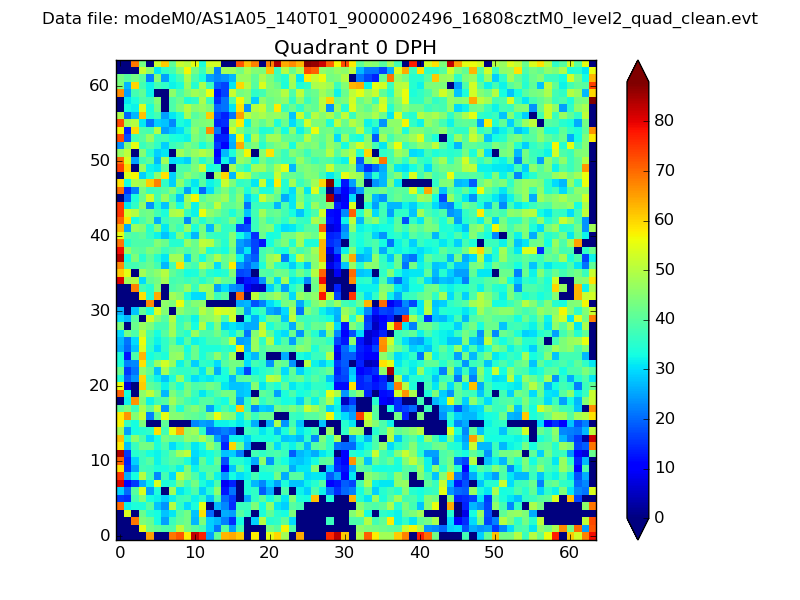 |
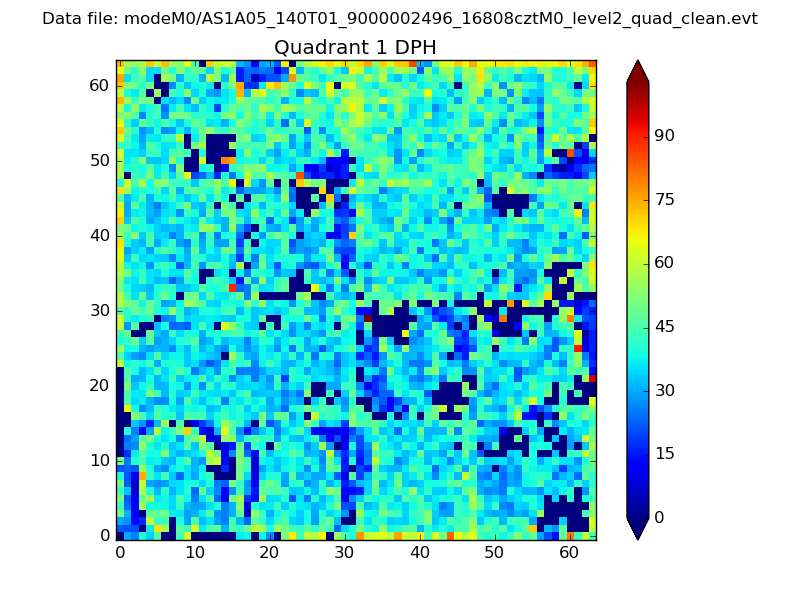 |
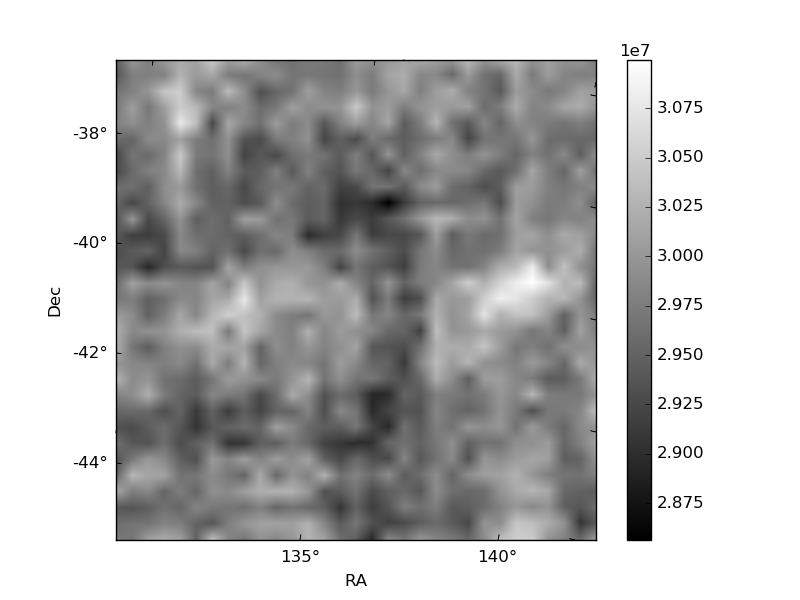
Quadrant B |
|---|---|---|---|
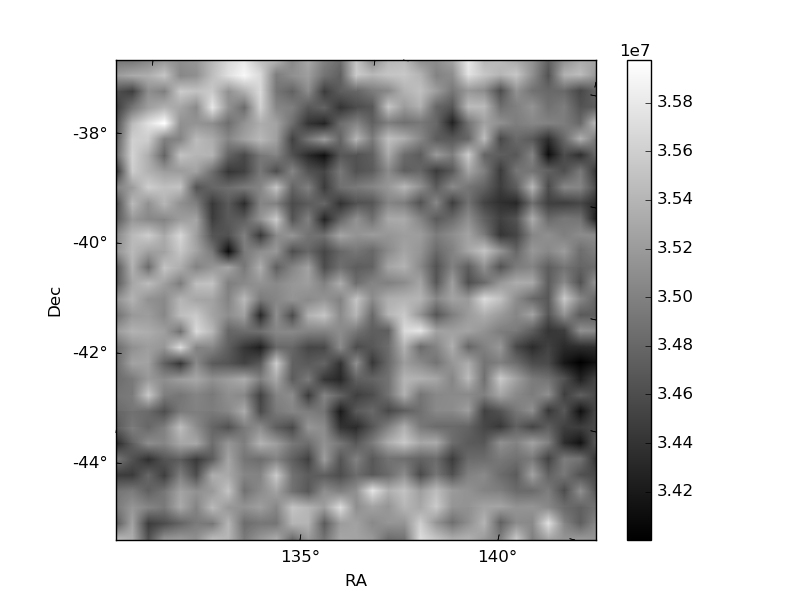
| Quadrant D |  |
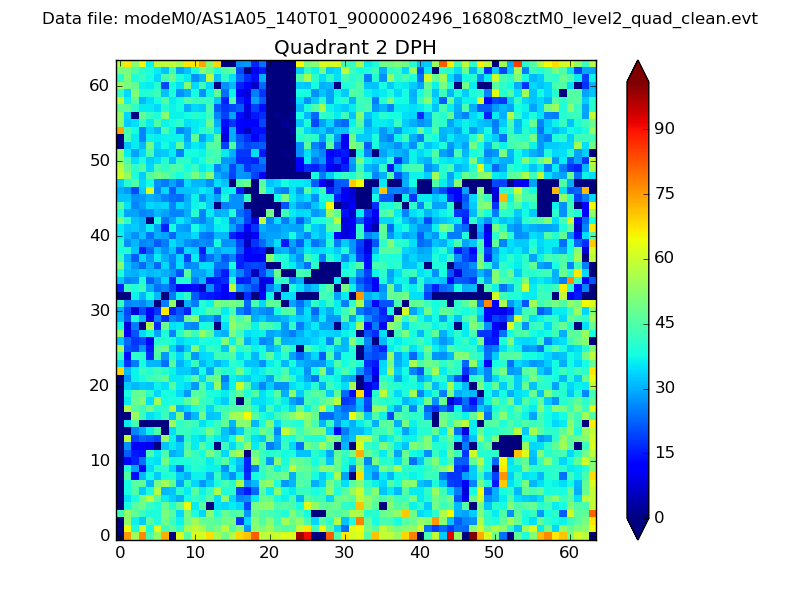 |
Quadrant C |
| Plot type | Count rate plots | Images |
|---|---|---|
| Comparison with Poisson distribution Blue bars denote a histogram of data divided into 1 sec bins. Red curve is a Poisson curve with rate = median count rate of data. |
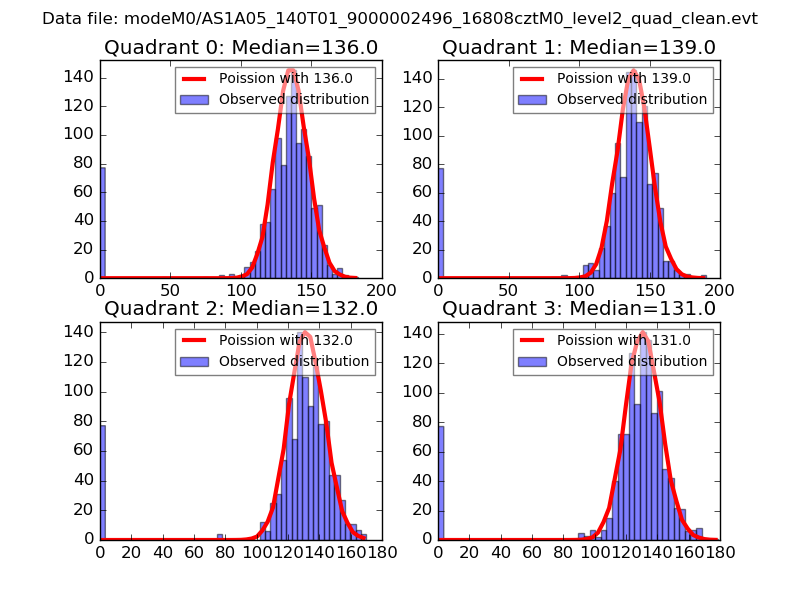 |
 |
| Quadrant-wise count rates Data is divided into 100 sec bins |
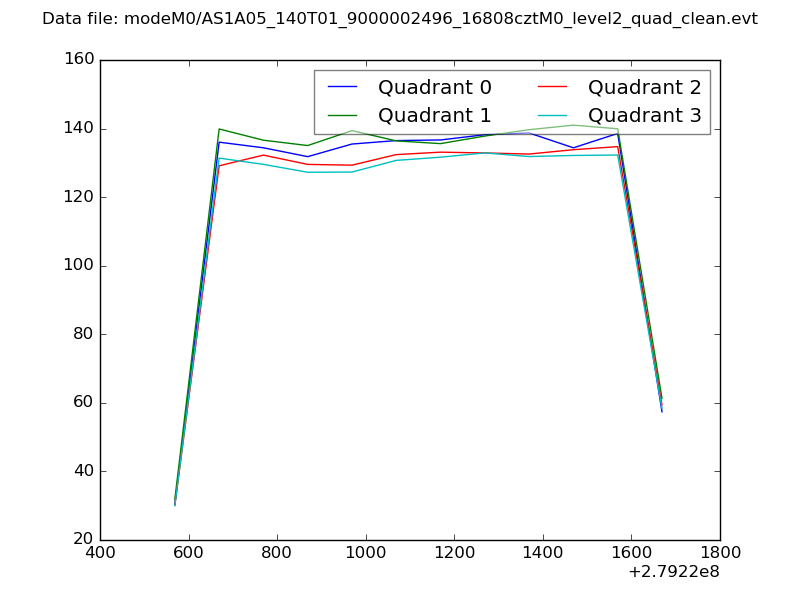 |
|
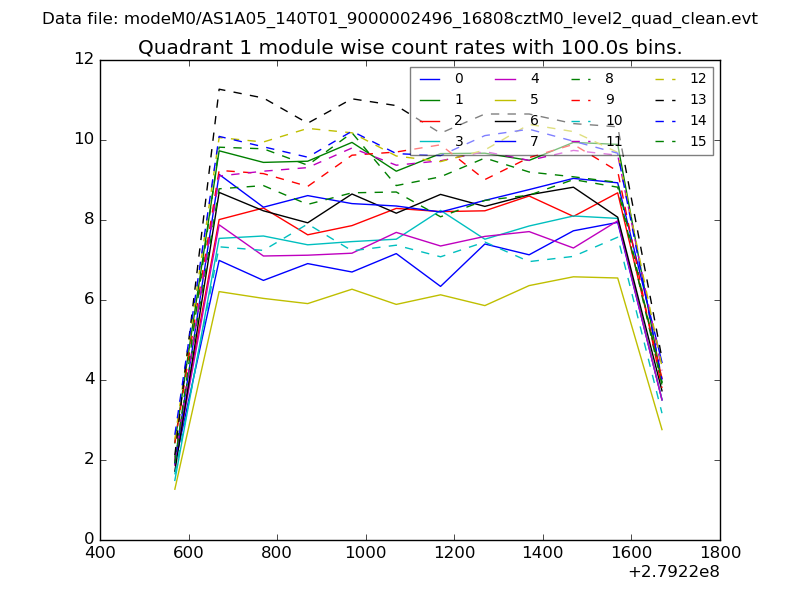
| Module-wise count rates for Quadrant A Data is divided into 100 sec bins |
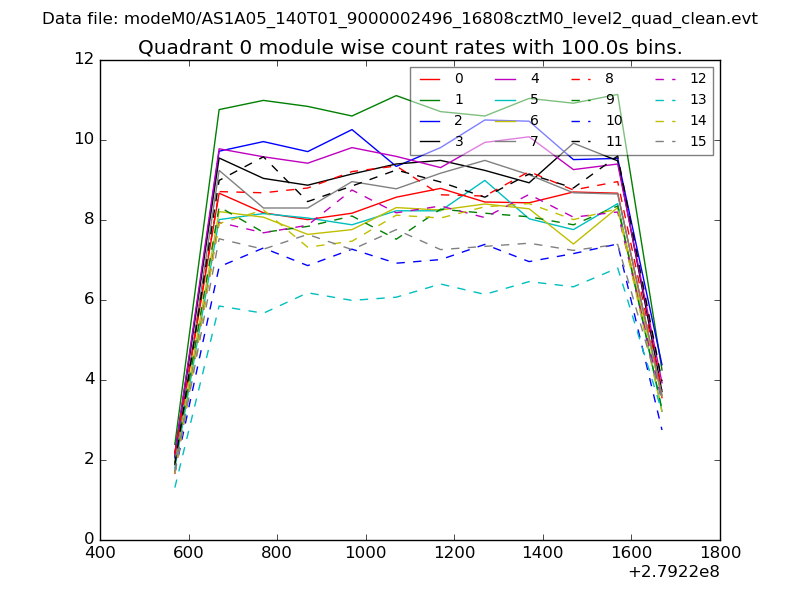 |
 |
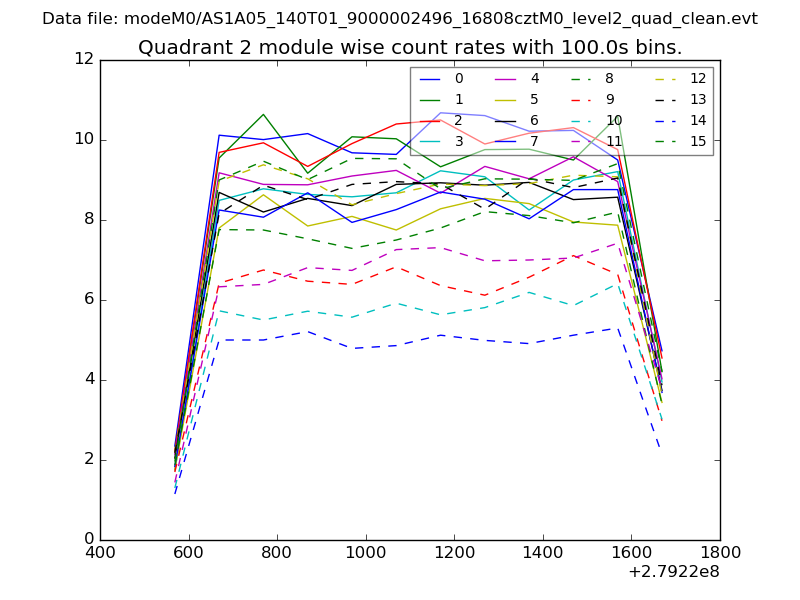
| Module-wise count rates for Quadrant B Data is divided into 100 sec bins |
 |
 |
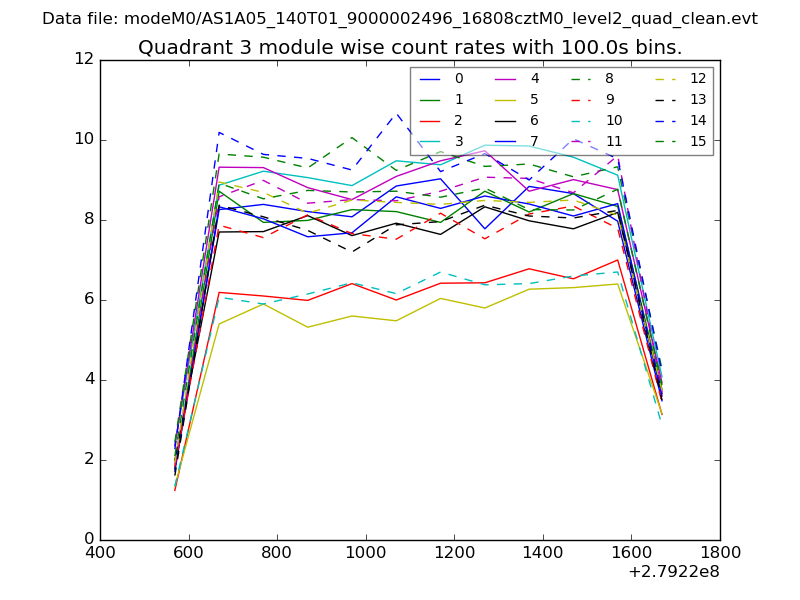
| Module-wise count rates for Quadrant C Data is divided into 100 sec bins |
 |
 |
| Module-wise count rates for Quadrant D Data is divided into 100 sec bins |
 |
 |
| Parameter | Plot |
|---|---|
| CZT HV Monitor | 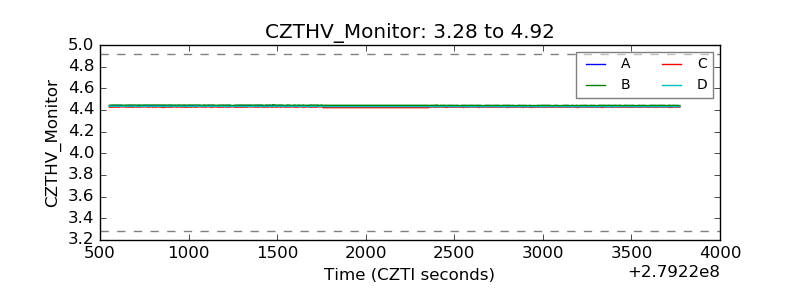 |
| D_VDD | 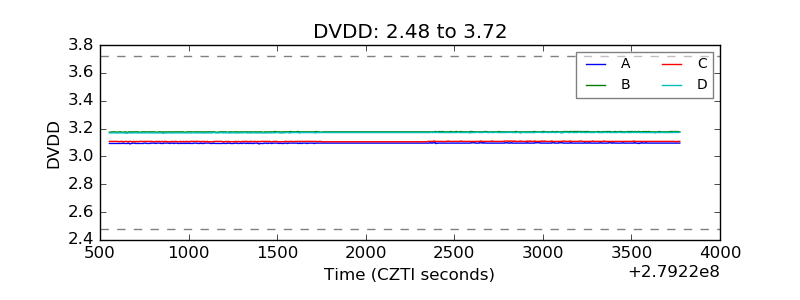 |
| Temperature 1 | 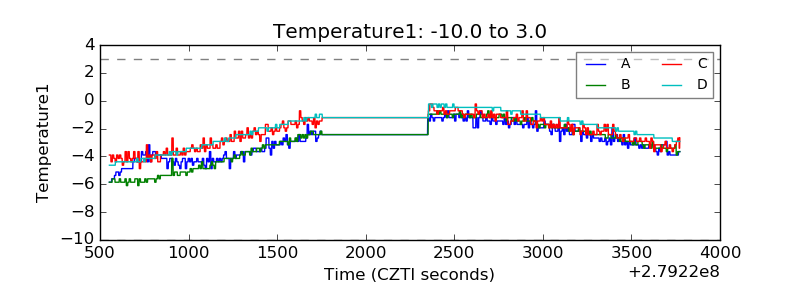 |
| Veto HV Monitor | 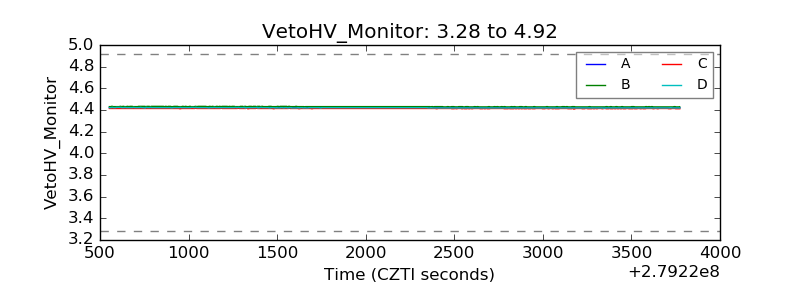 |
| Veto LLD | 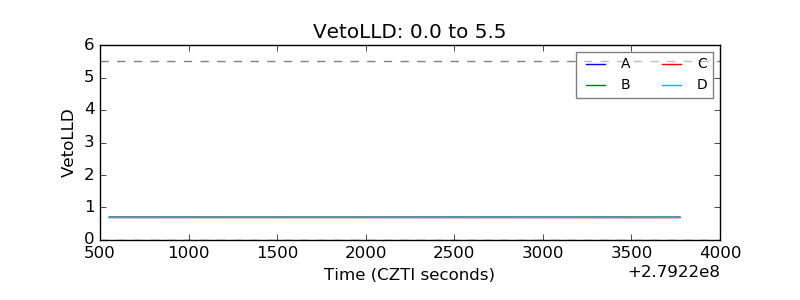 |
| Alpha Counter | 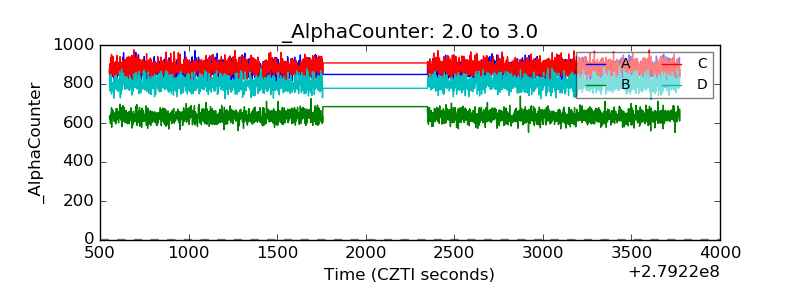 |
| _CPM_Rate | 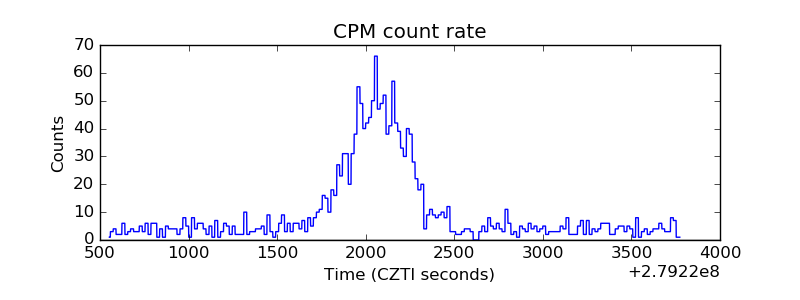 |
| CZT Counter | 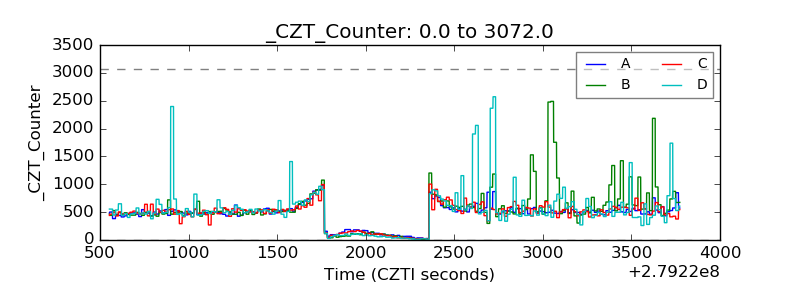 |
| +2.5 Volts monitor | 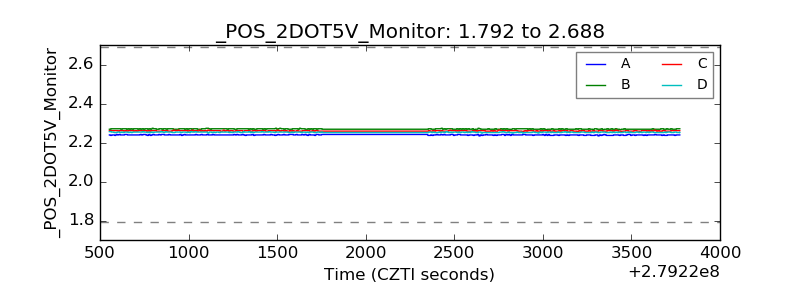 |
| +5 Volts monitor | 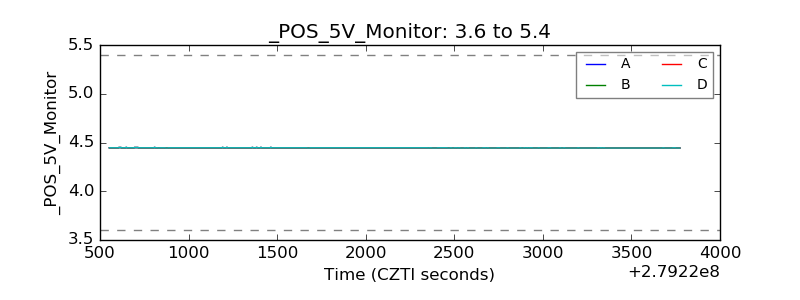 |
| _ROLL_ROT | 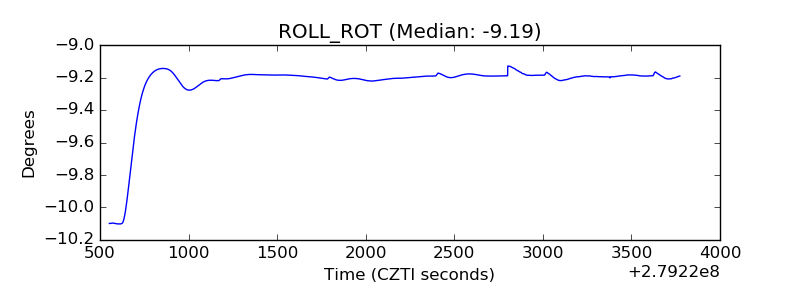 |
| _Roll_DEC | 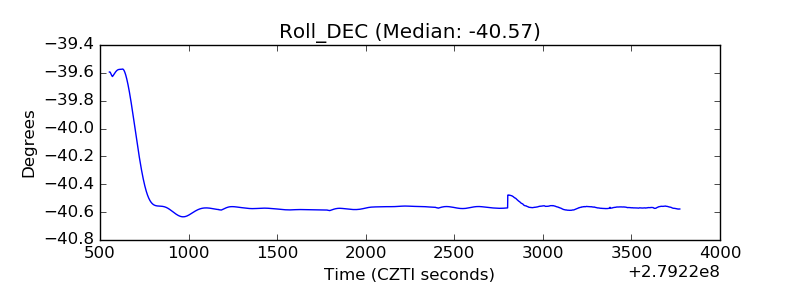 |
| _Roll_RA | 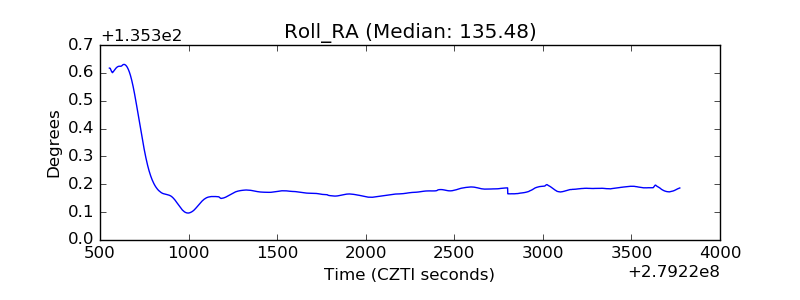 |
| Veto Counter | 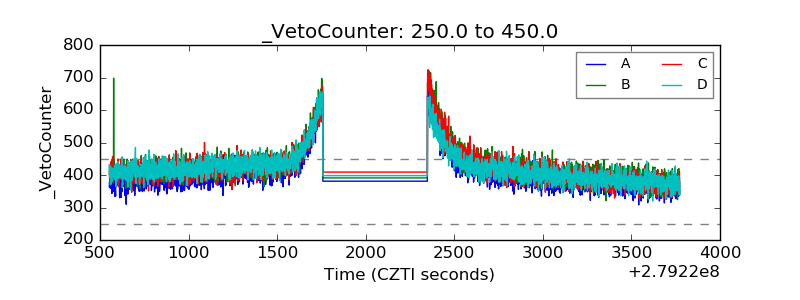 |