| Param | Original file | Final file |
|---|---|---|
| Filename | modeM0/AS1A05_140T01_9000002496_16809cztM0_level2.evt | modeM0/AS1A05_140T01_9000002496_16809cztM0_level2_quad_clean.evt |
| Size (bytes) | 626,958,720 | 84,758,400 |
| Size | 597.9 MB | 80.8 MB |
| Events in quadrant A | 4,395,012 | 523,963 |
| Events in quadrant B | 4,473,153 | 529,819 |
| Events in quadrant C | 3,991,022 | 509,136 |
| Events in quadrant D | 5,614,473 | 475,910 |
| Mode SS | |||
|---|---|---|---|
| Quadrant | BADHDUFLAG | Total packets | Discarded packets |
| A | 0 | 156 | 0 |
| B | 0 | 156 | 0 |
| C | 0 | 156 | 0 |
| D | 0 | 156 | 0 |
| Mode M0 | |||
|---|---|---|---|
| Quadrant | BADHDUFLAG | Total packets | Discarded packets |
| A | 0 | 17955 | 2 |
| B | 0 | 18214 | 2 |
| C | 0 | 16691 | 2 |
| D | 0 | 21639 | 2 |
| Mode M9 | |||
|---|---|---|---|
| Quadrant | BADHDUFLAG | Total packets | Discarded packets |
| A | 0 | 8 | 0 |
| B | 0 | 8 | 0 |
| C | 0 | 8 | 0 |
| D | 0 | 8 | 0 |
| Quadrant | Total seconds | Saturated seconds | Saturation percentage |
|---|---|---|---|
| A | 7582 | 283 | 3.732524% |
| B | 7583 | 296 | 3.903468% |
| C | 7583 | 170 | 2.241857% |
| D | 7583 | 538 | 7.094817% |
Noise dominated data is calculated using 1-second bins in cleaned event files. If a bin has >2000 counts, and if more than 50% of those come from <1% of pixels, then it is considered to be noise-dominated and hence unusable.
| Quadrant | # 1 sec bins | Bins with >0 counts | Bins with >2000 counts | High rate bins dominated by noise | Noise dominated (total time) | Noise dominated (detector-on time) | Marked lightcurve |
|---|---|---|---|---|---|---|---|
| A | 8438 | 7585 | 58 | 58 | 0.69% | 0.76% | 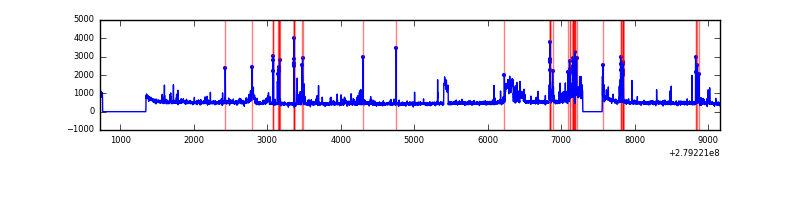 |
| B | 8439 | 7586 | 57 | 57 | 0.68% | 0.75% | 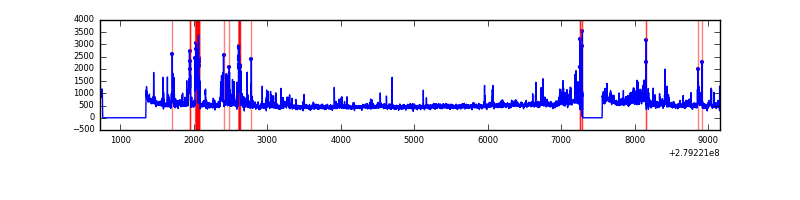 |
| C | 8439 | 7586 | 0 | 0 | 0.00% | 0.00% | 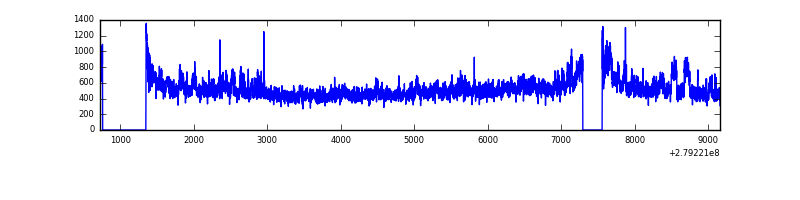 |
| D | 8439 | 7585 | 363 | 363 | 4.30% | 4.79% | 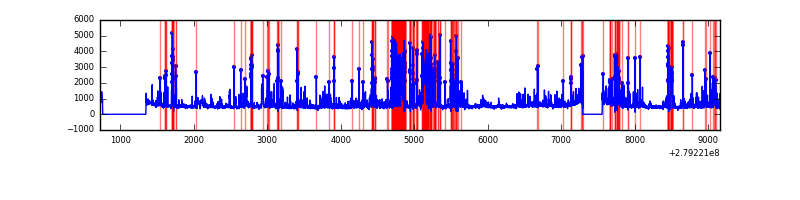 |
Top three noisy pixels from each quadrant. If the there are fewer than three noisy pixels in the level2.evt file, extra rows are filled as -1
| Pixel properties | Quadrant properties | ||||||
|---|---|---|---|---|---|---|---|
| Quadrant | DetID | PixID | Counts | Sigma | Mean | Median | Sigma |
| A | 15 | 174 | 753147 | 3942.4 | 934 | 913 | 190.8 |
| A | 9 | 143 | 51823 | 266.82 | 934 | 913 | 190.8 |
| A | 0 | 226 | 8411 | 39.3 | 934 | 913 | 190.8 |
| B | 15 | 35 | 229818 | 1261.41 | 929 | 903 | 181.5 |
| B | 7 | 220 | 185980 | 1019.84 | 929 | 903 | 181.5 |
| B | 0 | 229 | 175091 | 959.84 | 929 | 903 | 181.5 |
| C | 3 | 233 | 364331 | 1739.73 | 893 | 898 | 208.9 |
| C | 14 | 238 | 138378 | 658.11 | 893 | 898 | 208.9 |
| C | 13 | 61 | 6294 | 25.83 | 893 | 898 | 208.9 |
| D | 1 | 52 | 1699873 | 7839.64 | 882 | 854 | 216.7 |
| D | 12 | 218 | 193030 | 886.74 | 882 | 854 | 216.7 |
| D | 13 | 248 | 185965 | 854.14 | 882 | 854 | 216.7 |
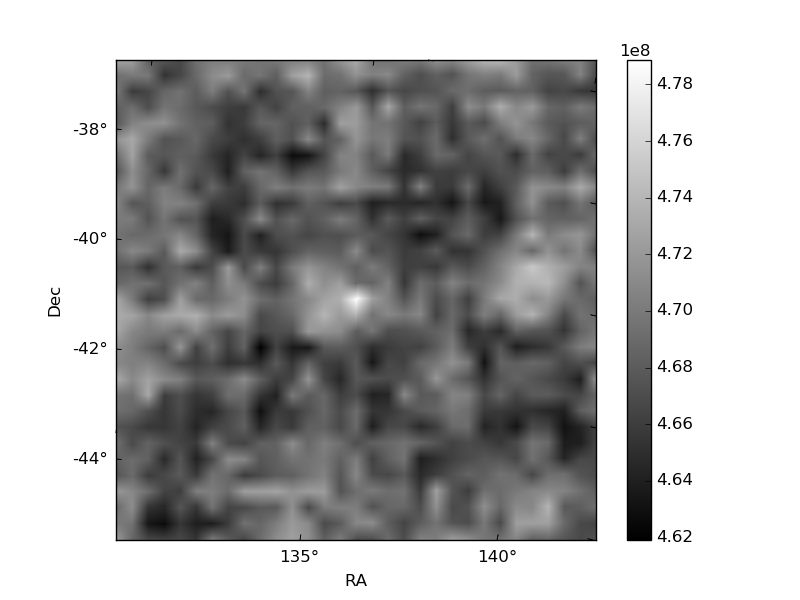
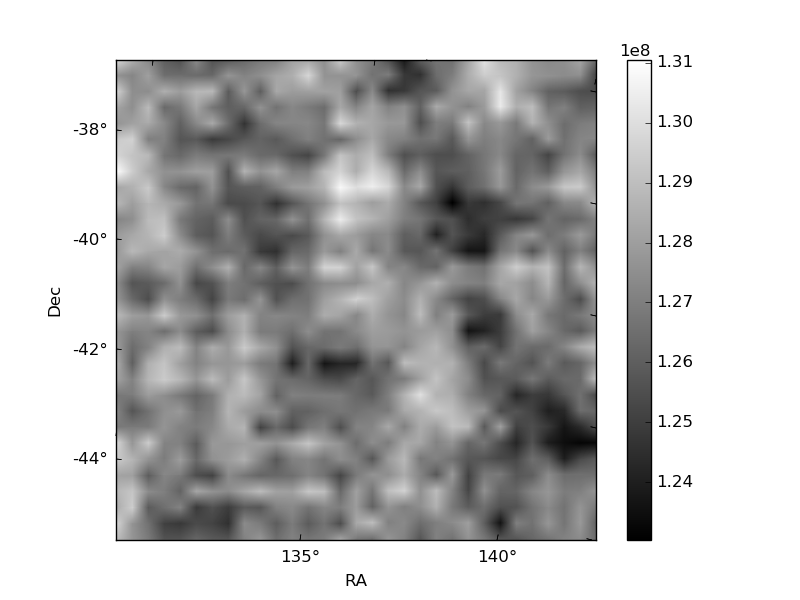
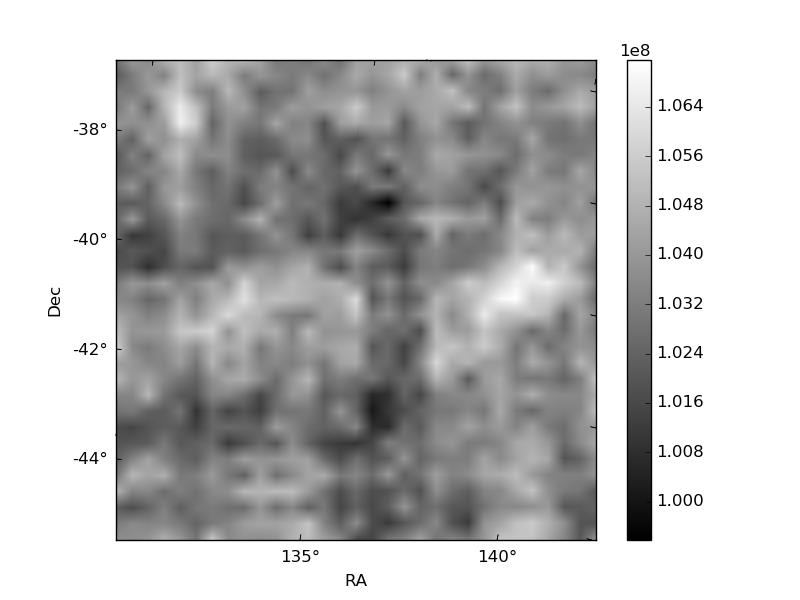
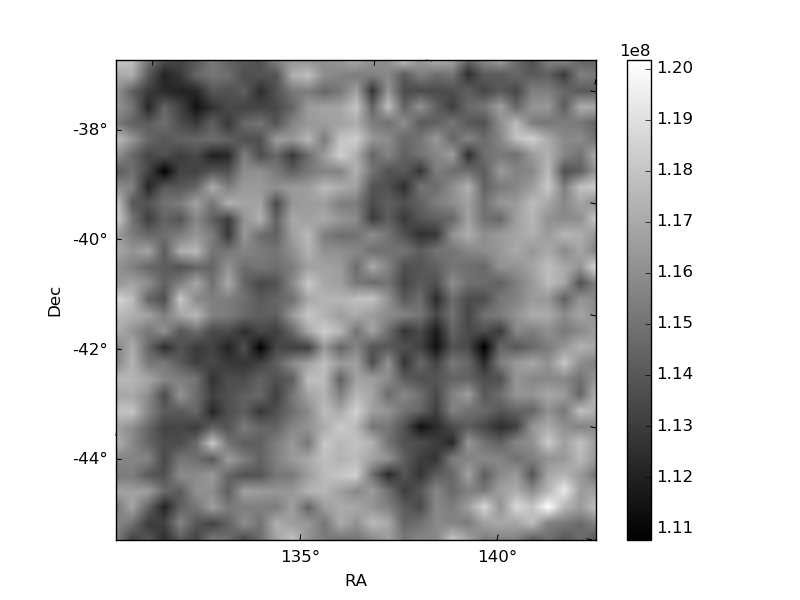
Histogram calculated using DETX and DETY for each event in the final _common_clean file
| Quadrant A | 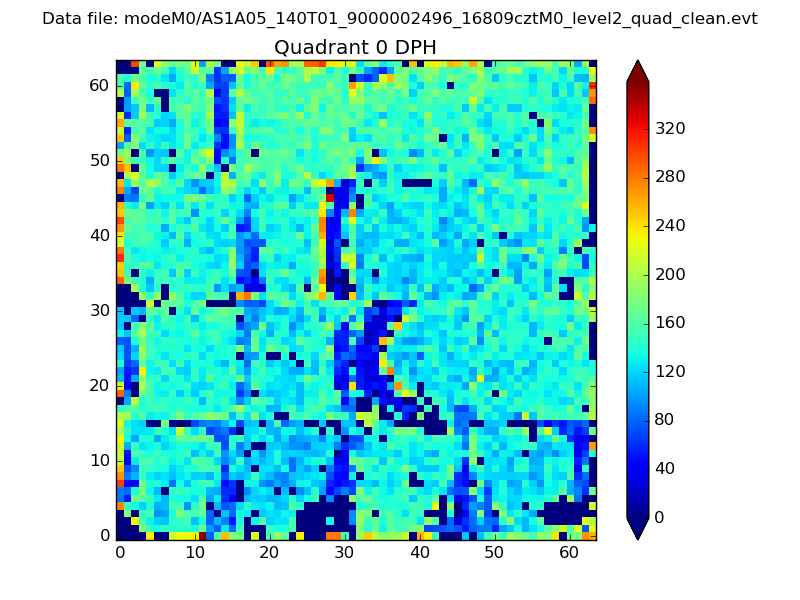 |
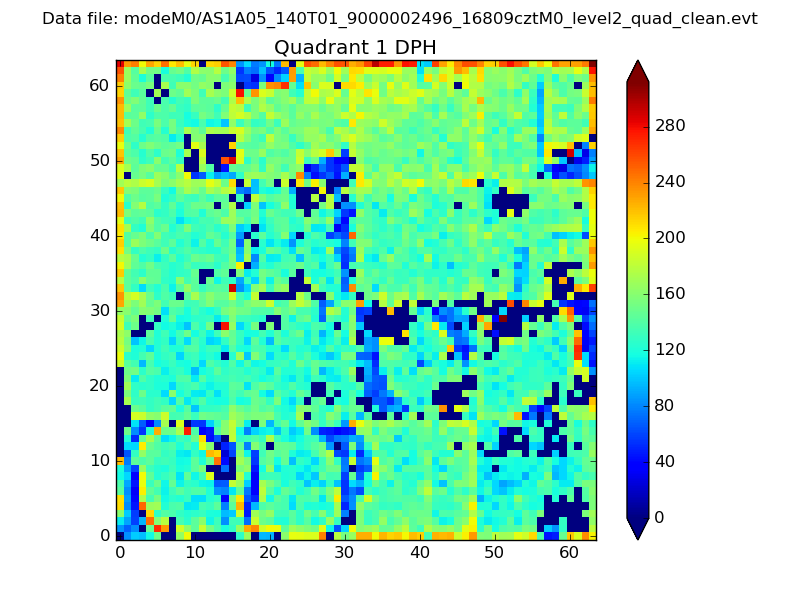 |
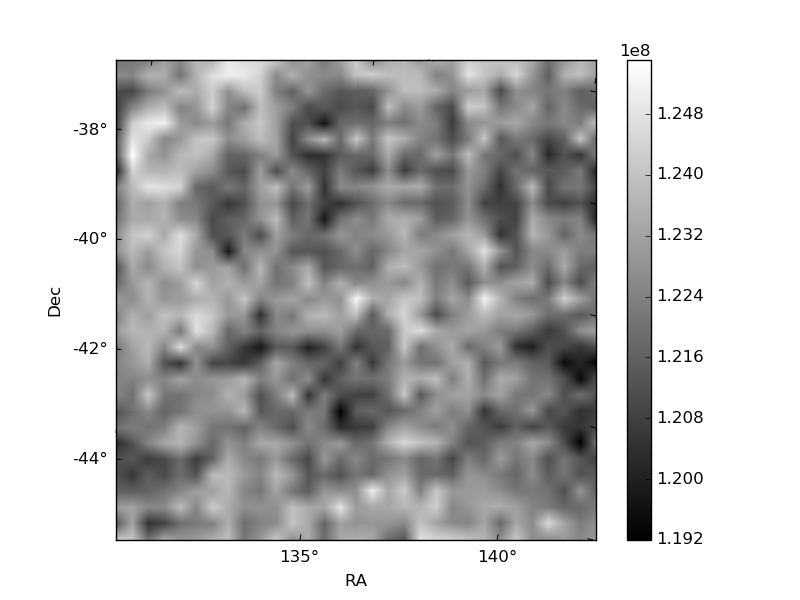
Quadrant B |
|---|---|---|---|
| Quadrant D | 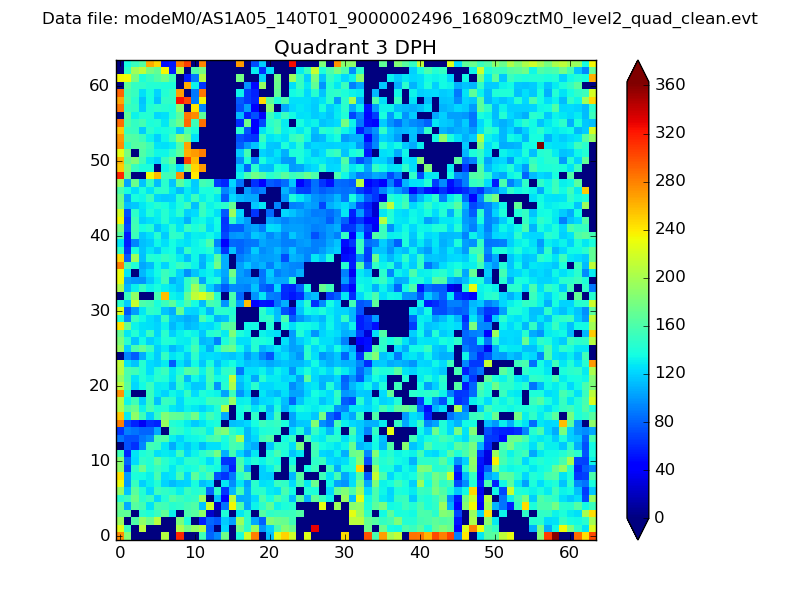 |
 |
Quadrant C |
| Plot type | Count rate plots | Images |
|---|---|---|
| Comparison with Poisson distribution Blue bars denote a histogram of data divided into 1 sec bins. Red curve is a Poisson curve with rate = median count rate of data. |
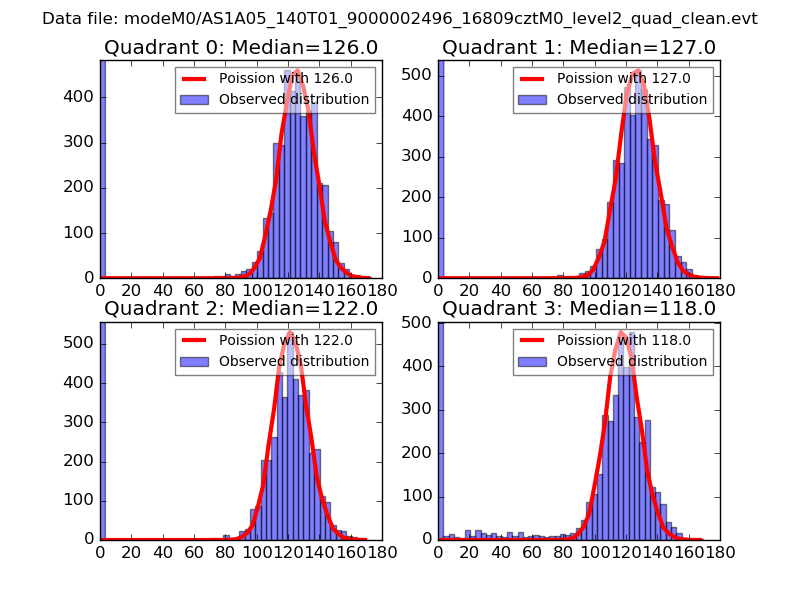 |
 |
| Quadrant-wise count rates Data is divided into 100 sec bins |
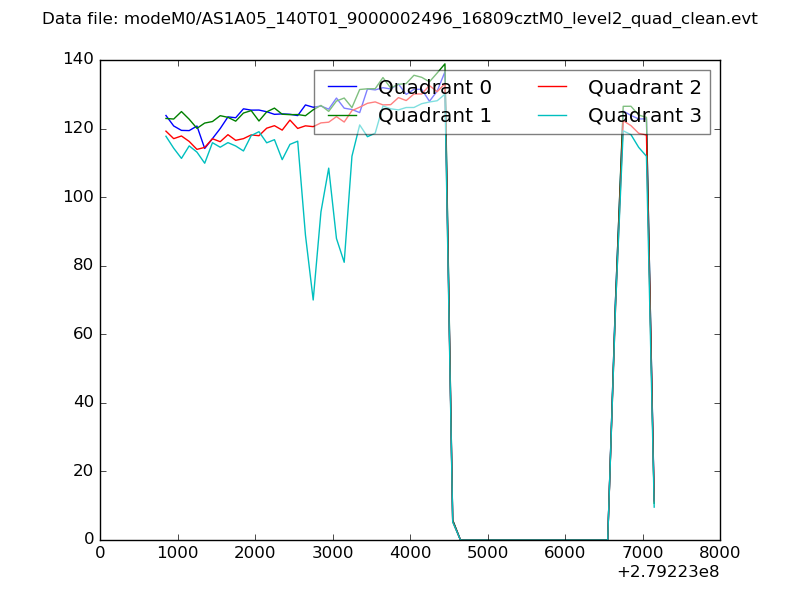 |
|
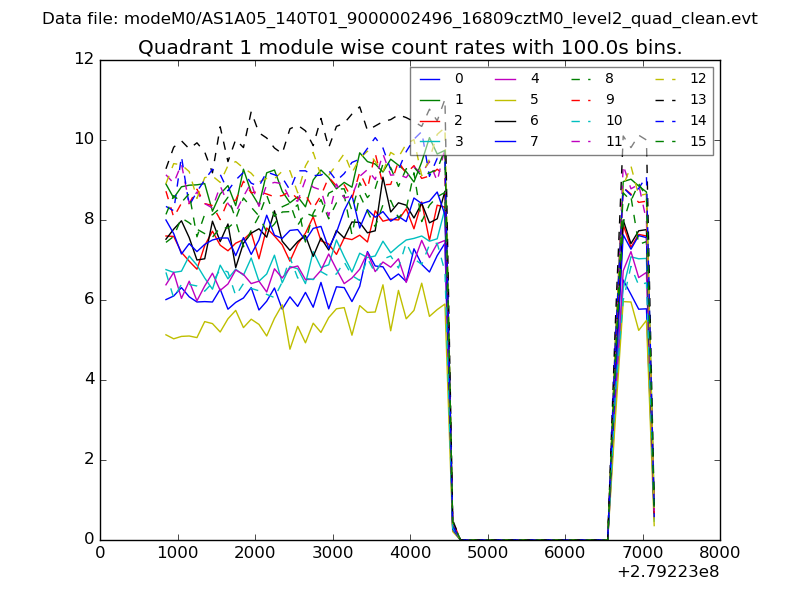
| Module-wise count rates for Quadrant A Data is divided into 100 sec bins |
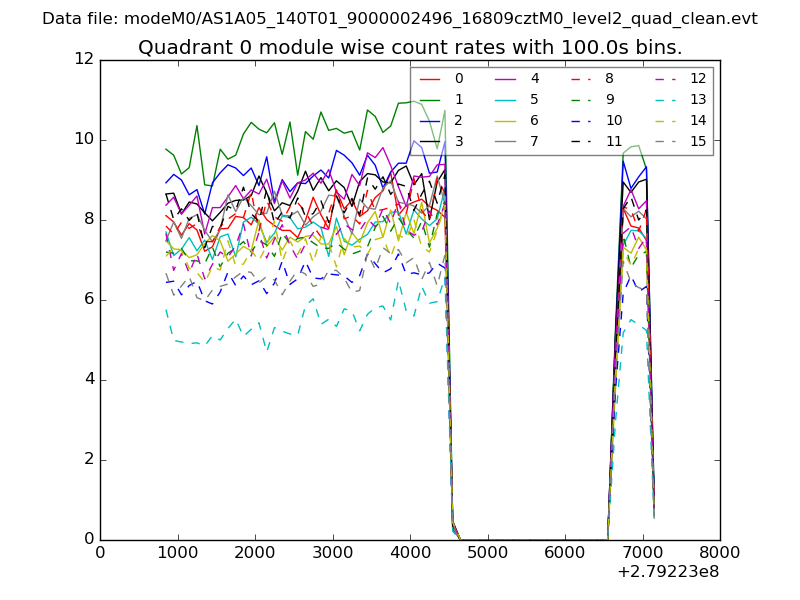 |
 |
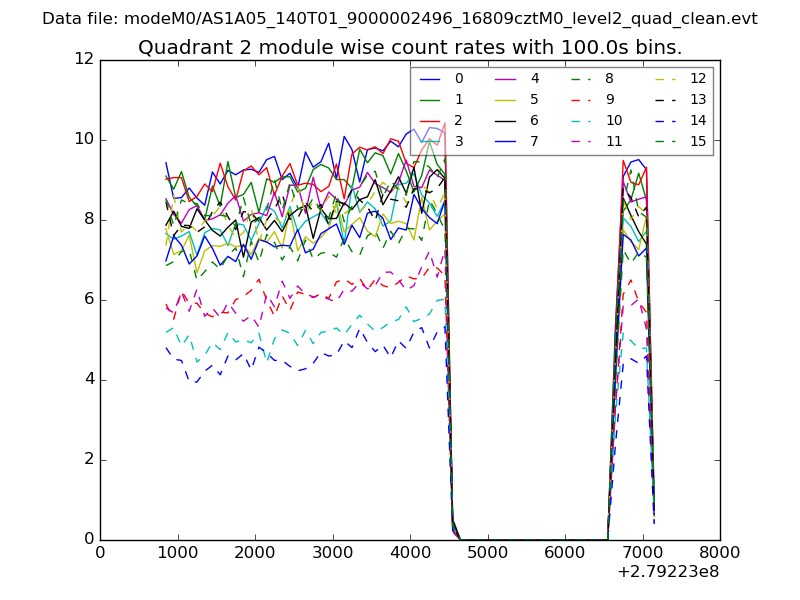
| Module-wise count rates for Quadrant B Data is divided into 100 sec bins |
 |
 |
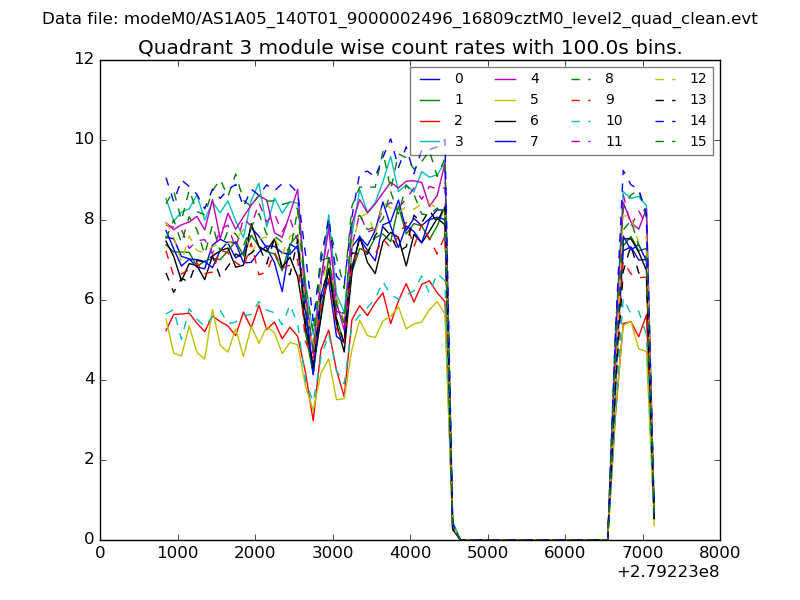
| Module-wise count rates for Quadrant C Data is divided into 100 sec bins |
 |
 |
| Module-wise count rates for Quadrant D Data is divided into 100 sec bins |
 |
 |
| Parameter | Plot |
|---|---|
| CZT HV Monitor | 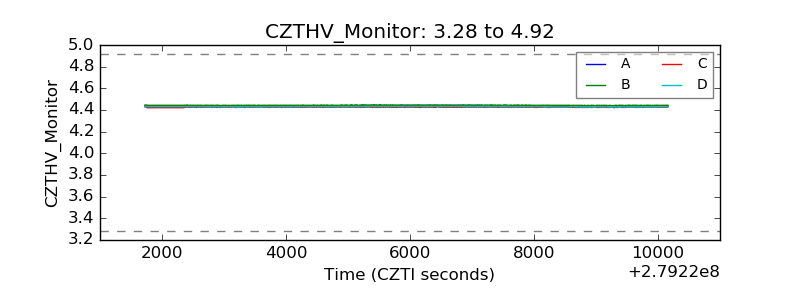 |
| D_VDD | 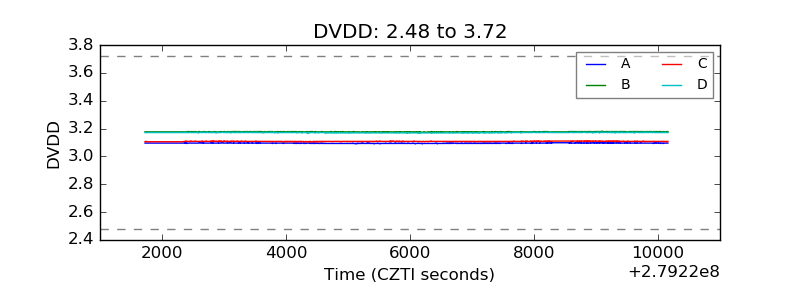 |
| Temperature 1 | 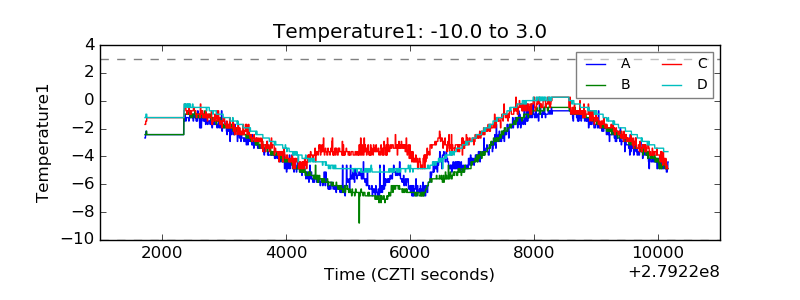 |
| Veto HV Monitor | 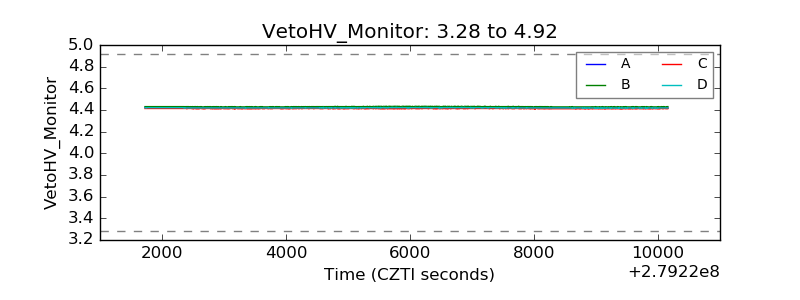 |
| Veto LLD |  |
| Alpha Counter | 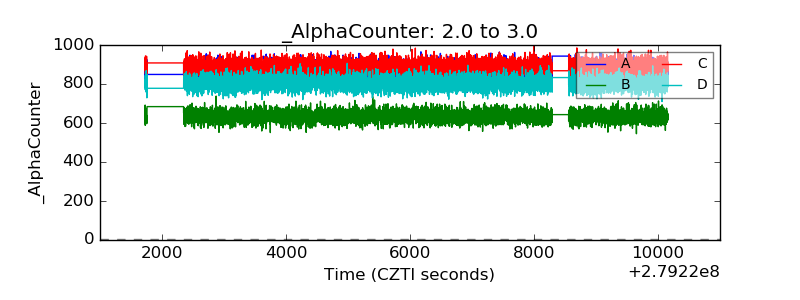 |
| _CPM_Rate | 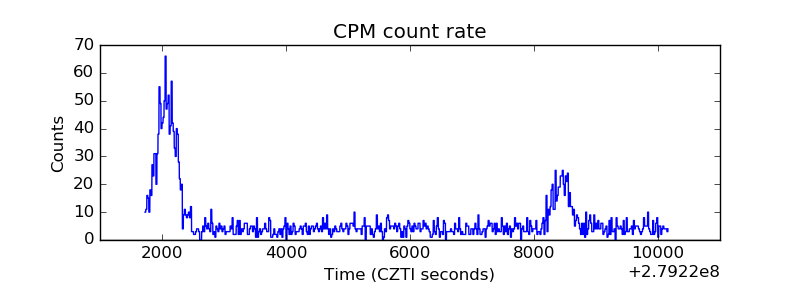 |
| CZT Counter | 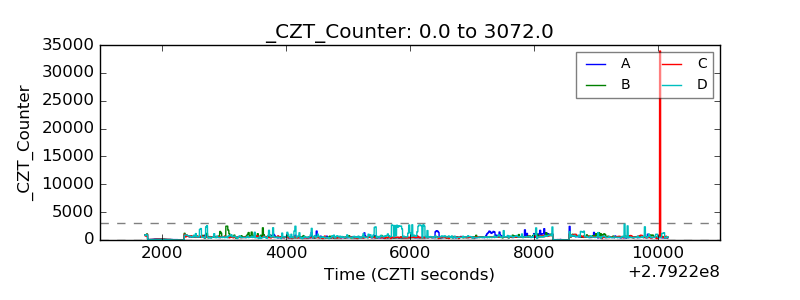 |
| +2.5 Volts monitor | 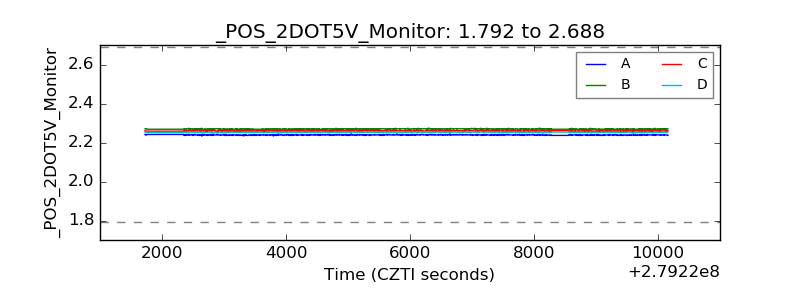 |
| +5 Volts monitor | 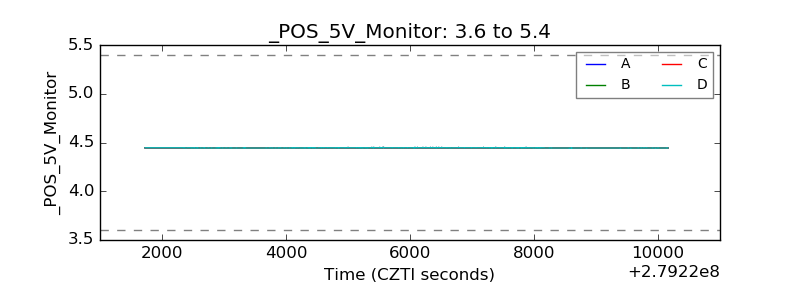 |
| _ROLL_ROT | 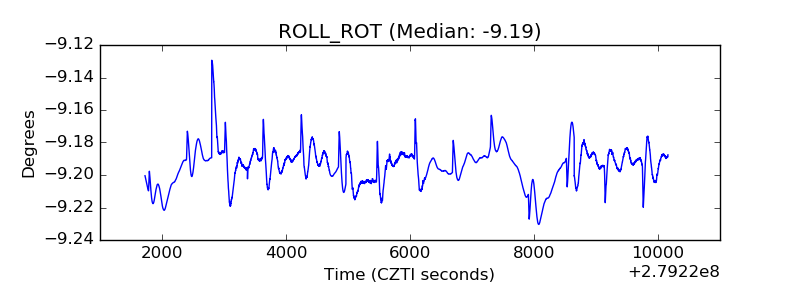 |
| _Roll_DEC |  |
| _Roll_RA | 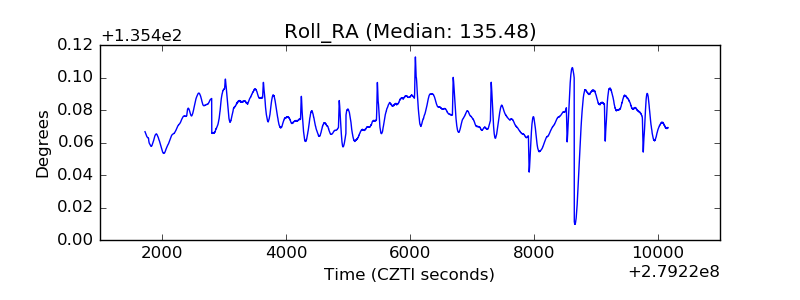 |
| Veto Counter | 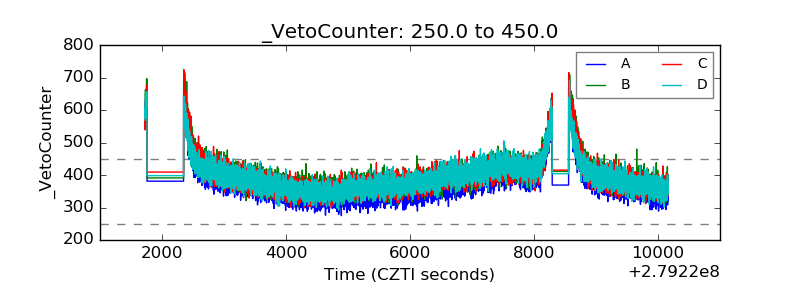 |